. 2021 Jan:38:101767.
doi: 10.1016/j.redox.2020.101767. Epub 2020 Oct 23.

The PINK1/PARK2/optineurin pathway of mitophagy is activated for protection in septic acute kidney injury

Affiliations

The PINK1/PARK2/optineurin pathway of mitophagy is activated for protection in septic acute kidney injury

Ying Wang et al. Redox Biol. 2021 Jan.

Abstract

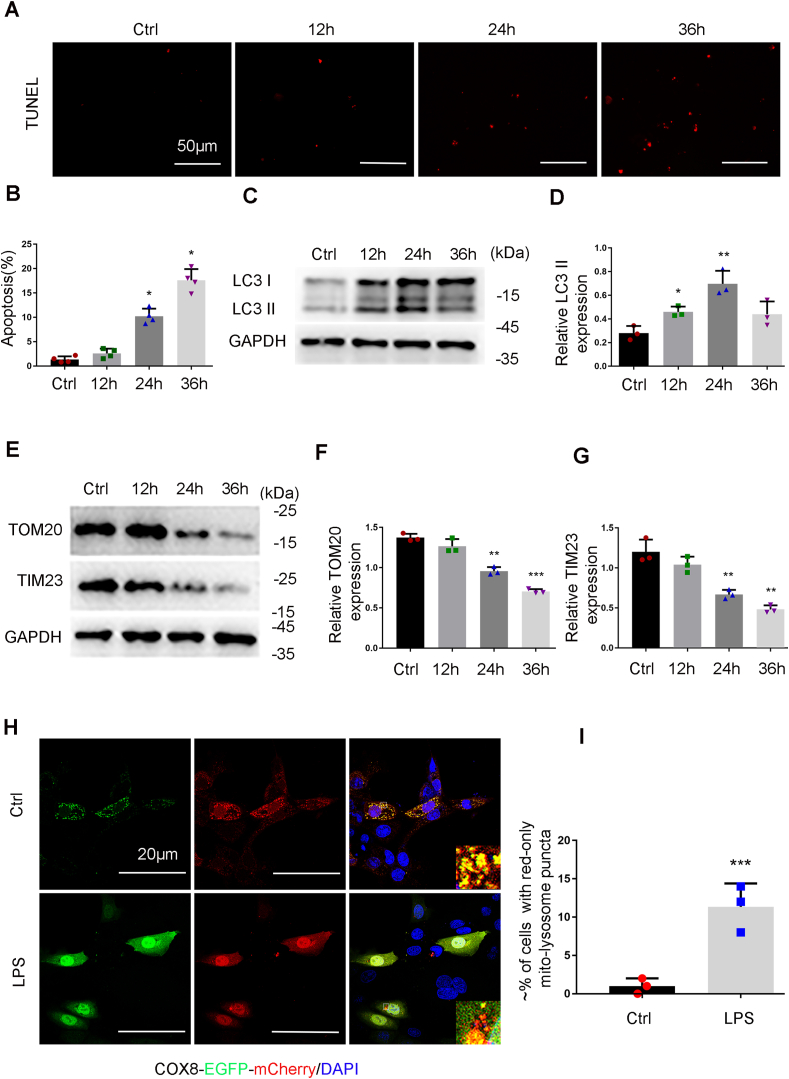
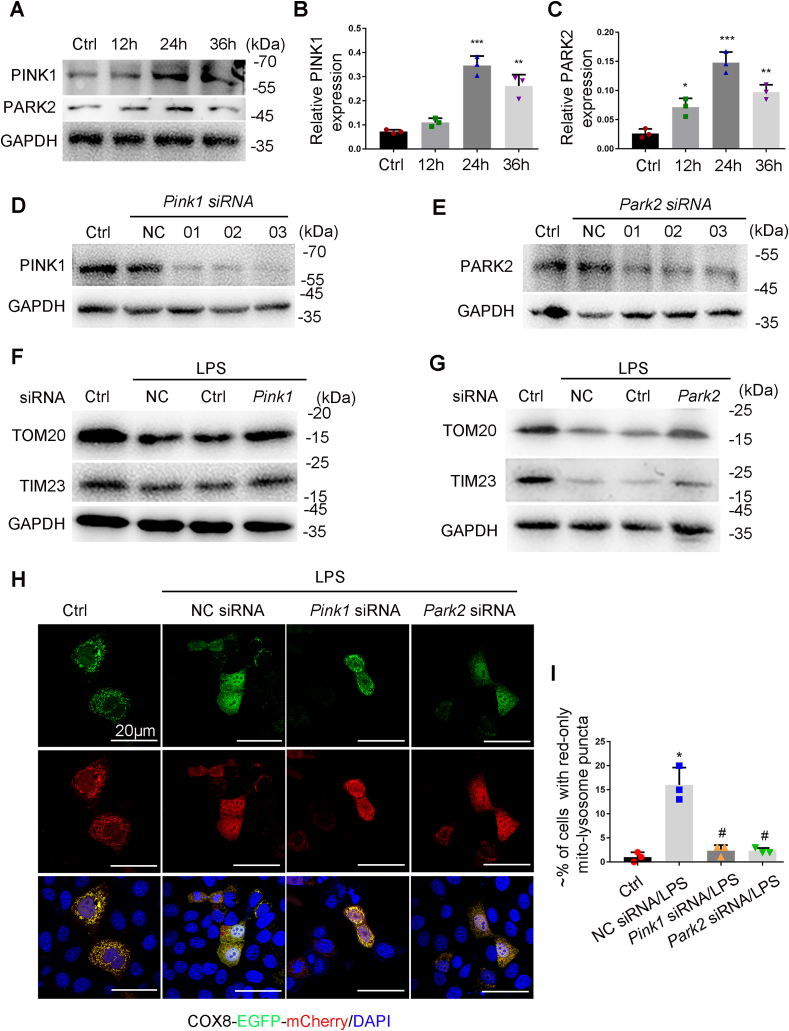
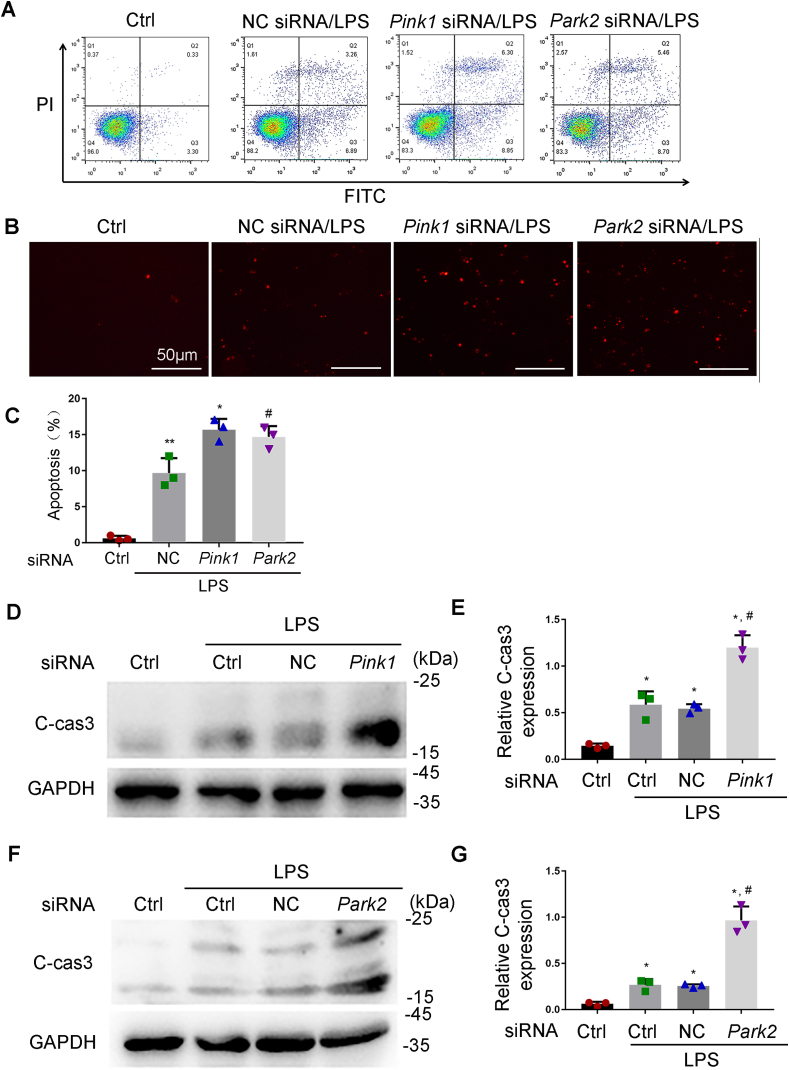
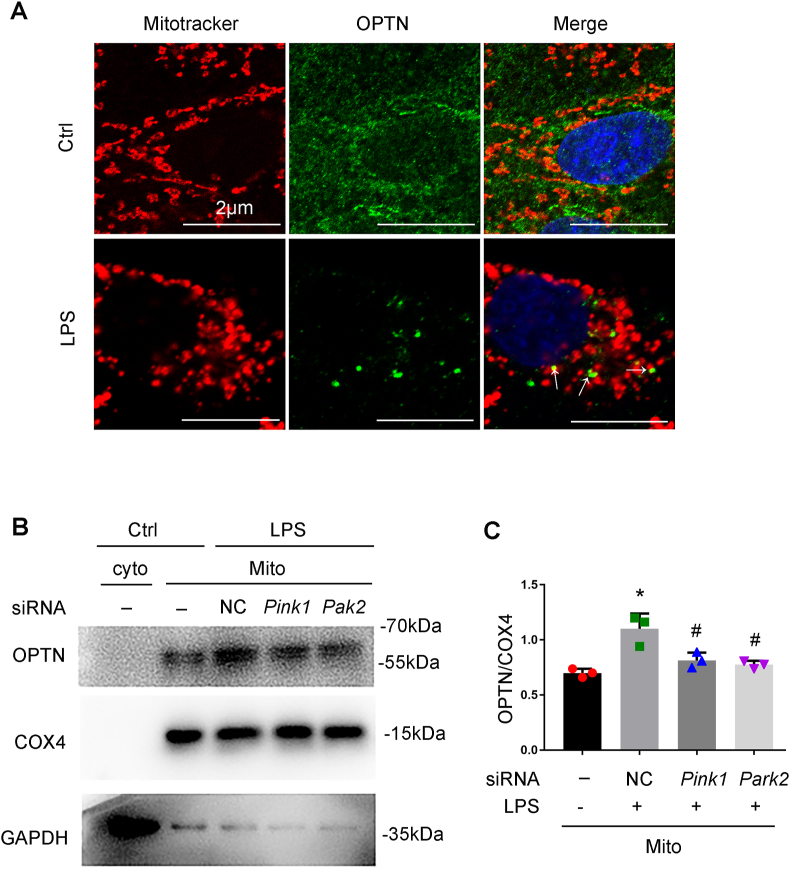
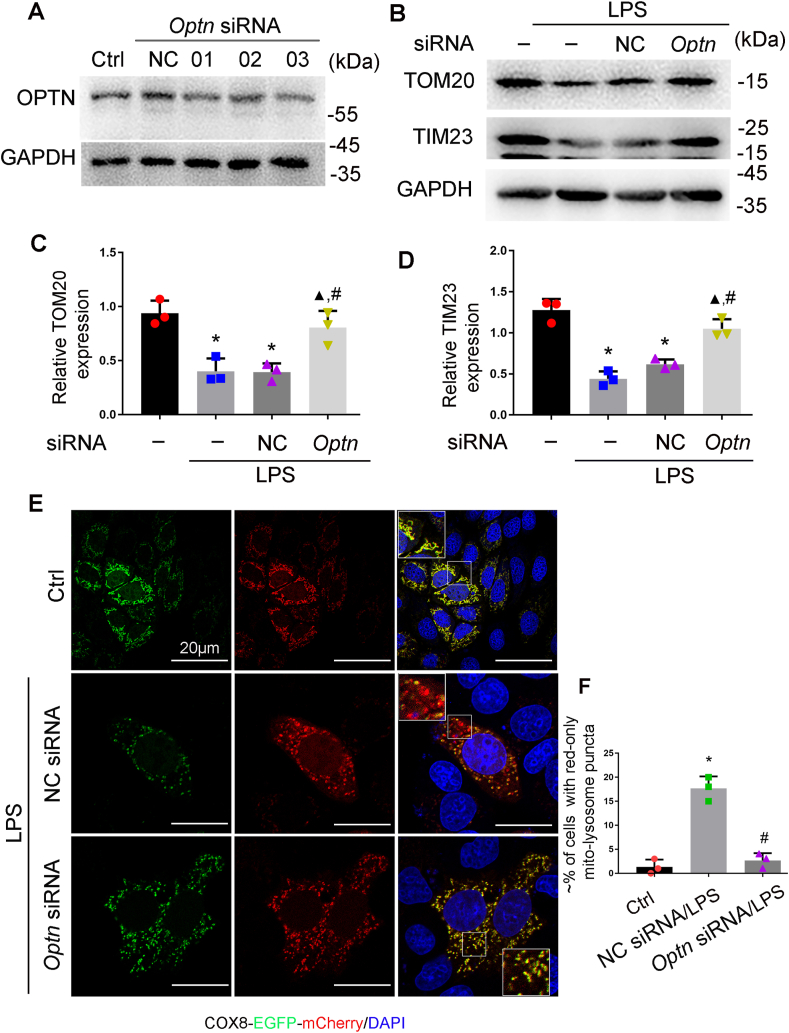
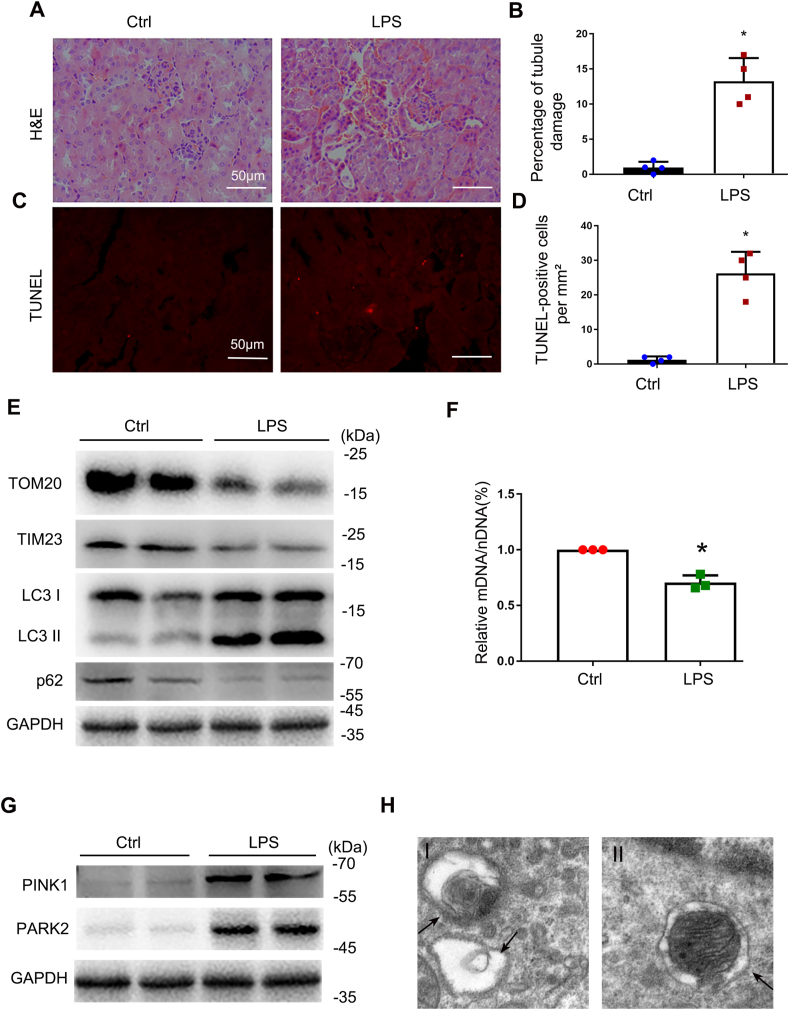
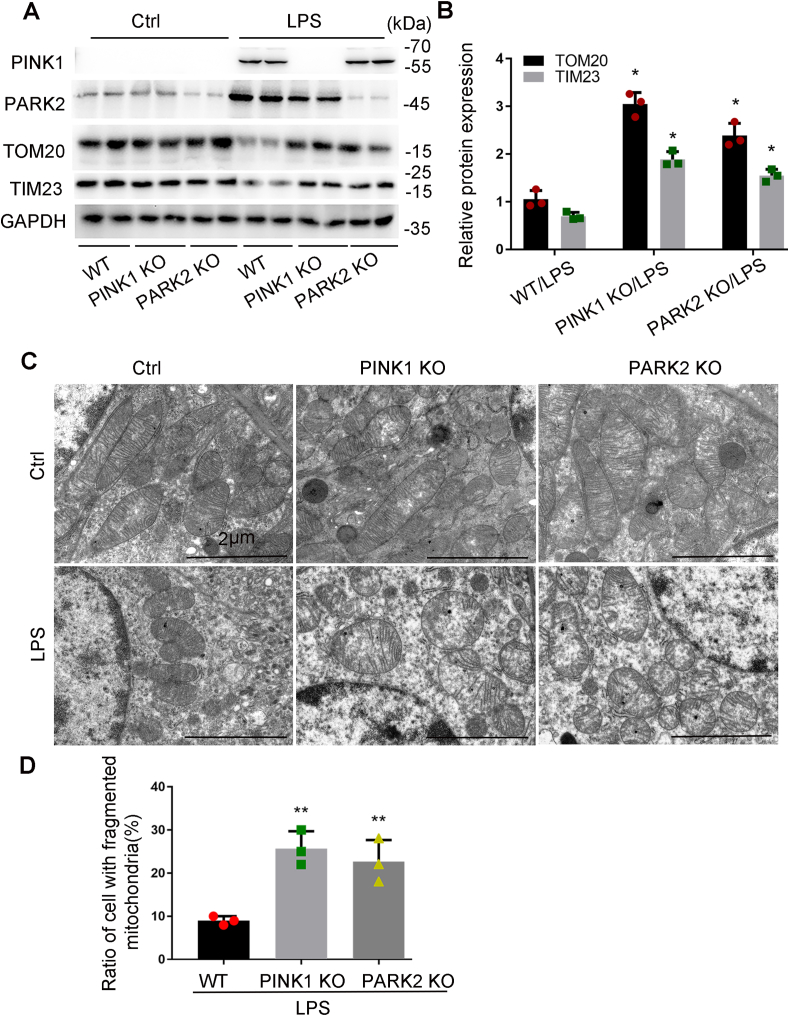
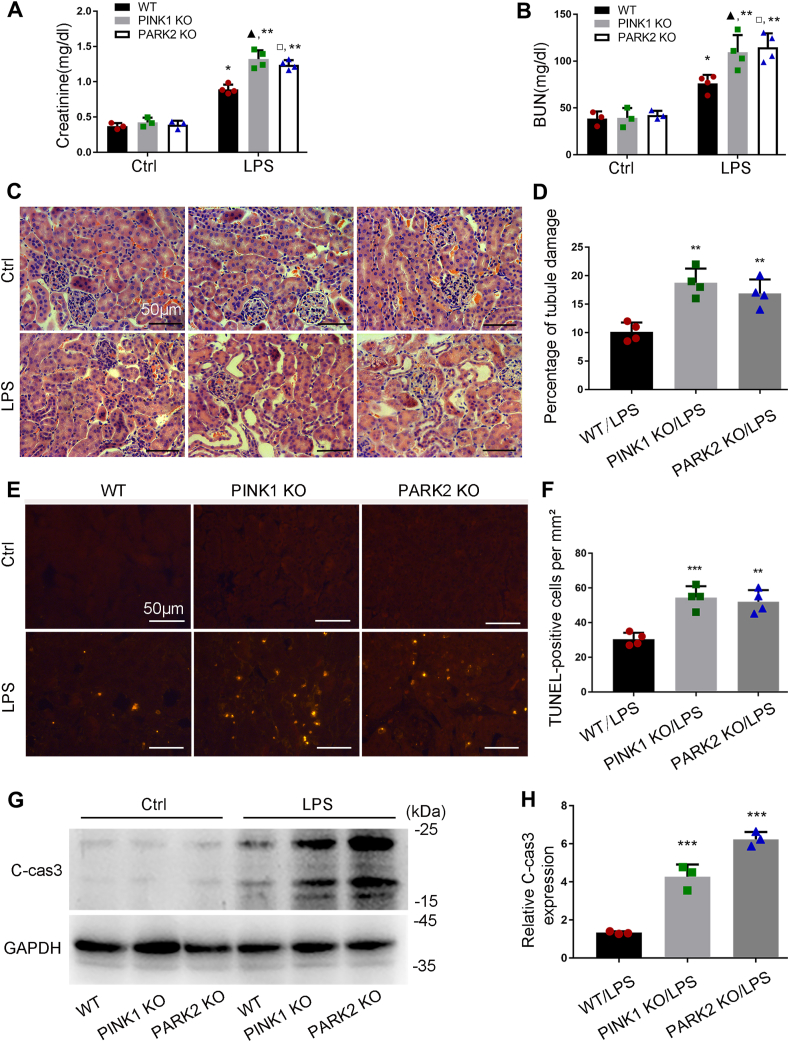
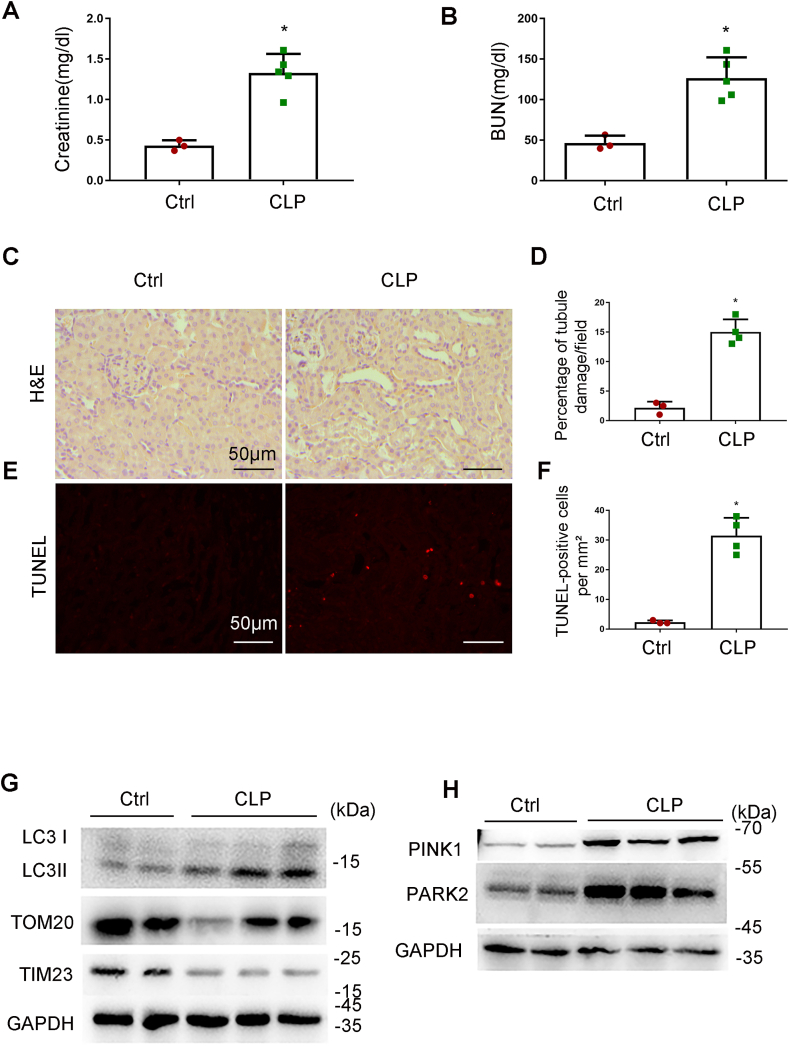
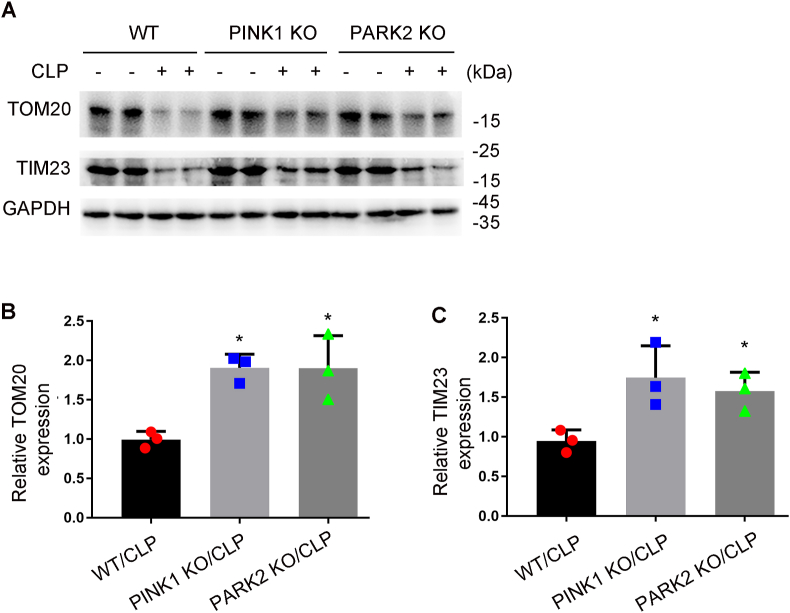
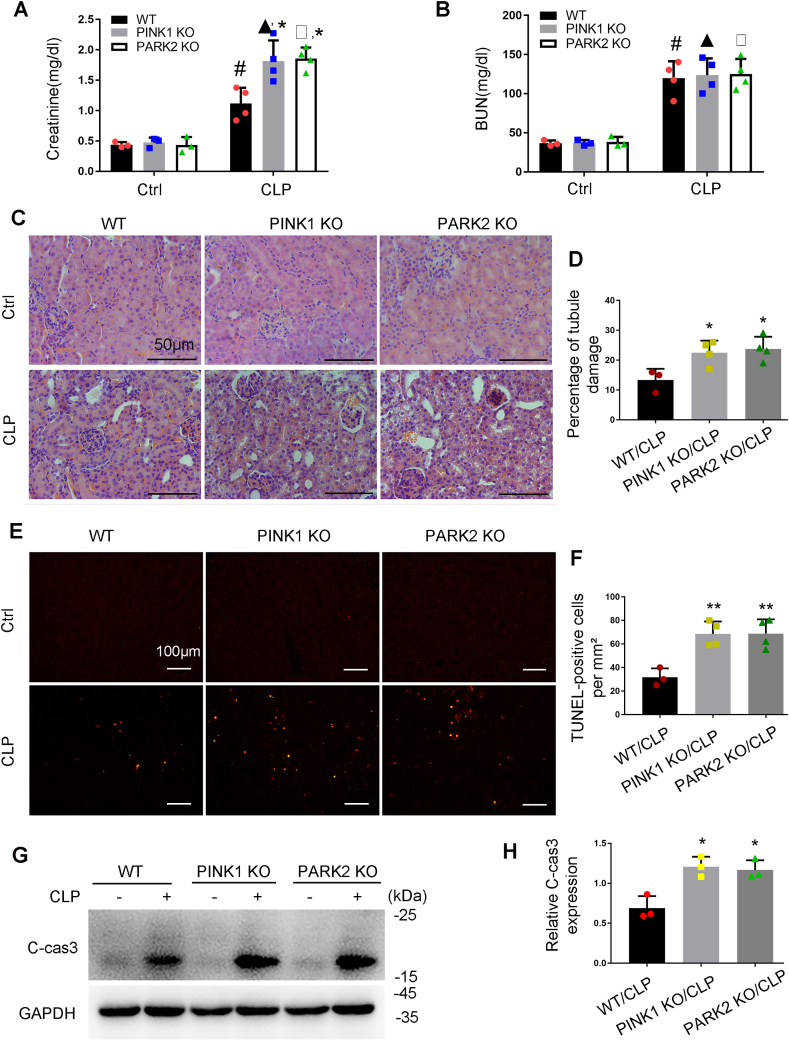
Sepsis is the major cause of acute kidney injury (AKI) associated with high mortality rates. Mitochondrial dysfunction contributes to the pathophysiology of septic AKI. Mitophagy is an important mitochondrial quality control mechanism that selectively eliminates damaged mitochondria, but its role and regulation in septic AKI remain largely unknown. Here, we demonstrate the induction of mitophagy in mouse models of septic AKI induced by lipopolysaccharide (LPS) treatment or by cecal ligation and puncture. Mitophagy was also induced in cultured proximal tubular epithelial cells exposed to LPS. Induction of mitophagy under these experimental setting was suppressed by pink1 or park2 knockout, indicating the role of the PINK1/PARK2 pathway of mitophagy in septic AKI. In addition, sepsis induced more severe kidney injury and cell apoptosis in pink1 or park2 knockout mice than in wild-type mice, suggesting a beneficial role of mitophagy in septic AKI. Furthermore, in cultured renal tubular cells treated with LPS, knockdown of pink1 or park2 inhibited mitochondrial accumulation of the autophagy adaptor optineurin (OPTN) and silencing Optn inhibited LPS-induced mitophagy. Taken together, these findings suggest that the PINK1/PARK2 pathway of mitophagy plays an important role in mitochondrial quality control, tubular cell survival, and renal function in septic AKI.

Keywords: Acute kidney injury; Mitophgay; Optineurin; PARK2; PINK1; Sepsis.


Conflict of interest statement

The authors declare that they have no conflict of interest.

Figures

Fig. 1
Fig. 1
Mitophagy is induced in RPTC cells during LPS treatment. (A-E). RPTC cells were treated with 100 μg/ml LPS for 0 (Ctrl-control) to 36 h. (A) Representative images of TUNEL staining. (B) Apoptosis. The percentage of cells with typical apoptotic morphology was evaluated. (C) Immunoblots of LC3II/I and GAPDH (internal loading control). (D) Densitometry analysis of LC3II. (E) Immunoblots of TIM23 and TOM20. (F, G) Densitometry analysis of TOM20 and TIM23. (H) Mitophagy in RPTC cells transfected with COX8-EGFP-mCherry. After transfection, the cells were subjected to LPS treatment for 24 h. The red puncta in the bottom panel represent mitochondria in lysosomes with acidic pH. (I) Quantification of the cells with red-only puncta. Data in B, F, G and I are expressed as mean ± SD. n = 3. *P < 0.05, **P < 0.01, ***P < 0.001, significantly different from the control group without LPS exposure. (For interpretation of the references to colour in this figure legend, the reader is referred to the Web version of this article.)
Fig. 2
Fig. 2
Knockdown of Pink1 or Park2 suppresses LPS-induced mitophagy in RPTC cells. (A-C) RPTC cells were subjected to 100 μg/ml LPS treatment for indicated time to collect whole cell lysate for immunoblot analysis of PINK1, PARK2, and GAPDH. (A) Representative blots. (B, C) Densitometry analysis of PINK1 and PARK2. (D, E) Silencing of Pink1 or Park2 expression by siRNA in RPTC cells. RPTC cells were transfected with negative control siRNA (NC siRNA), Pink1 siRNA and Park2 siRNA for 48 h to collect whole cell lysate for immunoblot analysis of PINK1, PARK2 and GAPDH. (F, G) Preservation of TOM20 and TIM23 by silencing of Pink1 and Park2 during LPS treatment of RPTC cells. RPTC cells were transfected with Pink1 siRNA and Park2 siRNA alone or NC siRNA. At 48 h after transfection, the cells were subjected to LPS treatment to collect whole cell lysate for immunoblot analysis of TOM2O, TIM23, and GAPDH. (H, I) Inhibition of LPS-induced mitophagosome formation by silencing Pink1 or Park2. RPTC cells were first transfected NC siRNA, Pink1 siRNA and Park2 siRNA, and 24 h later these cells were transfected with COX8-EGFP-mCherry. After 8 h, the cells were subjected to LPS treatment. Finally, the cells were stained with DAPI (blue) and fixed for confocal microscopy. (H) Representative images. (I) Quantification of the cells with red-only puncta. Data in I are expressed as mean ± SD. n = 3. *P < 0.001 vs. the control group, #P < 0.05 vs. NC siRNA-LPS group. (For interpretation of the references to colour in this figure legend, the reader is referred to the Web version of this article.)
Fig. 3
Fig. 3
Knockdown of Pink1 and Park2 aggravates LPS-induced apoptosis in RPTC cells. RPTC cells were transfected with NC siRNA, Pink1 siRNA or Park2 siRNA. At 48 h after transfection, cells were subjected to 24 h of 100 μg/ml LPS treatment. Apoptosis was assessed by flow cytometry following Annexin V-FITC and PI staining, TUNEL assay, and immunoblot analysis of caspase 3 activation. (A) Flow cytometry following Annexin V-FITC and PI staining. (B) Representative images of TUNEL staining. (C) Percentage of Apoptosis. Greater than 200 cells in each group were evaluated to determine the percentage of TUNEL positive cells. (D, F) Whole cell lysate was collected for immunoblot analysis of active/cleaved caspase-3 (C-cas3) and GAPDH. (E, G) Densitometry of active/cleaved caspase-3. Mean ± SD. n = 3. *P < 0.001, **P < 0.01 vs. the control group, #P < 0.01 vs. NC siRNA-LPS group. (For interpretation of the references to colour in this figure legend, the reader is referred to the Web version of this article.)
Fig. 4
Fig. 4
Knockdown of Pink1 or Park2 inhibits OPTN recruitment to mitochondria during LPS treatment. (A) Co-localization of OPTN with mitochondria upon LPS treatment. RPTC cells were subjected to 24 h of 100 μg/ml LPS treatment. Mitochondria in these cells were then labeled with MitoTracker Red FM, while OPTN was stained by immunofluorescence. These cells were examined by confocal microscopy to show the co-localiztion of OPTN (green) and mitochondria (red) in LPS-treated cells (arrows). (B, C) Immunoblot analysis of OPTN accumulation in mitochondria and the effects of Pink1 or Park2 knockdown. RPTC cells transfected with siRNAs for Pink1 or Park2 or negative control siRNA (NC siRNA) were subjected to LPS treatment. These cells were harvested and fractionated to cytosolic (cyto) and mitochondrial (mito) fractions for immunoblot analysis of OPTN, COX4(mitochondrial marker), and GAPDH (cytosolic marker). (B) Representative blots. (C) Densitometry of OPTN. Mean ± SD. n = 3. *P < 0.001 vs. control group. #P < 0.01 vs. siRNA-LPS group. (For interpretation of the references to colour in this figure legend, the reader is referred to the Web version of this article.)
Fig. 5
Fig. 5
OPTN knockdown inhibits mitophagy in LPS-treated RPTC cells. (A) Immunoblot analysis of Optn knockdown by siRNA. RPTC cells were transfected with Optn siRNA or negative control siRNA (NC) for 48 h to collect lysate for immunoblot analysis. (B–D) RPTC cells transfected with Optn siRNA or negative control siRNA (NC) were subjected to LPS treatment. (B) Representative blots of TOM20 and TIM23. (C–D) Densitometry of TOM20 and TIM23. (E–F) RPTC cells were first transfected Optn siRNA or negative control siRNA (NC), and 24 h later these cells were transfected with COX8-EGFP-mCherry. After another 8 h, the cells were subjected to LPS treatment. Finally, the cells were stained with DAPI and fixed for confocal microscopy. (E) Representative images. (F) Quantification of the cells with red-only puncta-mitolysosomes. Mean ± SD. n = 3. *P < 0.001 vs. control group, ▲P < 0.01 VS. LPS group, #P < 0.01 vs. NC siRNA-LPS group. (For interpretation of the references to colour in this figure legend, the reader is referred to the Web version of this article.)
Fig. 6
Fig. 6
Mitophagy is activated in LPS-induced AKI in C57/BL6 mice. C57BL/6 mice (male, 8–10 weeks old) were injected with 10 mg/kg LPS or saline for 24 h. (A) Representative histology of kidney cortex shown by hematoxylin and eosin (H&E) staining. (B) Tubular injury evaluated by counting the renal tubules with signs of injury. (C) Representative images of TUNEL staining of kidney cortex. (D) Quantification of TUNEL positive cells. (E) Immunoblot analysis of TOM20, TIM23, LC3 II/I, p62 and GAPDH (loading control) in kidney tissues. (F) Relative mitochondrial DNA content (mtDNA/nDNA). (G) Immunoblot analysis of PINK1 and PARK2. (H) Representative electron micrographs showing autophagosomes (arrowhead in the left panel) and mitophagosomes (arrowhead in the right panel) in renal proximal tubule cells after LPS treatment. Mean ± SD. n ≥ 3. *P < 0.001 and #P < 0.01 vs. the control group. (For interpretation of the references to colour in this figure legend, the reader is referred to the Web version of this article.)
Fig. 7
Fig. 7
Pink1 or Park2 deficiency inhibits mitophagy and aggravates LPS-induced mitochondrial injury in mice. Pink1 KO, park2 KO, and WT mice were injected with 10 mg/kg LPS or saline. (A) Kidney cortex tissues were collected from pink1-or park2- KO mice and WT littermates for immunoblot analysis of PINK1, PARK2 TOM20, TIM23, and GAPDH. (B) Densitometry of TOM20 and TIM23 signals. (C–D) Renal cortex was fixed and processed for transmission electron microscopy. (C) Representative electron micrographs. (D) Quantification of mitochondrial fragmentation. The length of mitochondria was evaluated in each tubular cell to calculate the percentage of cells in which mitochondrial length >2 μm was less than 1%. A total of 30 cells in control and 30 cells in LPS-treated kidneys from three animals in each condition were assessed. Mean ± SD. n = 3. *P < 0.01 and #P < 0.05 vs. WT-LPS group. (For interpretation of the references to colour in this figure legend, the reader is referred to the Web version of this article.)
Fig. 8
Fig. 8
Pink1 or Park2 deficiency increases kidney damage and tubular apoptosis during LPS treatment in mice.Pink1 KO, park2 KO, and WT mice were injected with 10 mg/kg LPS or saline. (A–B) Blood samples were harvested for measurement of serum creatinine (A) and BUN (B) to indicate renal function decline. (C) Representative images of HE staining. (D) Quantification of tubular damage by counting the renal tubules with signs of injury. (E) Representative images of TUNEL staining. (F) Quantification of TUNEL-positive cells in renal tissues. (G) Representative immunoblots of cleaved/active caspase-3 (C-CAS3) in kidney tissues. (H) Densitometry of C-CAS3 signals. Mean ± SD. n ≥ 3. #P < 0.001 vs. WT-Ctrl group, ▲P < 0.001 vs. PINK1 KO-Ctrl group, □P < 0.001 vs. PARK2 KO-Ctrl group, ***P < 0.001 and **P < 0.01 vs. WT-LPS group. (For interpretation of the references to colour in this figure legend, the reader is referred to the Web version of this article.)
Fig. 9
Fig. 9
Mitophagy is induced in CLP-induced AKI in mice. C57BL/6 mice (male, 8–10 weeks old) were subjected to CLP or sham-surgery for analysis 24 h later. Blood samples were collected for measurements of serum creatinine (A) and BUN (B). (C) Representative images of HE staining. (D) Percentage of damaged tubules. (E) Representative images of TUNEL staining, (F) Quantification of TUNEL positive cells. (G) Immunoblot analysis of TOM20, TIM23 and LC3 II/I. (H) Immunoblot analysis of PINK1 and PARK2. Mean ± SD. n ≥ 4. *P < 0.001 vs. the control group. (For interpretation of the references to colour in this figure legend, the reader is referred to the Web version of this article.)
Fig. 10
Fig. 10
CLP-induced mitophagy is inhibited in Pink1-or Park2-KO mice Pink1 KO, park2 KO, and WT mice were subjected to CLP or sham-surgery for analysis 24 h later. Kidney tissues were collected for immunoblot analysis of TOM20 and TIM23. (A) Representative blots. (B–C) Densitometry analysis. Mean ± SD. n = 3. *P < 0.01 vs. WT-LPS group. (For interpretation of the references to colour in this figure legend, the reader is referred to the Web version of this article.)
Fig. 11
Fig. 11
Pink1 or Park2 deficiency worsens CLP-induced AKI in mice. Pink1 KO, park2 KO, and WT mice were subjected to CLP or sham-surgery for analysis 24 h later. Blood samples were harvested for measurements of serum creatinine (A) and BUN (B). (C) Representative images of HE staining. (D) Percentage of damaged tubules. (E) Representative images of TUNEL staining. (F) Quantification of TUNEL-positive cells. (G) Representative immunoblots of cleaved/active caspase-3 (C-CAS3). (H) Densitometry of cleaved/active caspase-3. Mean ± SD. n ≥ 3. #P < 0.001 vs. WT-Ctrl group, ▲P < 0.001 vs. Pink1 KO-Ctrl group, □P < 0.001 vs. Park2 KO-Ctrl group, *P < 0.01 vs. WT-LPS group. (For interpretation of the references to colour in this figure legend, the reader is referred to the Web version of this article.)

References

    1. Guo C., Dong G., Liang X., Dong Z. Epigenetic regulation in AKI and kidney repair: mechanisms and therapeutic implications. Nat. Rev. Nephrol. 2019;15(4):220–239. - PMC - PubMed
    1. He L., Wei Q., Liu J., Yi M., Liu Y., Liu H., Sun L., Peng Y., Liu F., Venkatachalam M.A. AKI on CKD: heightened injury, suppressed repair, and the underlying mechanisms. Kidney Int. 2017;92(5):1071–1083. - PMC - PubMed
    1. Bucaloiu I.D., Kirchner H.L., Norfolk E.R., Hartle J.E., 2nd, Perkins R.M. Increased risk of death and de novo chronic kidney disease following reversible acute kidney injury. Kidney Int. 2012;81(5):477–485. - PubMed
    1. Venkatachalam M.A., Weinberg J.M., Kriz W., Bidani A.K. Failed tubule recovery, AKI-CKD transition, and kidney disease progression. J. Am. Soc. Nephrol. 2015;26(8):1765–1776. - PMC - PubMed
    1. Mei S., Livingston M., Hao J., Li L., Mei C., Dong Z. Autophagy is activated to protect against endotoxic acute kidney injury. Sci. Rep. 2016;6:22171. - PMC - PubMed

Publication types

LinkOut - more resources