Review
. 2020 Oct 29;7(4):47.
doi: 10.3390/jcdd7040047.

Assessing Myocardial Architecture: The Challenges and Controversies

Affiliations
Review

Assessing Myocardial Architecture: The Challenges and Controversies

Peter Agger et al. J Cardiovasc Dev Dis. .

Abstract

In recent decades, investigators have strived to describe and quantify the orientation of the cardiac myocytes in an attempt to classify their arrangement in healthy and diseased hearts. There are, however, striking differences between the investigations from both a technical and methodological standpoint, thus limiting their comparability and impeding the drawing of appropriate physiological conclusions from the structural assessments. This review aims to elucidate these differences, and to propose guidance to establish methodological consensus in the field. The review outlines the theory behind myocyte orientation analysis, and importantly has identified pronounced differences in the definitions of otherwise widely accepted concepts of myocytic orientation. Based on the findings, recommendations are made for the future design of studies in the field of myocardial morphology. It is emphasised that projection of myocyte orientations, before quantification of their angulation, introduces considerable bias, and that angles should be assessed relative to the epicardial curvature. The transmural orientation of the cardiomyocytes should also not be neglected, as it is an important determinant of cardiac function. Finally, there is considerable disagreement in the literature as to how the orientation of myocardial aggregates should be assessed, but to do so in a mathematically meaningful way, the normal vector of the aggregate plane should be utilised.

Keywords: diffusion tensor imaging; heart; methodology; micro computed tomography; myocardial aggregation; myocyte orientation; review.


Conflict of interest statement

The authors have no conflict of interest.

Figures

Figure 1
Figure 1
The shape of the diffusion tensor in different tissue environments. (A) Showing that all eigenvectors have equal magnitude in non-fibrous tissue resulting in a spherical shaped diffusion tensor. (B) Showing how, in fibrous tissue, the diffusion tensor takes on an ellipsoid shape when the magnitude of the primary eigenvector (e1) increases relative to the secondary eigenvector (e2) and tertiary eigenvector (e3). (C) In ordered tissue, the diffusion tensor can take on a flattened ellipsoid shape whereby the secondary eigenvector (e2) has a larger magnitude than the tertiary eigenvector (e3).
Figure 2
Figure 2
Establishment of the reference planes. (A) Illustrates the global geometric coordinate system defining the position of the left ventricle. It is defined by the orthonormal basis [eax,eR1,eR2] where eax is the left ventricular long axis and eR1 and eR2 being orthogonal radial vectors, which are not used in the determination of myocyte orientations. (B) Subsequently, the local wall coordinate system is defined based on the orthonormal basis [er,ec,el], where er is the local radial vector, i.e., the normal of the epicardial tangential plane A, el is the local longitudinal vector, i.e., the normal of the local horizontal plane, and lastly ec is the local circumferential vector. (C) Finally, the diffusion tensor is defined by a sub-local coordinate system based on the orthonormal bases [e1,e2,e3], which are the three eigenvectors. Modified from [25].
Figure 3
Figure 3
Epicardial wall normalisation. Schematic illustration of the influence of epicardial curvature on the quantification of myocyte orientation. The figure shows how myocyte orientation can be assessed either relative of the left ventricular long axis (A) or the epicardial tangential plane (B). Owing to the rounded shape of the ventricular cavities, the myocardial contractile forces work perpendicular to the epicardial surface. Therefore, to measure myocyte orientation accurately throughout the entire myocardium, we should quantify relative to the epicardial curvature (B). If we assess myocytes orientation relative to the left ventricular long axis (A), we do not compensate for the epicardial curvature, thus myocyte orientation will not correlate with wall deformation.
Figure 4
Figure 4
Reference planes and angle definitions. (A) showing a schematic of the left ventricle with the local orthogonal reference planes aligned with the epicardium. Plane A is parallel to the epicardial tangential plane, while the orthogonal plane B is parallel to the left ventricular long axis. Consequently, plane C is orthogonal to both planes A and B and is often referred to as the local “horizontal” plane. (B) Outlines our recommended angle definitions. The helical angle α is the angle between the primary eigenvector (black line) and plane C. The intrusion angle β is the angle between the primary eigenvector and plane A. Lastly, the aggregate angle is measured using the aggregate plane normal (N) assessed against the epicardial tangential plane A. The unit of aggregated cardiomyocytes is depicted as the yellow box, which is a schematic oversimplification.
Figure 5
Figure 5
Commonly used angles in analysis of myocardial architecture. This figure illustrates the most commonly used definitions of helical and ‘transmural’ angulations with projection (A,C) and without projection (B,D). In this schematic illustration, the principal orientation of the cardiomyocytes, that is the primary eigenvector (arrow in all images), is depicted within a block of myocardium with the epicardium facing out of the page. (A) The projected helical angle is defined as the angle between the local horizontal plane and the projection of the primary eigenvector onto the epicardial tangential plane. (B) The helical angle is the angle between the primary eigenvector and the local horizontal plane. (C) The transverse angle is defined as the angle between the epicardial tangential plane and the projection of the primary eigenvector onto the local horizontal plane. (D) The intrusion angle is defined as the angle between the primary eigenvector and the epicardial tangential plane.
Figure 6
Figure 6
Micro-computed tomography of the myocardium. Contrast enhanced micro-computed tomography images of a sample preparation taken from the posterior-basal region of a rabbit left ventricle showcasing the aggregations of cardiomyocytes. Panel (A) shows the sample in short axis view, panel (B) shows the corresponding four-chamber view. Scale bars represent 500 µm. The isotropic spatial resolution is approximately 4 µm.
Figure 7
Figure 7
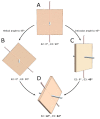
Differences in the quantification of myocardial aggregate orientation. In the literature, myocardial aggregate orientation is assessed using either the eigenvector situated within the aggregate plane, in diffusion tensor imaging referred to as the secondary eigenvector (E2) i.e., the pink shaded rod, or it is assessed using the aggregate plane normal, in diffusion tensor imaging referred to as the tertiary eigenvector (E3) i.e., the light blue shaded rod. This schematic shows a myocardial aggregate (beige box) made up of cardiomyocyte chains (depicted as lines running across the box). In panel (A) the aggregate is orientated parallel to the myocardial surface, with the helical and intrusion angle at 0 degrees. When adopting the most widely used E2-angle definition [36] this configuration results in an E2 angle of 0 degrees, conversely when using the E3-angle definition [25] the E3 angle is 90 degrees. Assigning a helical angle of 45 degrees to the cardiomyocyte chains, as shown in panel (B), changes neither the E2 nor the E3 angle. However, when we assign an intrusion angle to the myocyte chains, as shown in panel (C), the aggregate now angles towards the endocardium as is the case during myocardial thickening. This crucial reorientation is detected by the E3 angle, which changes to 45 degrees, the change is not detected by the E2 angle, which remains 0 degrees. If we assign both a 45 degree helical and a 45 degree intrusion angle to the cardiomyocyte chains, as shown in panel (D), despite this marked reorientation the E2 angle increases by only 12 degrees whereas the associated E3 angle is 52 degrees. This figure illustrates why the E3 angle more accurately measures aggregate transmurality and reorientation during wall thickening, and emphasises why the two cannot be readily compared.
Figure 8
Figure 8
Projection artefact. The leaning tower of Pisa taken as an everyday example of projection artefact. The tower leans in a southward direction. Thus, when viewed from the north, the tower appears to be standing straight (A). When viewed from the east, however, the tower is obviously leaning (B). The straight appearance of the tower in panel A is an artefact brought upon by the projection of the tower into the camera lens. It would be inappropriate to use two-dimensional photography in an attempt to quantify the inclination of the tower. All projected angles in the setting of myocardial morphology are subject to projection artefact. ©2018 Google, Data SIO, NOAA, U.S. Navy, NGA, GEBCO, Landsat/Copernicus.

Similar articles

Cited by

References

    1. Ingels N.B., Jr. Myocardial fiber architecture and left ventricular function. Technol. Health Care. 1997;5:45–52. doi: 10.3233/THC-1997-51-205. - DOI - PubMed
    1. Lunkenheimer P.P., Niederer P., Stephenson R.S., Redmann K., Batista R.V., Smerup M., Anderson R.H. What is the clinical significance of ventricular mural antagonism? Eur. J. Cardio Thorac. Surg. 2017;53:714–723. doi: 10.1093/ejcts/ezx382. - DOI - PubMed
    1. Lunkenheimer P.P., Redmann K., Florek J., Fassnacht U., Cryer C.W., Wubbeling F., Niederer P., Anderson R.H. The forces generated within the musculature of the left ventricular wall. Heart. 2004;90:200–207. doi: 10.1136/hrt.2003.011650. - DOI - PMC - PubMed
    1. Omann C., Agger P., Bøgh N., Laustsen C., Ringgaard S., Stephenson R.S., Anderson R.H., Hjortdal V., Smerup M. Resolving the natural myocardial remodelling brought upon by cardiac contraction; a porcine ex-vivo cardiovascular magnetic resonance study of the left and right ventricle. J. Cardiovasc. Magn. Reson. 2019;21:1–19. doi: 10.1186/s12968-019-0547-2. - DOI - PMC - PubMed
    1. Spotnitz H.M. Macro design, structure, and mechanics of the left ventricle. J. Thorac. Cardiovasc. Surg. 2000;119:1053–1077. doi: 10.1016/S0022-5223(00)70106-1. - DOI - PubMed

LinkOut - more resources