. 2020 Oct 29;12(11):3178.
doi: 10.3390/cancers12113178.

RAD51-Mediated DNA Homologous Recombination Is Independent of PTEN Mutational Status

Affiliations

RAD51-Mediated DNA Homologous Recombination Is Independent of PTEN Mutational Status

Asha Sinha et al. Cancers (Basel). .

Abstract

PTEN mutation occurs in a variety of aggressive cancers and is associated with poor patient outcomes. Recent studies have linked mutational loss of PTEN to reduced RAD51 expression and function, a key factor involved in the homologous recombination (HR) pathway. However, these studies remain controversial, as they fail to establish a definitive causal link to RAD51 expression that is PTEN-dependent, while other studies have not been able to recapitulate the relationship between the PTEN expression and the RAD51/HR function. Resolution of this apparent conundrum is essential due to the clinically-significant implication that PTEN-deficient tumors may be sensitive to poly (ADP-ribose) polymerase (PARP) inhibitors (PARPi) commonly used in the clinical management of BRCA-mutated and other HR-deficient (HRD) tumors.

Methods: Primary Pten-deficient (and corresponding wild-type) mouse embryonic fibroblasts (MEFs) and astrocytes and PTEN-null human tumor cell lines and primary cells were assessed for RAD51 expression (via the Western blot analysis) and DNA damage repair analyses (via alkali comet and γH2AX foci assays). RAD51 foci analysis was used to measure HR-dependent DNA repair. Xrcc2-deficient MEFs served as an HR-deficient control, while the stable knockdown of RAD51 (shRAD51) served to control for the relative RAD51/HR-mediated repair and the phospho-53BP1 foci analysis served to confirm and measure non-homologous end joining (NHEJ) activity in PTEN-deficient and shRAD51-expressing (HRD) lines. Cell proliferation studies were used to measure any potential added sensitivity of PTEN-null cells to the clinically-relevant PARPi, olaparib. RAD51 levels and DNA damage response signaling were assessed in PTEN-mutant brain tumor initiating cells (BTICs) derived from primary and recurrent glioblastoma multiforme (GBM) patients, while expression of RAD51 and its paralogs were examined as a function of the PTEN status in the RNA expression datasets isolated from primary GBM tumor specimens and BTICs.

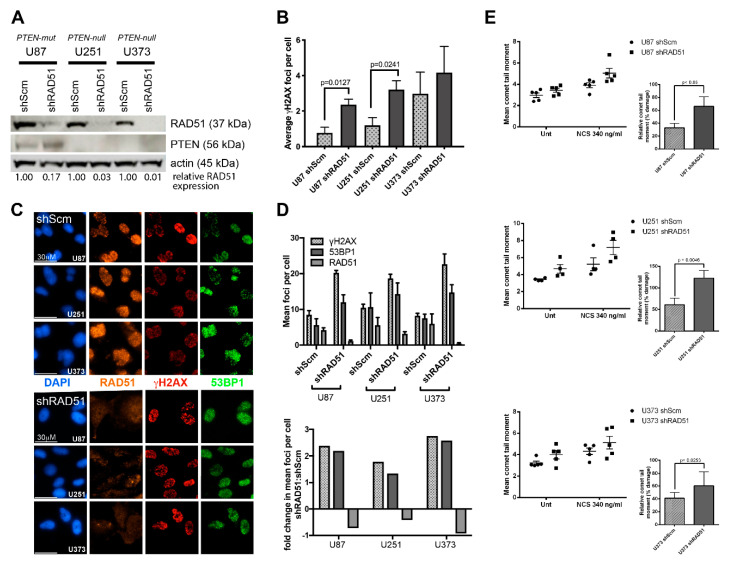
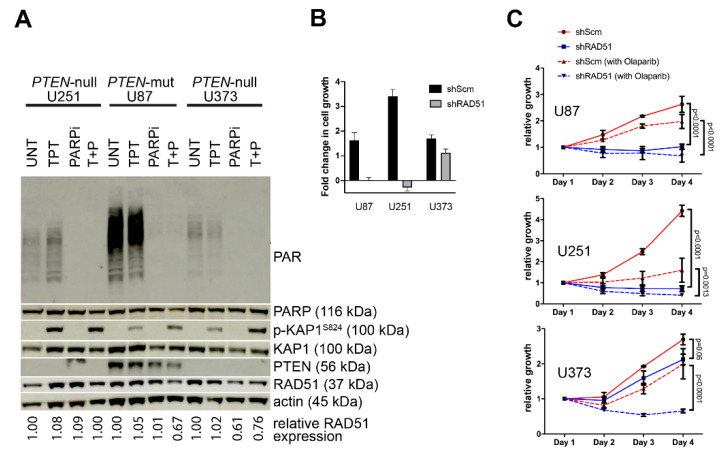
Results: Pten knockout primary murine cells display unaltered RAD51 expression, endogenous and DNA strand break-induced RAD51 foci and robust DNA repair activity. Defective HR was only observed in the cells lacking Xrcc2. Likewise, human glioblastoma multiforme (GBM) cell lines with known PTEN deficiency (U87, PTEN-mutated; U251 and U373, PTEN-null) show apparent expression of RAD51 and display efficient DNA repair activity. Only GBM cells stably expressing shRNAs against RAD51 (shRAD51) display dysfunctional DNA repair activity and reduced proliferative capacity, which is exacerbated by PARPi treatment. Furthermore, GBM patient-derived BTICs displayed robust RAD51 expression and intact DNA damage response signaling in spite of PTEN-inactivating mutations. RNA expression analysis of primary GBM tissue specimens and BTICs demonstrate stable levels of RAD51 and its paralogs (RAD51B, RAD51C, RAD51D, XRCC2, XRCC3, and DMC1), regardless of the PTEN mutational status.

Conclusions: Our findings demonstrate definitively that PTEN loss does not alter the RAD51 expression, its paralogs, or the HR activity. Furthermore, deficiency in PTEN alone is not sufficient to impart enhanced sensitivity to PARPi associated with HRD. This study is the first to unequivocally demonstrate that PTEN deficiency is not linked to the RAD51 expression or the HR activity amongst primary neural and non-neural Pten-null cells, PTEN-deficient tumor cell lines, and primary PTEN-mutant GBM patient-derived tissue specimens and BTICs.

Keywords: DNA damage; HRD; PARP inhibitor; PTEN; RAD51; RAD51 foci; RNA expression; alkaline comet assay; base excision repair; brain tumor initiating cells; combination therapy; glioblastoma multiforme; homologous recombination; olaparib; synthetic lethality; γH2AX foci.


Conflict of interest statement

The authors declare no conflict of interest.

Figures

Figure 1
Figure 1
Establishing Pten-deficient primary mouse cells for Rad51 protein analysis. (A) Schematic of a protocol to isolate and establish primary murine Pten-null (and controls) cortical astrocytes (P2 newborns) and MEFs (E13.5). Following culture establishment, primary cells were transduced with MSCV-creGFP retroviral particles and quantified for GFP positivity. Following expansion of Cre+/GFP+ cells, genomic analysis confirmed Cre recombination followed by immunofluorescence analysis, using phalloidin for MEFs or an anti-glial fibrillary acidic protein (GFAP) antibody for astrocytes to confirm cell type purity, respectively. Only cultures with >90% GFAP/phalloidin positivity were used for prospective biochemical/cellular analyses. (B) Western analysis of primary murine Pten-null (and controls) astrocytes and MEFs. Protein extracts were prepared using Cre-modified primary cell cultures and underwent Western analysis to confirm the Pten expression status and corresponding RAD51 levels. Consistent with genomic analyses, cultures derived from Pten heterozygotes (Pten+/−) displayed reduced Pten protein expression compared to the wild type (Pten+/−), while those from the Pten knockout (Pten−/−) did not display Pten protein expression. RAD51 protein levels remain unchanged regardless of the Pten expression status. Anti-Scythe ab was used as a protein loading control [43].
Figure 2
Figure 2
DNA damage analysis of Pten-deficient primary murine mouse embryonic fibroblasts (MEFs) and astrocytes. (A) Representative images from the alkaline comet analysis of primary Pten+/+, Pten−/−, p53−/− and Xrcc2−/−; p53−/− MEFs following 20 Gy irradiation (R0) and 60 min post-irradiation recovery (R60). Although comet tail lengths appear equivalent in all genetic cell subtypes following radiation, no residual tails remain in Pten+/+, Pten−/− and p53−/− MEFs 60 min following radiation, while Xrcc2-/-; p53-/- MEFs show a residual tail. (B) Bar graphs represent mean comet tail moments plus the standard error of means (s.e.m.) derived from the alkaline comet analysis on primary MEFs and astrocytes. Experiments were repeated in triplicate (n = 3), where a minimum of 100 cells were measured per line/treatment in each experiment; N ≥ 300 total independent comet tail moments were measured per line/treatment. Wild-type and Pten−/− MEFs and astrocytes show equivalent repair activity following irradiation. Similar to the wild-type and Pten−/− cells, p53-/- cells show no apparent DNA repair defect, while Xrcc2−/−, p53−/− cells display delayed HR-dependent repair following DNA strand break damage [44]. (C) Representative fluorescent γH2AX and RAD51 foci micrographs derived from primary Pten+/+, Pten−/− and Xrcc2−/−; p53−/− MEFs and astrocytes following irradiation and 24 h post-irradiation recovery. In untreated Pten+/+ and Pten−/− cells, both γH2AX and RAD51 foci numbers are minimal, while the γH2AX foci are apparent in Xrcc2−/−, p53−/− cells. Following irradiation, Pten+/+ and Pten−/− cells develop γH2AX and RAD51 foci, while Xrcc2−/−, p53−/− cells only develop γH2AX foci. RAD51 foci fail to form in Xrcc2−/−, p53−/− cells regardless of treatment despite expression of the RAD51 protein consistent with HR deficiency. Following 24 h of post-irradiation recovery, γH2AX and RAD51 foci are absent in Pten+/+ and Pten−/− cells, indicating repair of the radiation-induced damage, while pervasive γH2AX foci remain in Xrcc2−/−, p53−/− cells indicating unrepaired DNA strand break damage. (D) Bar graphs represent mean γH2AX and RAD51 foci per cell (foci/cell) quantification data of primary MEFs and astrocytes following 5 Gy radiation and recovery 24 h post-radiation. Experiments were repeated in triplicate (n = 3), where a minimum of 30 cells were measured per treatment; total N ≥ 90 independent cells measured per line/treatment. Error bars represent the standard error of means (s.e.m.).
Figure 3
Figure 3
DNA repair analysis of PTEN-deficient glioblastoma multiforme (GBM) cell lines. (A) Western analysis of PTEN-deficient GBM cell lines stably expressing shRAD51 or shSCM (control). RAD51 knockdown in shRAD51-expressing GBM lines achieved ≥ 83% reduction in the RAD51 protein relative to shSCM-expressing GBM counterparts (83% in U87MG; 97% in U251MG; and 99% in U373MG). Immunostaining with anti-PTEN antibody confirms the reduced expression of mutant PTEN in U87 and loss of PTEN in U251 and U373. (B) Untreated shRAD51-GBM cells develop higher basal γH2AX foci (DNA damage) in comparison to the untreated shSCM-GBM counterparts. (C) Representative immunofluorescent micrographs and bar graphs quantifying γH2AX, RAD51, and 53BP1 (phospho-53BP1S1778) foci among shSCM- and shRAD51-GBM cells following neocarzinostatin (NSC)-induced DNA double-strand breaks. Cellular treatment with NSC (140 ng/mL) induces γH2AX and 53BP1 foci in both shSCM- and shRAD51-GBM cells with only shSCM-GBM cells showing concomitant RAD51 foci, while shRAD51-GBM cells fail to display RAD51 nuclear foci or signal. Scale bar represents 30 μm. (D) Bar graphs quantify the mean number of DNA double strand break (DSB)-dependent foci in all shSCM- and shRAD51-GBM cells following 140 ng/mL NSC treatment. Only shSCM-GBM cells show formation of RAD51 foci, while shRAD51-GBM cells do not. However, shRAD51-GBM cells display approx. 1.5–2.5× more 53BP1 foci compared to shSCM-GBM cells. Statistical analysis was performed using the unpaired Student’s t-test (U87 and U251, n = 4; U373, n = 3). (E) The effect of RAD51 depletion in glioblastoma tumor cell lines shown by the alkaline comet assay. Cells were exposed to NCS (340 ng/mL) for 1 h and the extent of NCS-induced DNA damage was quantified using the alkaline comet assay. (Top graphs) Mean comet tail moment values of glioblastoma cells following NCS treatment and (Bottom graphs) DNA damage percentage relative to the untreated control. Increased DNA damage was observed in RAD51-knockdown cells in comparison to the SCM control as a result of the defective HR that is expected only in RAD51-deficient cells. A slight increase in DNA damage was also observed in all untreated RAD51-deficient GBM cells in comparison to the SCM counterpart. Statistical analysis was performed using the unpaired Student’s t-test (U87, U373, n = 5, N ≥ 1500; U251, n = 4, N ≥ 1200).
Figure 4
Figure 4
Cell proliferation analysis in PTEN-deficient GBM cell lines following treatment with PARP inhibitor (PARPi) olaparib. (A) GBM cells underwent treatment with olaparib (5 μM pre-treatment for 30 min followed by 1 h at 37 °C) and/or topotecan (5 μM for 1 h at 37 °C). Western analysis of the topotecan-treated cells displayed the DNA damage-induced ATM-dependent KAP-1 phosphorylation (Figure S2) and enhanced PARylation, while the olaparib treatment alone failed to induce KAP-1 and suppressed the basal PARylation and dual treatment results in KAP-1 phosphorylation in the absence of PARylation. (B) Cells that undergo shRAD51-mediated knockdown of RAD51 display significant reduction in cellular growth. (C) While olaparib treatment (1 μM) of shSCM-GBM control lines moderately impacts the GBM cell growth (compare the red solid line to the hashed line), olaparib treatment of shRAD51-GBM lines shows cell loss (compare the blue solid line to the hashed line). The statistical analysis was performed using the 2-way ANOVA using the Tukey’s post hoc test with no correction.
Figure 5
Figure 5
Expression analysis of RAD51 and its paralogs in PTEN-mutated/deficient GBM. (A) Expression analysis of RAD51 and its paralogs stratified by the PTEN status from The Cancer Genome Atlas (TCGA) dataset. Box-and-whisker plots of log2-transformed gene expression levels in glioblastoma tissue specimens from TCGA sorted by the PTEN mutational status denoted as wild-type (WT; n = 95) or mutant/deletion (mut/del; n = 50). An unpaired Wilcoxon rank-sum test was conducted between PTEN WT and mut/del expression values for each gene, resulting in the displayed p values. (B) Expression analysis of RAD51 and its paralogs stratified by the PTEN status from patient-derived GBM brain tumor initiating cells (BTICs). Box-and-whisker plots of log2-transformed gene expression levels in BTICs from the SKS dataset sorted by the PTEN mutational status denoted as wild-type (WT; n = 7) or mutant/deletion (mut/del; n = 6). An unpaired Wilcoxon rank-sum test was conducted between PTEN WT and mut/del expression values for each gene, resulting in the displayed p values. (C) Western analysis of the BTICs derived from primary and recurrent GBM patients. Each BTIC line is derived from a GBM patient with an independent PTEN mutation (PTEN status) predicted to abrogate the PTEN protein stability/function based on the Gene Analysis Toolkit (GATK) sequence analysis (https://gatk.broadinstitute.org/hc/en-us; Broad Institute, Cambridge, MA, USA) and the previous studies [58]. RAD51 is expressed in all PTEN-mutant/deficient primary GBM BTICs, while the DNA damage generated by topotecan (TPT; 10 μM at 37 °C for 2 h) induces robust phosphorylation of 53BP1 (p-53BP1S1778) indicating active cellular non-homologous end joining (NHEJ) activity. The presence of phosphorylated ATM (p-ATMS1981) and KAP1 (p-KAP1S824) is indicative of induction of the DNA damage response. Irradiation of immortalized lymphoblastoid cells (LCLs) from normal (WT) and ataxia–telangiectasia (A–T) patients serve as ATM-proficient and -deficient control lines, respectively, to track ATM/KAP1-mediated DNA damage signaling.

Similar articles

Cited by

References

    1. Steck P.A., Pershouse M.A., Jasser S.A., Yung W.K., Lin H., Ligon A.H., Langford L.A., Baumgard M.L., Hattier T., Davis T., et al. Identification of a Candidate Tumour Suppressor Gene, MMAC1, At Chromosome 10q23.3 That Is Mutated in Multiple Advanced Cancers. Nat. Genet. 1997;15:356–362. doi: 10.1038/ng0497-356. - DOI - PubMed
    1. Endersby R., Baker S.J. PTEN Signaling in Brain: Neuropathology and Tumorigenesis. Oncogene. 2008;27:5416–5430. doi: 10.1038/onc.2008.239. - DOI - PubMed
    1. Cantley L.C., Neel B.G. New Insights Into Tumor Suppression: PTEN Suppresses Tumor Formation by Restraining the Phosphoinositide 3-Kinase/AKT Pathway. Proc. Natl. Acad. Sci. USA. 1999;96:4240–4245. doi: 10.1073/pnas.96.8.4240. - DOI - PMC - PubMed
    1. Simpson L., Parsons R. PTEN: Life as a Tumor Suppressor. Exp. Cell Res. 2001;264:29–41. doi: 10.1006/excr.2000.5130. - DOI - PubMed
    1. Hou S.Q., Ouyang M., Brandmaier A., Hao H., Shen W.H. PTEN in the Maintenance of Genome Integrity: From DNA Replication to Chromosome Segregation. BioEssays. 2017;39 doi: 10.1002/bies.201700082. - DOI - PMC - PubMed