. 2020 Oct 29;11(11):1281.
doi: 10.3390/genes11111281.

Revealing Prognosis-Related Pathways at the Individual Level by a Comprehensive Analysis of Different Cancer Transcription Data

Affiliations

Revealing Prognosis-Related Pathways at the Individual Level by a Comprehensive Analysis of Different Cancer Transcription Data

Jingya Fang et al. Genes (Basel). .

Abstract

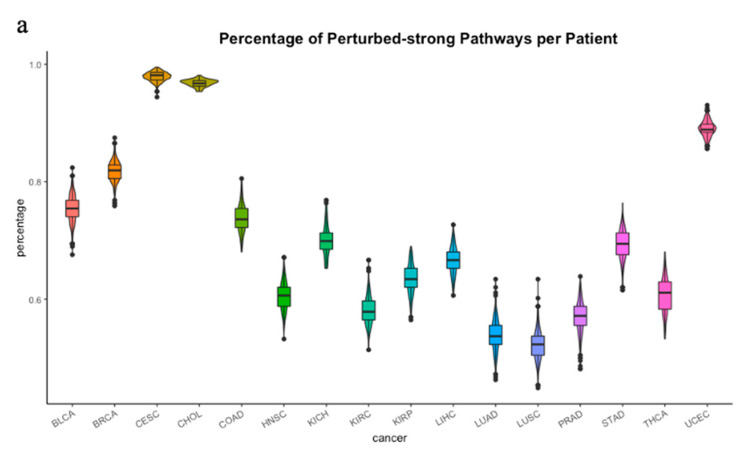
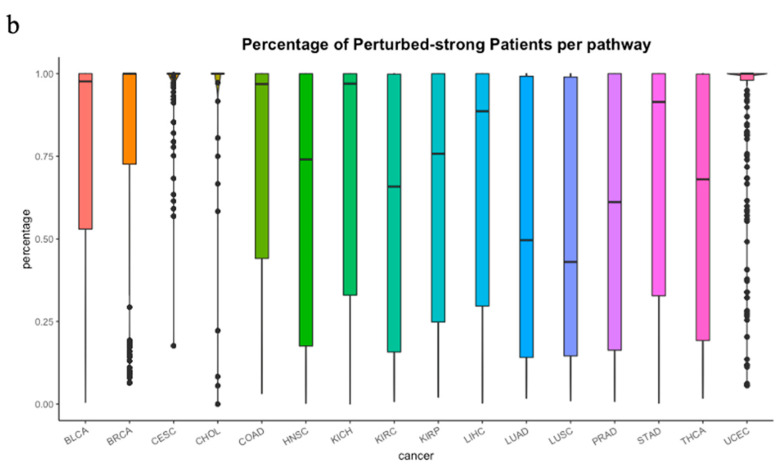
Identifying perturbed pathways at an individual level is important to discover the causes of cancer and develop individualized custom therapeutic strategies. Though prognostic gene lists have had success in prognosis prediction, using single genes that are related to the relevant system or specific network cannot fully reveal the process of tumorigenesis. We hypothesize that in individual samples, the disruption of transcription homeostasis can influence the occurrence, development, and metastasis of tumors and has implications for patient survival outcomes. Here, we introduced the individual-level pathway score, which can measure the correlation perturbation of the pathways in a single sample well. We applied this method to the expression data of 16 different cancer types from The Cancer Genome Atlas (TCGA) database. Our results indicate that different cancer types as well as their tumor-adjacent tissues can be clearly distinguished by the individual-level pathway score. Additionally, we found that there was strong heterogeneity among different cancer types and the percentage of perturbed pathways as well as the perturbation proportions of tumor samples in each pathway were significantly different. Finally, the prognosis-related pathways of different cancer types were obtained by survival analysis. We demonstrated that the individual-level pathway score (iPS) is capable of classifying cancer types and identifying some key prognosis-related pathways.

Keywords: TCGA; cancer; iPS; prognosis-related pathways.


Conflict of interest statement

The authors declare no conflict of interest.

Figures

Figure 1
Figure 1
Flowchart of the individual-level pathway score (iPS) approach. (a) For a group of n normal samples, compute the correlations, i.e., the PCCn (the Pearson correlation coefficient (PCC) of an edge in each pathway with n samples) of each edge in the pathway based on expression data. Then, a new individual sample d is added to the group, and the new correlation of each edge in the pathways is calculated in the same way by the PCCn+1 of the combined data. (b) The pathway-based differential correlation is calculated by the difference of the corresponding edge in terms of PCC, i.e., PCC = PCCn+1PCCn for each edge. The sum of all edges, the PCC value, is obtained for each pathway. (c) iPS is defined as an individual pathway-based score that can quantify the correlation perturbation of each pathway in each sample. Finally, analyses of distribution, classification, survival, and prognosis are performed.
Figure 2
Figure 2
Density plot of the iPS score. The red and green colors represent normal samples and tumor samples, respectively. The iPSs of tumor samples are higher than those of normal samples. Additionally, the tumor samples’ iPSs are more dispersed than those of the normal samples.
Figure 3
Figure 3
Results of the pan-cancer classification distributed in the tSNE plot. Different colors represent different cancer types and corresponding normal samples. The tringles and dots are used to distinguish tumor and normal samples. The number of clusters is 32, which contains 16 cancer types and their corresponding normal types.
Figure 4
Figure 4
The violin plot of perturbations in each cancer. (a) The percentage of perturbed-strong pathways per patient in 16 cancer types. Different colors represent different patient samples of each cancer type. Cervical squamous cell cancer (CESC) and cholangio cancer (CHOL) showed 97% and 96% perturbed pathways, respectively. Breast cancer (BRCA) and uterine corpus endometrial cancer (UCEC) also had high proportions, which were both over 80%. (b) The percentage of perturbed-strong patient per pathway. High percentages were observed in CESC, CHOL and UCEC, which were near 100%. The percentages in LUAD and LUSC were below 50%.
Figure 4
Figure 4
The violin plot of perturbations in each cancer. (a) The percentage of perturbed-strong pathways per patient in 16 cancer types. Different colors represent different patient samples of each cancer type. Cervical squamous cell cancer (CESC) and cholangio cancer (CHOL) showed 97% and 96% perturbed pathways, respectively. Breast cancer (BRCA) and uterine corpus endometrial cancer (UCEC) also had high proportions, which were both over 80%. (b) The percentage of perturbed-strong patient per pathway. High percentages were observed in CESC, CHOL and UCEC, which were near 100%. The percentages in LUAD and LUSC were below 50%.
Figure 5
Figure 5
Kaplan–Meier survival analysis. The survival curves of the perturbed-weak and perturbed-strong groups of BRCA based on the iPS in the DAP12 interaction pathway. The X axis is survival in days. The Y axis is the overall survival rate.

Similar articles

Cited by

References

    1. Vogelstein B., Papadopoulos N., Velculescu V.E., Zhou S.B., Diaz L.A., Kinzler K.W. Cancer Genome Landscapes. Science. 2013;339:1546–1558. doi: 10.1126/science.1235122. - DOI - PMC - PubMed
    1. Karchin R., Nussinov R. Genome Landscapes of Disease: Strategies to Predict the Phenotypic Consequences of Human Germline and Somatic Variation. PLoS Comput. Biol. 2016;12:e1005043. doi: 10.1371/journal.pcbi.1005043. - DOI - PMC - PubMed
    1. Ashley E.A., Butte A.J., Wheeler M.T., Chen R., Klein T.E., Dewey F.E., Dudley J.T., Ormond K.E., Pavlovic A., Morgan A.A., et al. Clinical assessment incorporating a personal genome. Lancet. 2010;375:1525–1535. doi: 10.1016/S0140-6736(10)60452-7. - DOI - PMC - PubMed
    1. Dewey F.E., Chen R., Cordero S.P., Ormond K.E., Caleshu C., Karczewski K.J., Whirl-Carrillo M., Wheeler M.T., Dudley J.T., Byrnes J.K., et al. Phased Whole-Genome Genetic Risk in a Family Quartet Using a Major Allele Reference Sequence. PLoS Genet. 2011;7:e1002280. doi: 10.1371/journal.pgen.1002280. - DOI - PMC - PubMed
    1. Chen R., Mias G.I., Li-Pook-Than J., Jiang L., Lam H.Y., Chen R., Miriami E., Karczewski K.J., Hariharan M., Dewey F.E., et al. Personal omics profiling reveals dynamic molecular and medical phenotypes. Cell. 2012;148:1293–1307. doi: 10.1016/j.cell.2012.02.009. - DOI - PMC - PubMed