. 2020 Oct 29;9(11):2371.
doi: 10.3390/cells9112371.

Overexpression of α-Synuclein by Oligodendrocytes in Transgenic Mice Does Not Recapitulate the Fibrillar Aggregation Seen in Multiple System Atrophy

Affiliations

Overexpression of α-Synuclein by Oligodendrocytes in Transgenic Mice Does Not Recapitulate the Fibrillar Aggregation Seen in Multiple System Atrophy

Florent Laferrière et al. Cells. .

Abstract

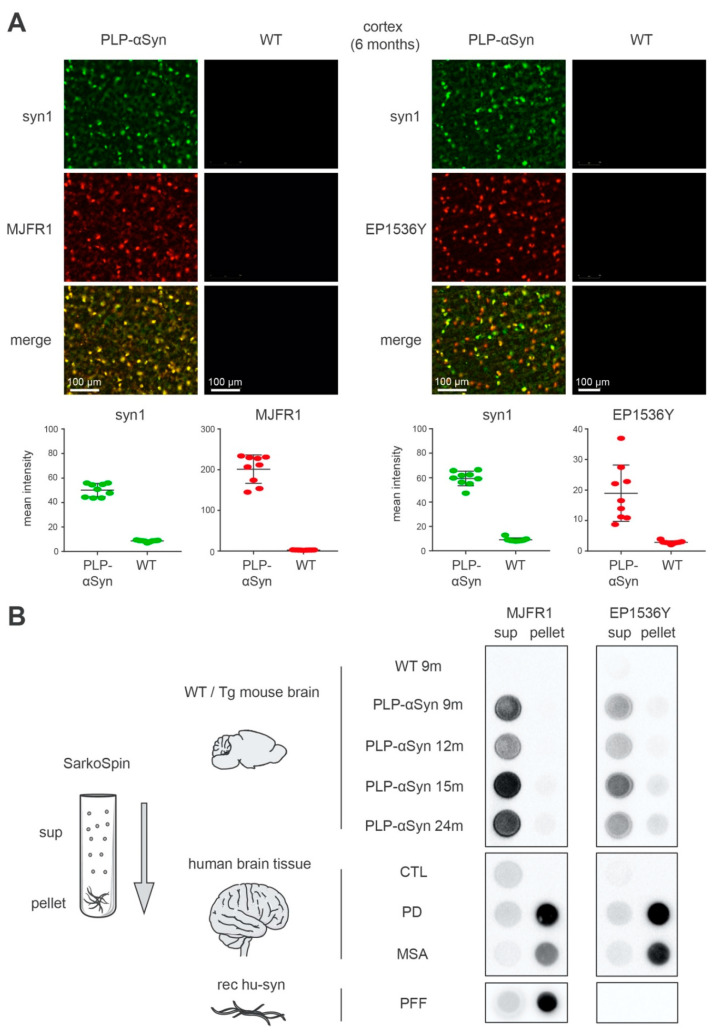
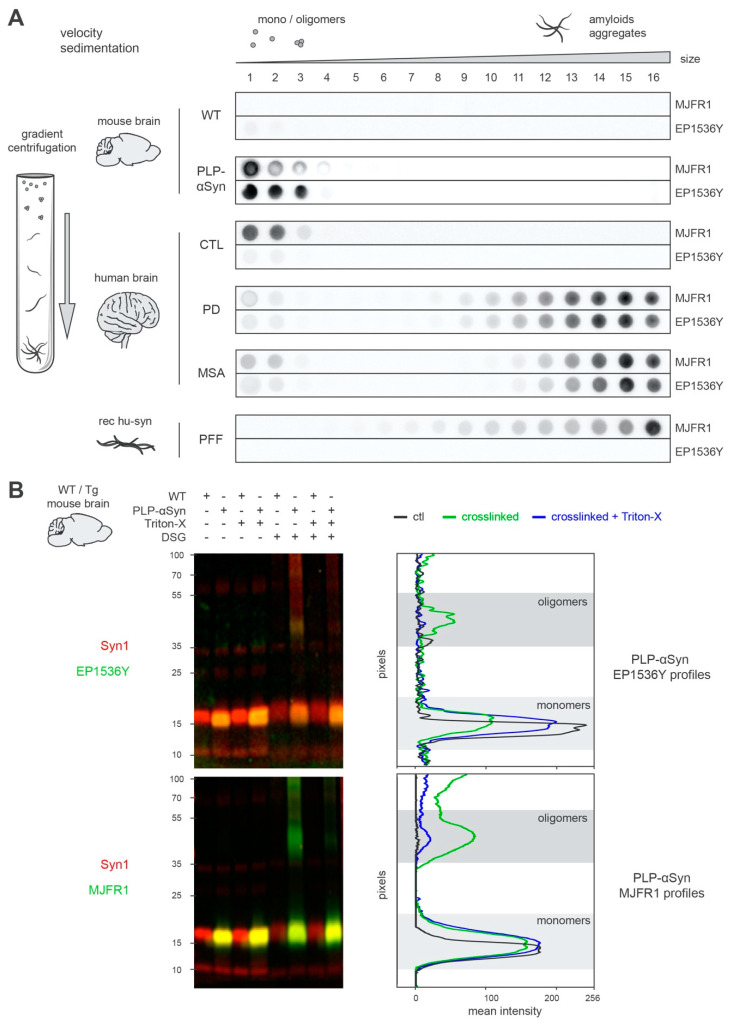
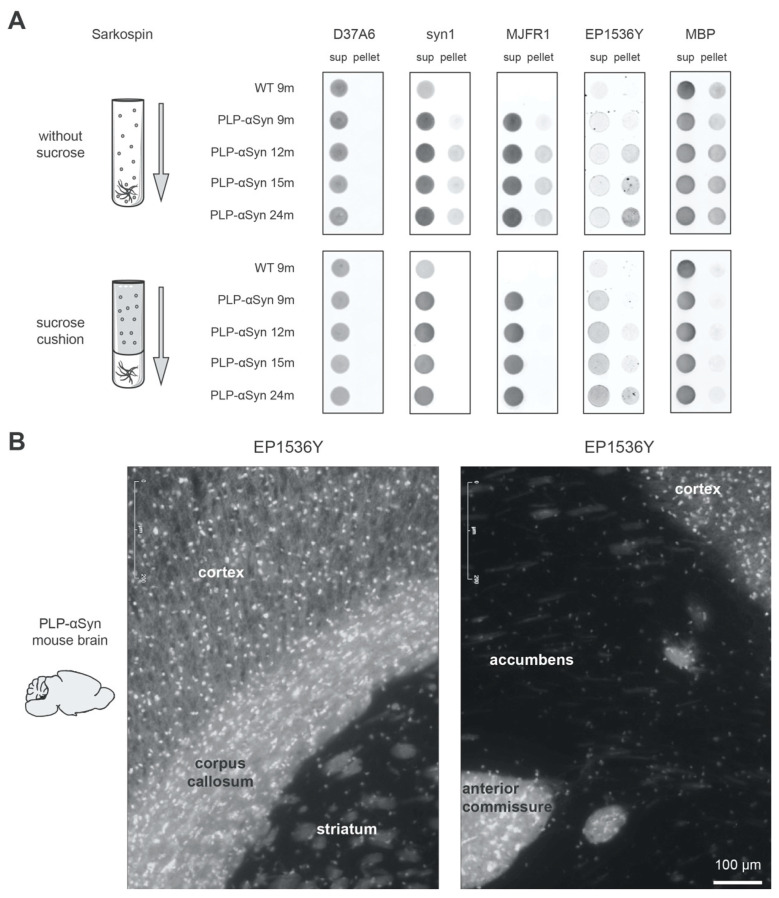
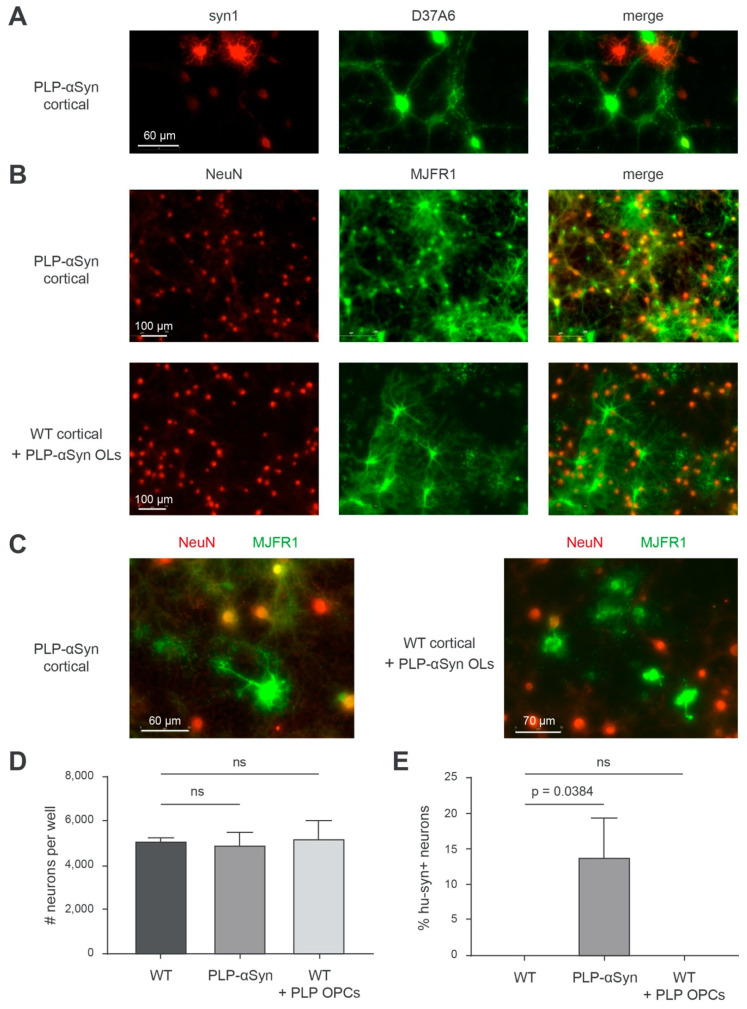
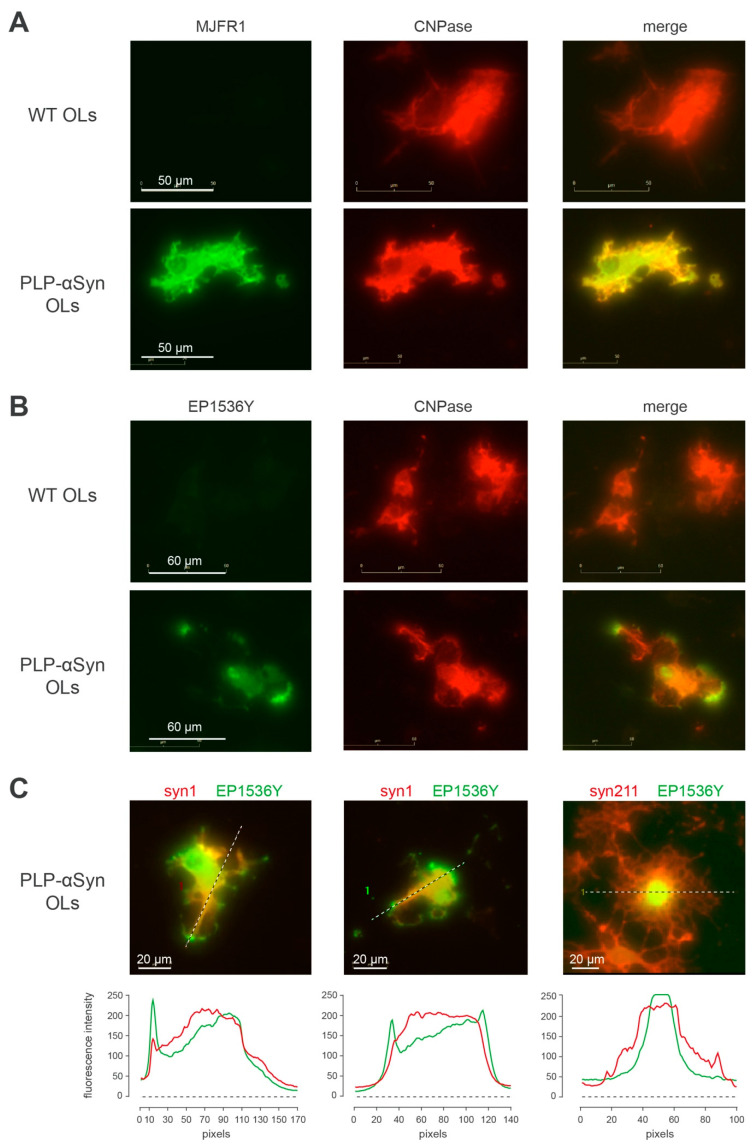
The synucleinopathy underlying multiple system atrophy (MSA) is characterized by the presence of abundant amyloid inclusions containing fibrillar α-synuclein (α-syn) aggregates in the brains of the patients and is associated with an extensive neurodegeneration. In contrast to Parkinson's disease (PD) where the pathological α-syn aggregates are almost exclusively neuronal, the α-syn inclusions in MSA are principally observed in oligodendrocytes (OLs) where they form glial cytoplasmic inclusions (GCIs). This is intriguing because differentiated OLs express low levels of α-syn, yet pathogenic amyloid α-syn seeds require significant amounts of α-syn monomers to feed their fibrillar growth and to eventually cause the buildup of cytopathological inclusions. One of the transgenic mouse models of this disease is based on the targeted overexpression of human α-syn in OLs using the PLP promoter. In these mice, the histopathological images showing a rapid emergence of S129-phosphorylated α-syn inside OLs are considered as equivalent to GCIs. Instead, we report here that they correspond to the accumulation of phosphorylated α-syn monomers/oligomers and not to the appearance of the distinctive fibrillar α-syn aggregates that are present in the brains of MSA or PD patients. In spite of a propensity to co-sediment with myelin sheath contaminants, the phosphorylated forms found in the brains of the transgenic animals are soluble (>80%). In clear contrast, the phosphorylated species present in the brains of MSA and PD patients are insoluble fibrils (>95%). Using primary cultures of OLs from PLP-αSyn mice we observed a variable association of S129-phosphorylated α-syn with the cytoplasmic compartment, the nucleus and with membrane domains suggesting that OLs functionally accommodate the phospho-α-syn deriving from experimental overexpression. Yet and while not taking place spontaneously, fibrillization can be seeded in these primary cultures by challenging the OLs with α-syn preformed fibrils (PFFs). This indicates that a targeted overexpression of α-syn does not model GCIs in mice but that it can provide a basis for seeding aggregation using PFFs. This approach could help establishing a link between α-syn aggregation and the development of a clinical phenotype in these transgenic animals.

Keywords: GCIs; multiple system atrophy; α-synuclein.


Conflict of interest statement

The authors declare no conflict of interest.

Figures

Figure 1
Figure 1
The S129-phosphorylated α-syn species found in the brain of PLP-αSyn mice are distinct from the amyloid forms extracted from Parkinson’s disease (PD) and multiple system atrophy (MSA) brains and from recombinant preformed fibrils (PFFs). (A) Immunofluorescence staining of 6 months-old PLP-αSyn mouse cortical sections, representative of 3 independent experiments. Total α-syn (syn1, green, top panels) shows a complete colocalization with human α-syn (MJFR1, red, mid-left panels) and partial colocalization with pS129 phosphorylated α-syn (EP1536Y, red, mid-right panels). The 4 lower panel quantifications depict the mean field intensity values of 9 cortical/striatal fields of views at 20× from the sections shown above and confirm the massive overexpression of α-syn in PLP-αSyn mouse brains compared to wild-type (WT). (B) Biochemical aggregation analysis of the different species of α-syn found in WT or PLP-αSyn mouse brains (top), control, PD and MSA human subject brains (middle) or a preparation of recombinant human α-syn PFF (bottom). Pooled 9 to 24 months-old mice (n = 3) or human (n = 3) brain homogenates and PFF samples were subjected to SarkoSpin procedure consisting of a sarkosyl solubilization at 37 °C with nuclease under shaking followed by an ultracentrifugation on sucrose cushion. The contents in human α-syn (MJFR1, left panel) and pS129-α-syn (EP1536Y, right panel) of SarkoSpin supernatant and pellet fractions were assessed by filter trap followed by immunolabelling with the respective antibodies. Pictures are representative of n = 3 independent Sarkospin procedures quantified in Supplementary Figure S1.
Figure 2
Figure 2
Unlike in MSA and PD, S129-phosphorylated human α-syn is oligomeric and monomeric in PLP-αSyn mouse brains. (A) Aggregation profiles obtained by sedimentation of the different species of α-syn found in WT or PLP-αSyn mouse brains (top), control, PD and MSA human subject brains (middle) or a preparation of recombinant human α-syn PFF (bottom). Pooled mouse (n = 3) or human (n = 3) brain homogenates and PFF samples were subjected to SarkoSpin solubilization followed with fractionation by sedimentation velocity upon ultracentrifugation on iodixanol gradient. The distribution of human α-syn (MJFR1) and pS129-α-syn (EP1536Y) was analyzed by filter trap on the collected fractions (numbered from top to bottom of gradient) followed by immunostaining with the respective antibodies. Pictures are representative of n = 3 independent sedimentations quantified in Supplementary Figure S2. (B) Representative western blot pictures (left) and their intensity quantification (right) of WT/PLP-αSyn mouse brains samples. Cytosolic fractions from pooled 9 months-old WT (n = 3) or age-matched PLP-αSyn (n = 3) brain homogenates were treated or not with Triton-X (0.25%, 30 min on ice) followed by crosslinking or not with DSG (2 mM, room temperature). These samples were subjected to SDS-PAGE electrophoresis and immunoblotted with couples of antibodies directed against total α-syn (syn1, red) and pS129-α-syn (EP1536Y, green, top) or human α-syn (MJFR1, green, bottom) using infrared dyes labelled secondary antibodies. Signal intensity of pS129-α-syn (top) and human α-syn (bottom) were quantified vertically by line scanning for PLP-αSyn samples untreated (black), DSG-crosslinked (green) or with prior Triton-X treatment (blue). Monomeric (light) and oligomeric (dark) species of the two forms of the proteins are depicted with the grey zones.
Figure 3
Figure 3
pS129-positive α-syn mono/oligomers co-sediment with MBP and are enriched in myelinated regions of the PLP-αSyn mouse brain. (A) Sedimentation analysis of the different species of α-syn found in WT or PLP-αSyn mouse brains with or without myelin floatation. Pooled 9 to 24 months-old mouse brain homogenates (n = 3) were subjected to SarkoSpin normal procedure (with sucrose cushion, bottom) or to the same procedure without myelin floatation sucrose cushion (without sucrose, top). The content in endogenous murine α-syn (D37A6), total α-syn (syn1), human α-syn (MJFR1), pS129-α-syn (EP1536Y) and myelin basic protein (MBP) of SarkoSpin supernatant and pellet fractions were assessed by filter trap followed by immunolabelling with the respective antibodies. Pictures are representative of n = 2 independent Sarkospin procedures quantified in Supplementary Figure S3. (B) Representative pS129-α-syn immunofluorescence staining of six months-old PLP-αSyn mouse brain sections. Hyperphosphorylated forms of the protein are prominent in regions with long myelinated axons such as the corpus callosum and the anterior commissure.
Figure 4
Figure 4
The presence of neuronal human α-syn in PLP-αSyn primary cortical cultures is not due to an OL-to-neuron transfer of the protein. (A) Representative immunofluorescence imaging of total α-syn (syn1, red) and endogenous murine α-syn (D37A6, green) in primary cortical cultures PLP-αSyn mouse. (B) Representative immunofluorescence imaging of neurons (NeuN, red) and human α-syn (MJFR1, green) in primary cortical cultures from PLP-αSyn mouse (top) or WT mouse supplemented with PLP-αSyn oligodendrocytes (bottom). (C) Close-up representative illustrations of the merged pictures shown in B. (D) Bar graph of the quantifications of the number of neurons (NeuN+ cells) per well. Equal averages of approximately 5000 neurons were obtained, with no significant differences between conditions (Holm-Sidak corrected multiple t-tests), ns: not statistically different. (E) Bar graph of the quantifications of the ratios of human α-syn positive neurons (hu-syn+ NeuN+/NeuN+ cells) per well in the three different culture conditions. After thresholding out the residual unspecific nuclear staining yielded by MJFR1, these cells are detected solely in PLP-αSyn primary cortical cultures (p-Values obtained with Holm-Sidak corrected multiple t-tests). For each condition 9 fields corresponding to 5.13 mm2 that is, 15% of the total well surface, of 2 independent wells were analyzed. Results are representative of 3 independent experiments.
Figure 5
Figure 5
pS129 positive human α-syn is enriched in OL processes (A) Representative immunofluorescence imaging of 2′,3′-cyclic-nucleotide 3′-phosphodiesterase (CNPase, red) together with human α-syn (MJFR1, green) in primary cultures of OLs from PLP-αSyn mice and wt mice. (B) Representative immunofluorescence imaging of 2′,3′-cyclic-nucleotide 3′-phosphodiesterase (CNPase, red) together with pS129-α-syn (EP1536Y, green, bottom) in primary cultures of OLs from PLP-αSyn mice and wt mice. (C) Left and middle panels: localization at the processes tips of phosphorylated human α-syn, with total α-syn (syn1, red) and pS129-α-syn (EP1536Y, green) immunofluorescence staining and respective quantification of the profile intensities by linescan analysis. Right panel shows the occasional nuclear localization of phosphorylated human α-syn, with total human α-syn (Syn-211, red) and pS129-α-syn (EP1536Y, green) immunofluorescence staining and respective quantification of the profile intensities by linescan analysis. Results are representative of 3 independent experiments.
Figure 6
Figure 6
Aggregation of human α-syn does not spontaneously take place on OLs from PLP-αSyn mice but can be experimentally seeded by challenging with PFFs. (A) Representative immunofluorescence imaging of neurons (NeuN, red) and human α-syn (MJFR1, green) in primary cortical cultures from WT mouse supplemented with OLs from PLP-αSyn mice, untreated (left) or challenged with human α-syn PFF of type 1 (middle, PFF #1) or type 2 (right, PFF #2). Pictures were taken four weeks post treatment and show OLs morphology changes with cellular shrinking upon PFF treatments. (B) Bar graph representing the quantification of MJFR1 area in the different conditions described in A, traducing the OLs surface measurements, with a significant shrinking of these cells upon challenge with PFF (pValues obtained with Holm-Sidak corrected multiple t-tests). (C) Representative immunofluorescence imaging of the synucleinopathy as shown by aggregated α-syn (synF1, red) and hyperphosphorylated pS129-α-syn (EP1536Y, green) in primary cortical cultures from WT mouse (top) and the same cultures supplemented with OLs from PLP-αSyn mice (bottom). These two cultures were untreated (left) or challenged with human α-syn PFF of type 1 (middle, PFF #1) or type 2 (right, PFF #2). (D) Representative image shown in C with a neurite segmentation filter applied (right, pink), allowing the quantification of neuritic synucleinopathy plotted in the bar graph. Total synucleinopathy neurite length is shown for WT primary cortical cultures supplemented or not with WT or PLP-αSyn OLs and challenged or not with PFF of the two types. The extent of the neuronal synucleinopathy is independent of the addition of OLs (p values obtained with Holm-Sidak corrected multiple t-tests), ns: not statistically different. (E) Representative image shown in C with an OLs segmentation filter applied (right, pink), allowing the quantification of synucleinopathy located in the OL cell bodies, plotted in the bar graph. Total OLs synucleinopathy is shown as area measured for WT primary cortical cultures supplemented or not with WT or PLP-αSyn OLs and challenged or not with PFF of the two types (p values obtained with Holm-Sidak corrected multiple t-tests). For each condition 9 fields of 2 independent wells were analyzed corresponding to 5.13 mm2 that is, 15% of the total well surface. Results are representative of 2 independent experiments.

Similar articles

Cited by

References

    1. Papp M.I., Kahn J.E., Lantos P.L. Glial cytoplasmic inclusions in the CNS of patients with multiple system atrophy (striatonigral degeneration, olivopontocerebellar atrophy and Shy-Drager syndrome) J. Neurol. Sci. 1989;94:79–100. doi: 10.1016/0022-510X(89)90219-0. - DOI - PubMed
    1. Papp M.I., Lantos P.L. The distribution of oligodendroglial inclusions in multiple system atrophy and its relevance to clinical symptomatology. Brain. 1994;117:235–243. doi: 10.1093/brain/117.2.235. - DOI - PubMed
    1. Spillantini M.G., Crowther R.A., Jakes R., Cairns N.J., Lantos P.L., Goedert M. Filamentous alpha-synuclein inclusions link multiple system atrophy with Parkinson’s disease and dementia with Lewy bodies. Neurosci. Lett. 1998;251:205–208. doi: 10.1016/S0304-3940(98)00504-7. - DOI - PubMed
    1. Wakabayashi K., Yoshimoto M., Tsuji S., Takahashi H. A-Synuclein Immunoreactivity in Glial Cytoplasmic Inclusions in Multiple System Atrophy. Neurosci. Lett. 1998;249:180–182. doi: 10.1016/S0304-3940(98)00407-8. - DOI - PubMed
    1. Meissner W.G., Fernagut P.O., Dehay B., Péran P., Le Traon A.P., Foubert-Samier A., Lopez Cuina M., Bezard E., Tison F., Rascol O. Multiple System Atrophy: Recent Developments and Future Perspectives. Mov. Disord. 2019;34:1629–1642. doi: 10.1002/mds.27894. - DOI - PubMed

Publication types

MeSH terms