. 2020 Oct 29;9(11):2374.
doi: 10.3390/cells9112374.

Single-Cell Transcriptome Analysis Highlights a Role for Neutrophils and Inflammatory Macrophages in the Pathogenesis of Severe COVID-19

Affiliations

Single-Cell Transcriptome Analysis Highlights a Role for Neutrophils and Inflammatory Macrophages in the Pathogenesis of Severe COVID-19

Hibah Shaath et al. Cells. .

Abstract

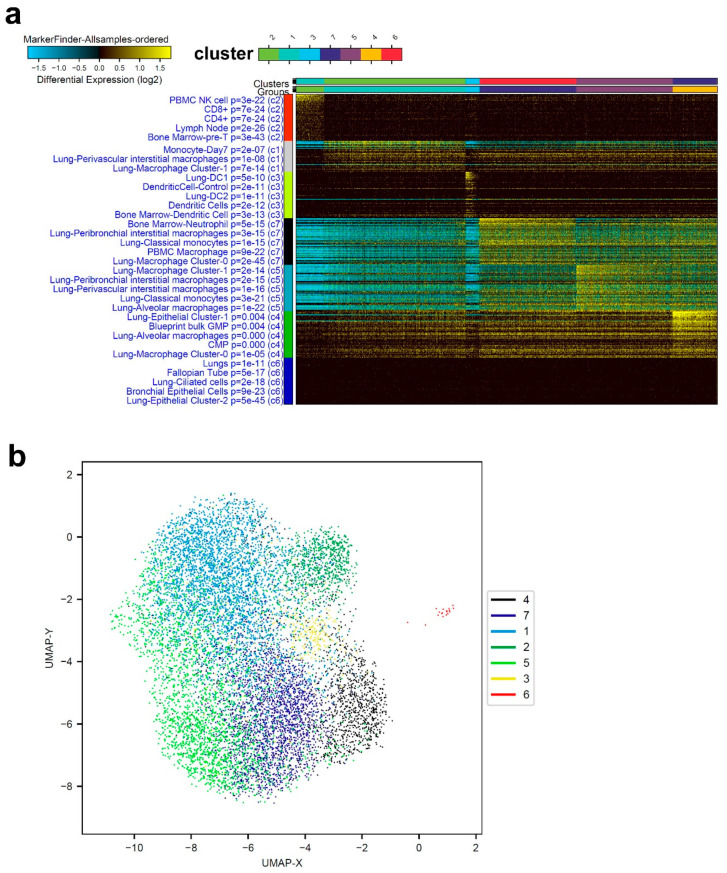
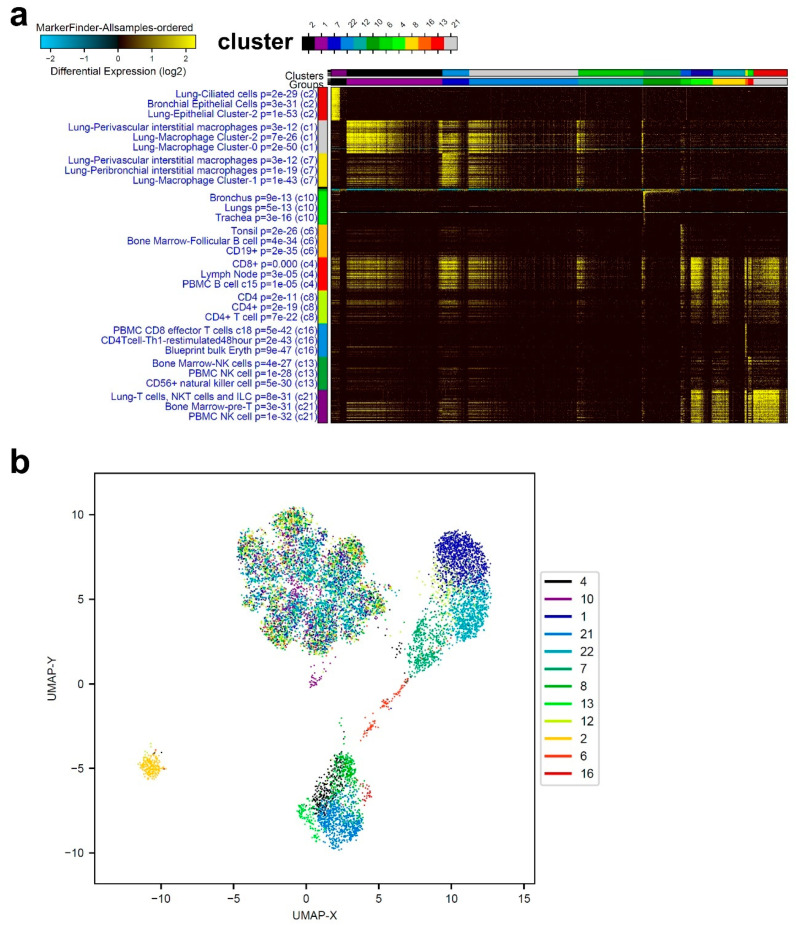
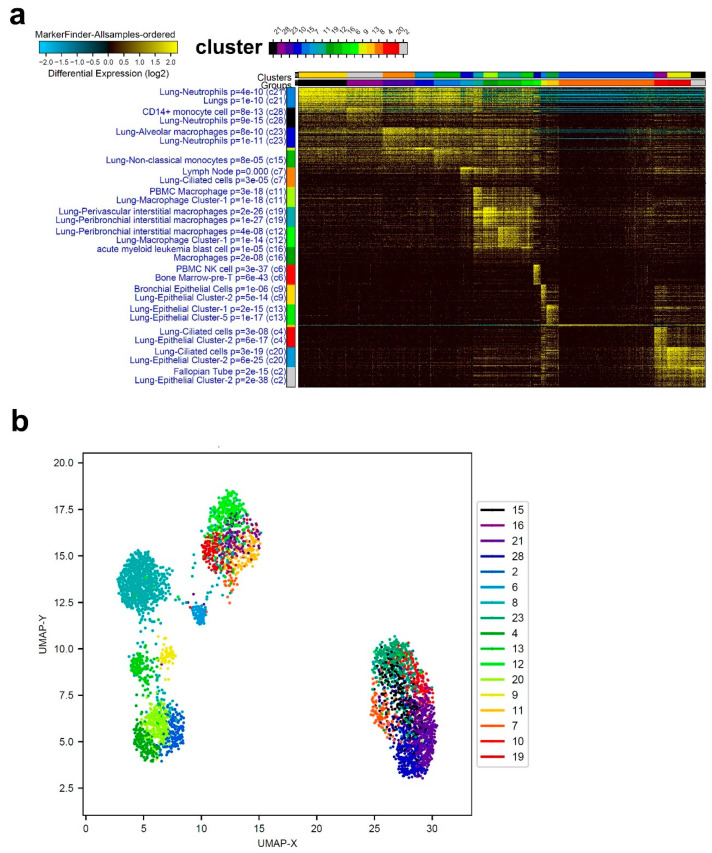
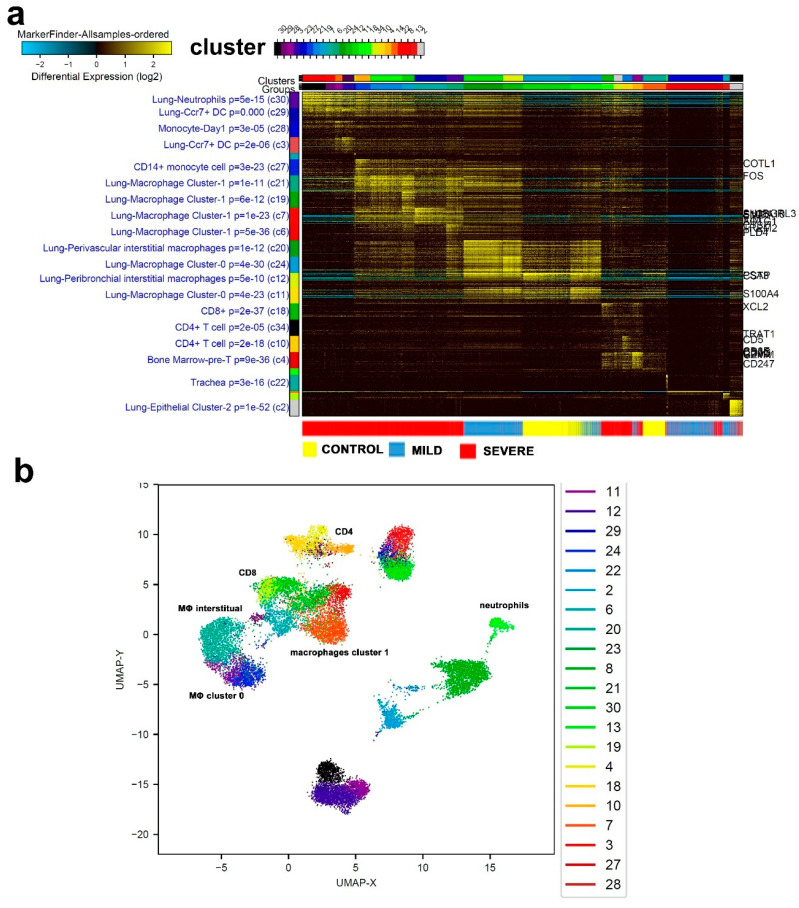
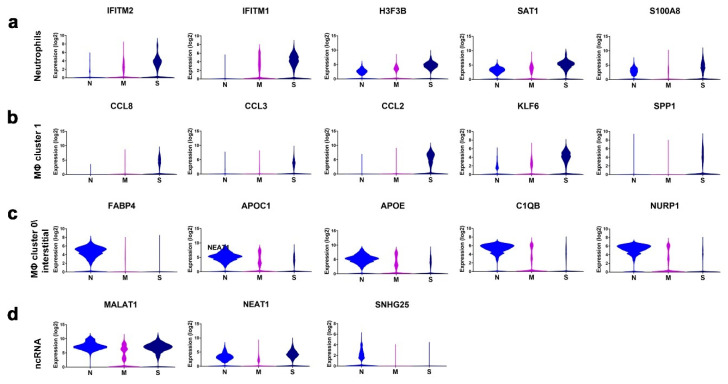
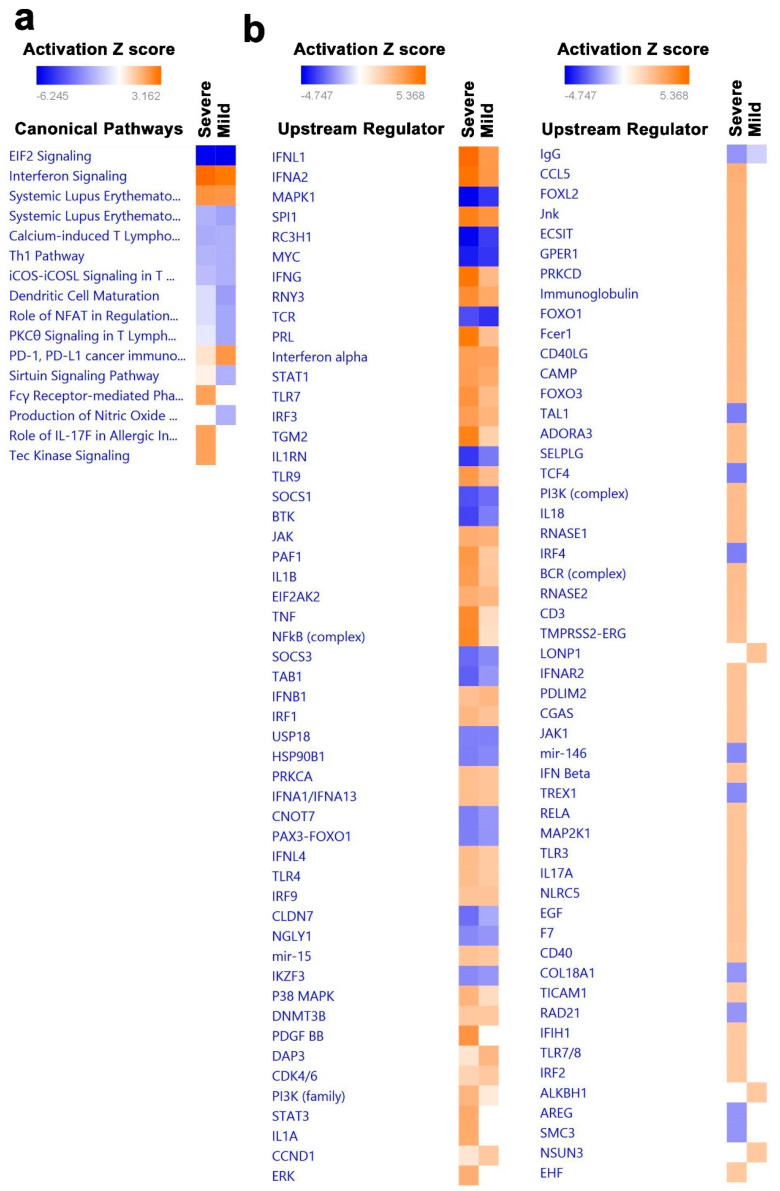
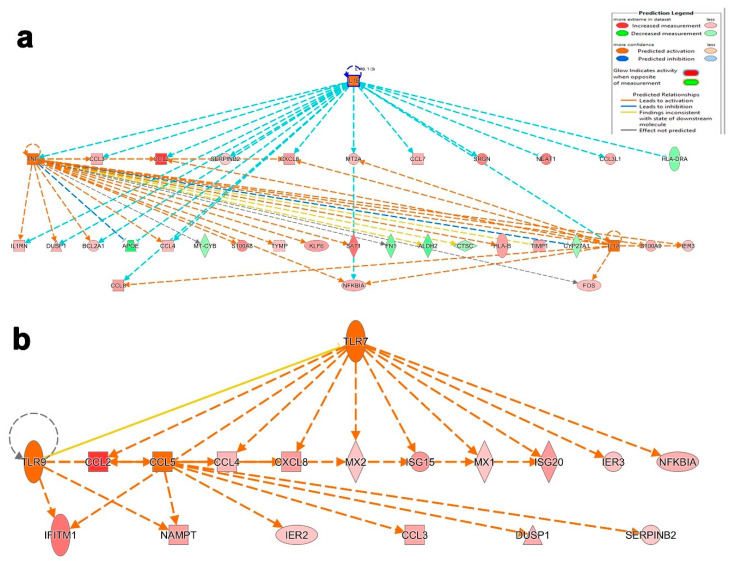
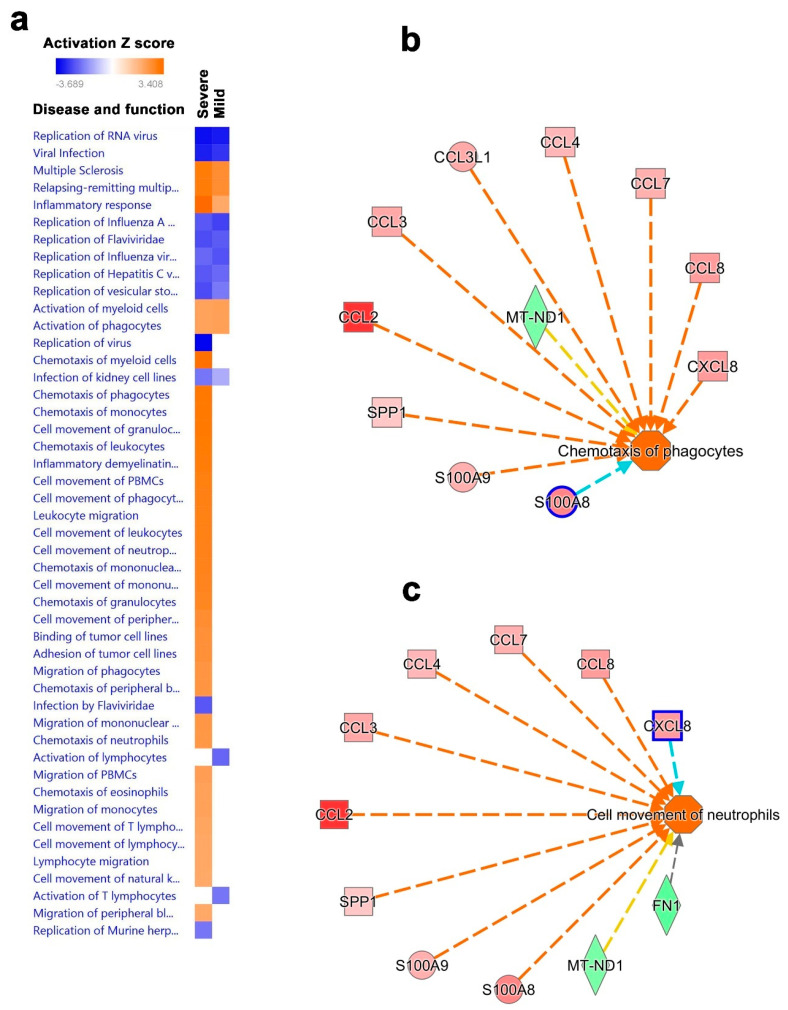
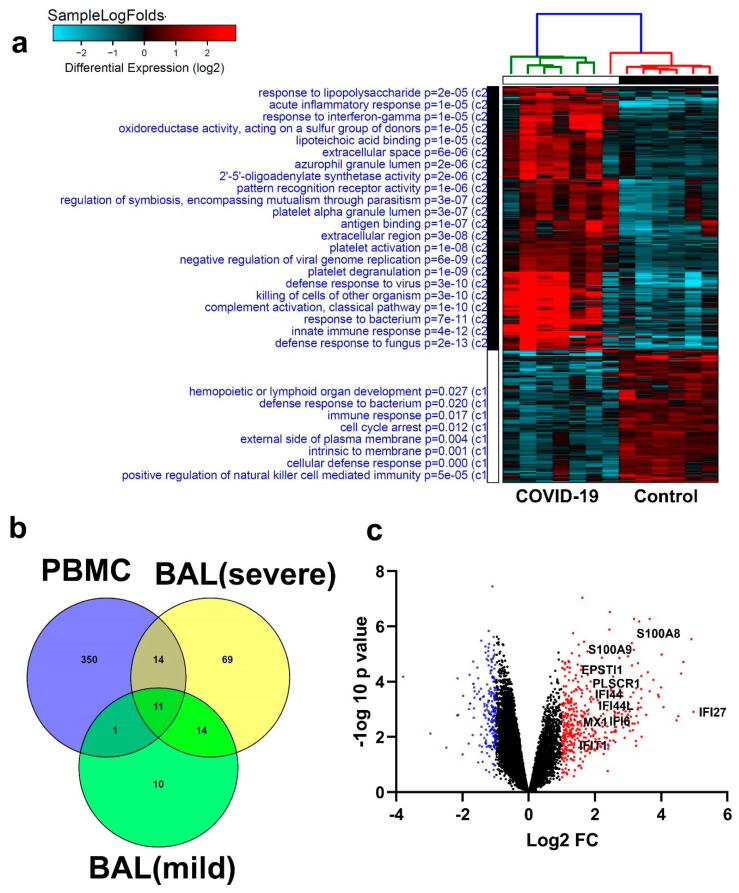
Cumulative data link cytokine storms with coronavirus disease 2019 (COVID-19) severity. The precise identification of immune cell subsets in bronchoalveolar lavage (BAL) and their correlation with COVID-19 disease severity are currently being unraveled. Herein, we employed iterative clustering and guide-gene selection 2 (ICGS2) as well as uniform manifold approximation and projection (UMAP) dimensionality reduction computational algorithms to decipher the complex immune and cellular composition of BAL, using publicly available datasets from a total of 68,873 single cells derived from two healthy subjects, three patients with mild COVID-19, and five patients with severe COVID-19. Our analysis revealed the presence of neutrophils and macrophage cluster-1 as a hallmark of severe COVID-19. Among the identified gene signatures, IFITM2, IFITM1, H3F3B, SAT1, and S100A8 gene signatures were highly associated with neutrophils, while CCL8, CCL3, CCL2, KLF6, and SPP1 were associated with macrophage cluster-1 in severe-COVID-19 patients. Interestingly, although macrophages were also present in healthy subjects and patients with mild COVID-19, they had different gene signatures, indicative of interstitial and cluster-0 macrophage (i.e., FABP4, APOC1, APOE, C1QB, and NURP1). Additionally, MALAT1, NEAT1, and SNGH25 were downregulated in patients with mild and severe COVID-19. Interferon signaling, FCγ receptor-mediated phagocytosis, IL17, and Tec kinase canonical pathways were enriched in patients with severe COVID-19, while PD-1 and PDL-1 pathways were suppressed. A number of upstream regulators (IFNG, PRL, TLR7, PRL, TGM2, TLR9, IL1B, TNF, NFkB, IL1A, STAT3, CCL5, and others) were also enriched in BAL cells from severe COVID-19-affected patients compared to those from patients with mild COVID-19. Further analyses revealed genes associated with the inflammatory response and chemotaxis of myeloid cells, phagocytes, and granulocytes, among the top activated functional categories in BAL from severe COVID-19-affected patients. Transcriptome data from another cohort of COVID-19-derived peripheral blood mononuclear cells (PBMCs) revealed the presence of several genes common to those found in BAL from patients with severe and mild COVID-19 (IFI27, IFITM3, IFI6, IFIT3, MX1, IFIT1, OASL, IFI30, OAS1) or to those seen only in BAL from severe-COVID-19 patients (S100A8, IFI44, IFI44L, CXCL8, CCR1, PLSCR1, EPSTI1, FPR1, OAS2, OAS3, IL1RN, TYMP, BCL2A1). Taken together, our data reveal the presence of neutrophils and macrophage cluster-1 as the main immune cell subsets associated with severe COVID-19 and identify their inflammatory and chemotactic gene signatures, also partially reflected systemically in the circulation, for possible diagnostic and therapeutic interventions.

Keywords: COVID-19; ICGS2; SARS-Cov-2; UMAP; bronchoalveolar lavage (BAL); inflammatory macrophages; neutrophils.


Conflict of interest statement

The authors declare no conflict of interest.

Figures

Figure 1
Figure 1
Representative single-cell analysis of bronchoalveolar lavage (BAL) from healthy subjects. (a) Representative single-cell analysis of BAL from healthy subjects employing the iterative clustering and guide-gene selection 2 (ICGS2) algorithm depicted as heat map. The text on the left indicates enriched cell-type markers from the default gene-set enrichment analysis and corresponding “Z” score p value. (b) Uniform manifold approximation and projection (UMAP) dimensionality reduction visualization of cell clusters corresponding to data presented in panel (a).
Figure 2
Figure 2
Representative single-cell analysis of BAL from a mild COVID-19 patient. (a) Representative single-cell analysis of BAL from a mild-COVID-19 patient employing the ICGS2 algorithm depicted as heat map. (b) UMAP dimensionality reduction visualization of cell clusters corresponding to data presented in panel (a).
Figure 3
Figure 3
Representative single-cell analysis of BAL from a severe-COVID-19 patient. (a) Representative single-cell analysis of BAL from a severe COVID-19 patient employing the ICGS2 algorithm depicted as heat map. (b) UMAP dimensionality reduction visualization of cell clusters corresponding to data presented in panel (a).
Figure 4
Figure 4
Combined single-cell analysis of BAL from severe- and mild-COVID-19 patients compared to healthy subjects. A total of 16,310 BAL-derived single cells from two healthy subjects, three patients with mild COVID-19, and five patients with severe COVID-19 were subjected to singl- cell analysis. Data are displayed as heat map (a) with the enriched cell population indicated on the left. (b) UMAP dimensionality reduction visualization of cell clusters corresponding to data presented in panel a with selected enriched cell populations indicated. MΦ: macrophages.
Figure 5
Figure 5
Expression of enriched gene markers in patients with mild or severe COVID-19 compared to healthy subjects. Expression of gene signatures derived from neutrophils (a), macrophage (MΦ) cluster 1 (b), macrophage cluster 0/interstitial (c), and noncoding RNAs (ncRNA) (d) in a total of 68,873 single cells derived from two healthy subjects, three patients with mild COVID-19, and five patients with severe COVID-19. Data are presented as violin plots. N: control, M: mild, S: Severe. Statistical analysis revealed significant differences in gene expression (p ≤ 0.0001) when comparing S vs. M, S vs. N, and M vs. N for the indicated genes.
Figure 6
Figure 6
Identification of canonical pathways and upstream regulator networks associated with severe and mild COVID-19. Differentially expressed genes in patients with severe vs. control and mild vs. control COVID-19 were subjected to canonical and upstream regulator analysis using ingenuity pathways analysis (IPA). (a) Comparative analysis of significantly altered canonical pathways in mild- and severe-COVID-19 BAL transcriptome data. (b) Comparative analysis of significantly altered upstream regulatory networks in mild- and severe-COVID-19 BAL transcriptome data. Red indicates activated, while blue indicates suppressed pathways. Activation Z score is depicted according to the color scale.
Figure 7
Figure 7
Illustration of selected activated upstream networks in patients with severe COVID-19. Graphical presentation of IL1A, IL1B, and TNF (a) networks in patients with severe COVID-19. (b) Presentation of CCL5, TLR7, and TLR9 upstream regulator networks.
Figure 8
Figure 8
Disease and functional analysis of differentially expressed genes in BAL from patients with mild and severe COVID-19. (a) Heat map depicting the activation states of the indicated disease and function categories in mild- and severe-COVID-19 BAL cells. Illustration of chemotaxis of phagocytes (b) and cell movement of neutrophils (c) in patients with severe COVID-19 based on IPA analysis.
Figure 9
Figure 9
Similarities in transcriptome data from BAL and peripheral blood mononuclear cell (PBMCs) in COVID-19 patients. (a) Hierarchical clustering summarizing differential gene expression (log2) in PBMCs from COVID-19 and normal controls, highlighting enriched functional categories (GO). (b) Venny diagram illustrating the aberrantly expressed genes in common in severe- and mild-Covid-19 BAL and PBMC, with 11 genes in common to the three categories. (c) Volcano plot depicting selected genes common to BAL and PBMCs, indicating upregulated (red) and downregulated (blue) genes.

References

    1. Wang J., Jiang M., Chen X., Montaner L.J. Cytokine storm and leukocyte changes in mild versus severe SARS-CoV-2 infection: Review of 3939 COVID-19 patients in China and emerging pathogenesis and therapy concepts. J. Leukoc. Biol. 2020;108:17–41. doi: 10.1002/JLB.3COVR0520-272R. - DOI - PMC - PubMed
    1. Liao M., Liu Y., Yuan J., Wen Y., Xu G., Zhao J., Cheng L., Li J., Wang X., Wang F., et al. Single-cell landscape of bronchoalveolar immune cells in patients with COVID-19. Nat. Med. 2020;26:842–844. doi: 10.1038/s41591-020-0901-9. - DOI - PubMed
    1. Hoffmann M., Kleine-Weber H., Schroeder S., Krüger N., Herrler T., Erichsen S., Schiergens T.S., Herrler G., Wu N.-H., Nitsche A., et al. SARS-CoV-2 Cell Entry Depends on ACE2 and TMPRSS2 and Is Blocked by a Clinically Proven Protease Inhibitor. Cell. 2020;181 doi: 10.1016/j.cell.2020.02.052. - DOI - PMC - PubMed
    1. Wu K., Chen L., Peng G., Zhou W., Pennell C.A., Mansky L.M., Geraghty R.J., Li F. A Virus-Binding Hot Spot on Human Angiotensin-Converting Enzyme 2 Is Critical for Binding of Two Different Coronaviruses. J. Virol. 2011;85:5331–5337. doi: 10.1128/JVI.02274-10. - DOI - PMC - PubMed
    1. Jia H.P., Look D.C., Shi L., Hickey M., Pewe L., Netland J., Farzan M., Wohlford-Lenane C., Perlman S., McCray P.B., Jr. ACE2 Receptor Expression and Severe Acute Respiratory Syndrome Coronavirus Infection Depend on Differentiation of Human Airway Epithelia. J. Virol. 2005;79:14614–14621. doi: 10.1128/JVI.79.23.14614-14621.2005. - DOI - PMC - PubMed

Publication types