. 2020 Oct 29;9(11):369.
doi: 10.3390/biology9110369.

TLR9 Binding to Beclin 1 and Mitochondrial SIRT3 by a Sodium-Glucose Co-Transporter 2 Inhibitor Protects the Heart from Doxorubicin Toxicity

Affiliations

TLR9 Binding to Beclin 1 and Mitochondrial SIRT3 by a Sodium-Glucose Co-Transporter 2 Inhibitor Protects the Heart from Doxorubicin Toxicity

Chao-Yung Wang et al. Biology (Basel). .

Abstract

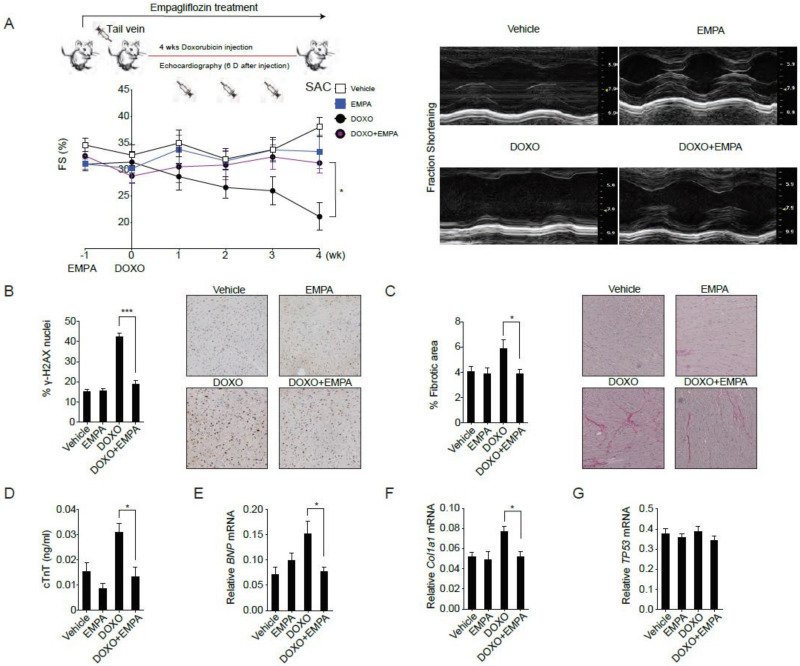
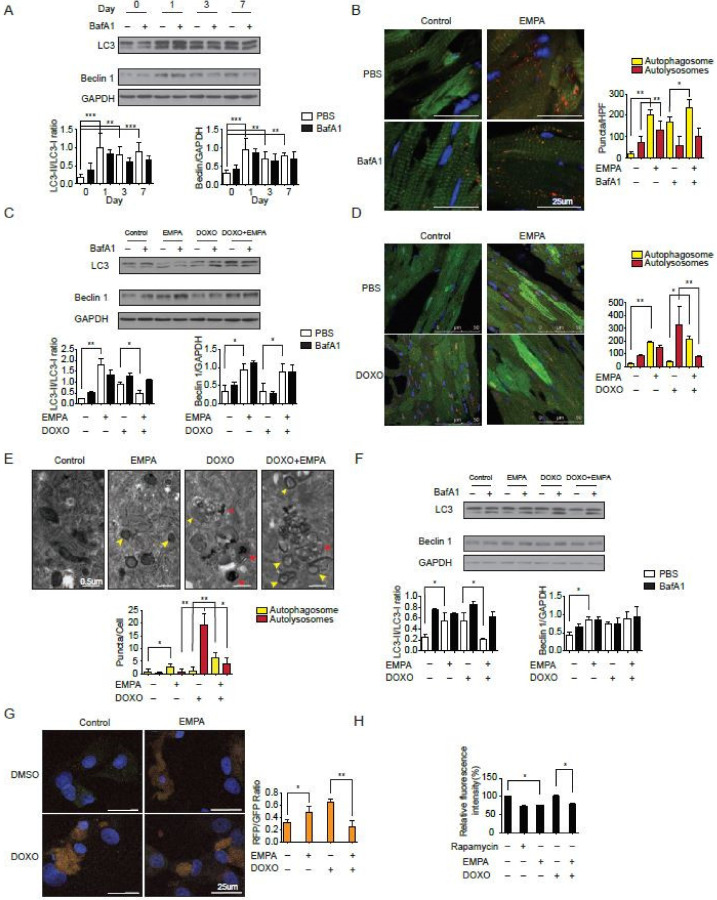
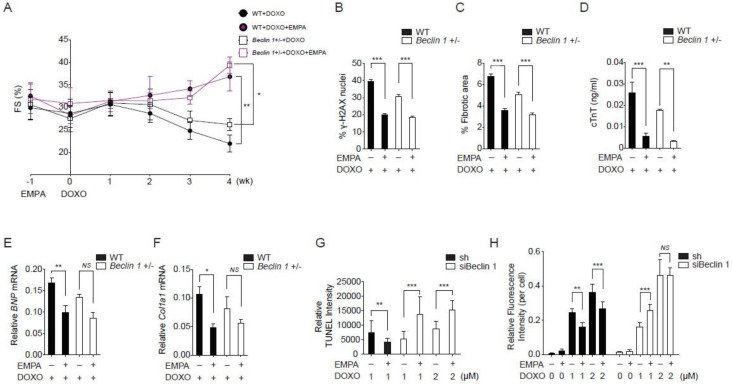
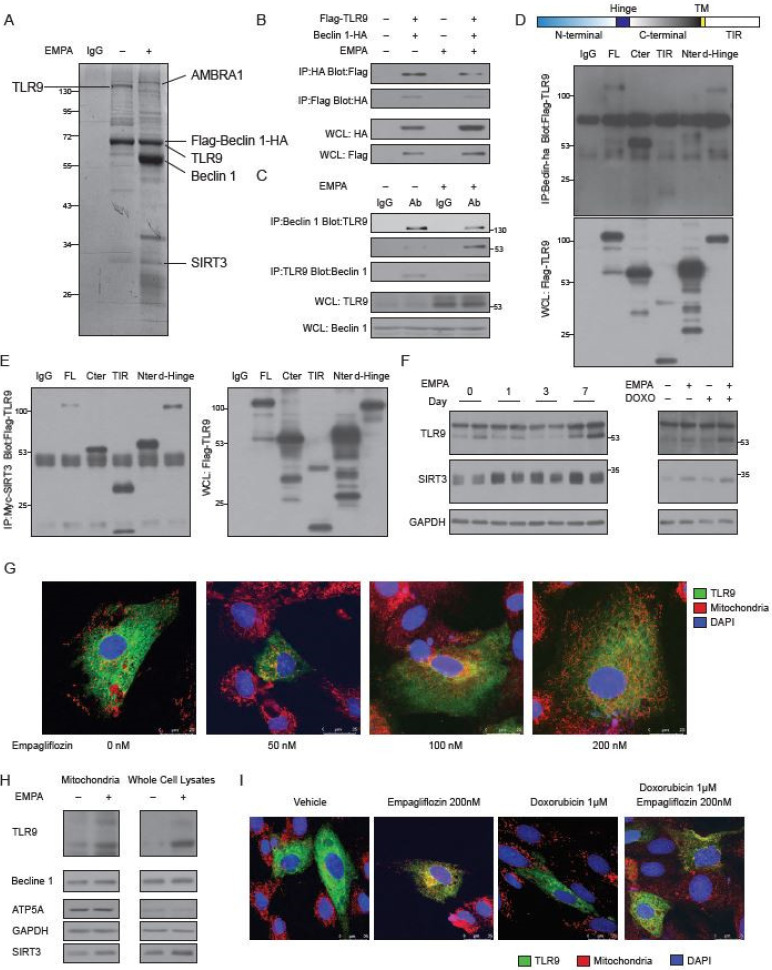
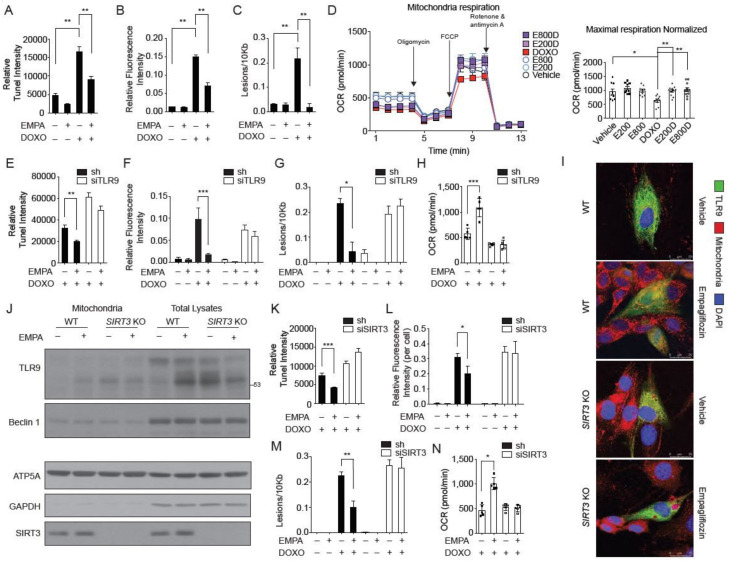
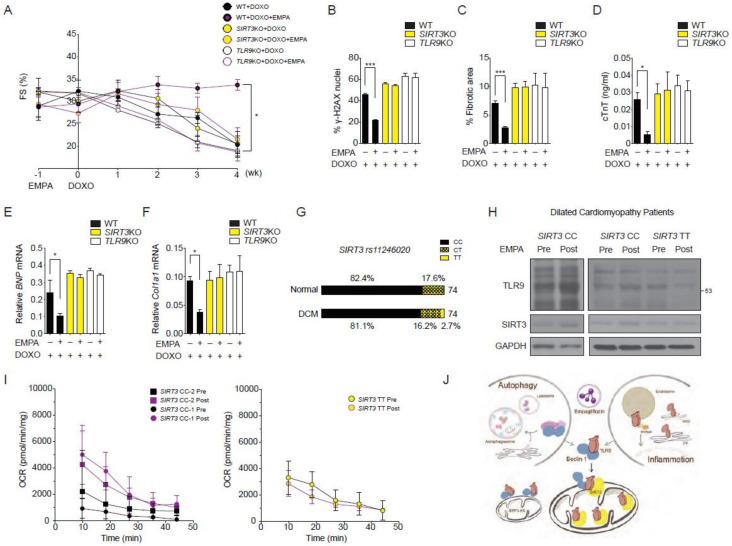
Large cardiovascular outcome trials have reported favorable effects of sodium-glucose co-transporter 2 (SGLT2) inhibitors on heart failure. To study the potential mechanism of the SGLT2 inhibition in heart failure, we used the murine doxorubicin-induced cardiomyopathy model and identified the toll-like receptor 9 (TLR9), NAD-dependent deacetylase sirtuin-3 (SIRT3), and Beclin 1, acting in a complex together in response to empagliflozin treatment. The interactions and implications in mitochondrial function were evaluated with TLR9 deficient, SIRT3 deficient, Beclin 1 haplodeficient, and autophagy reporter mice and confirmed in a patient with SIRT3 point mutation and reduced enzymatic activity. The SGLT2 inhibitor, empagliflozin, protects the heart from doxorubicin cardiomyopathy in mice, by acting through a novel Beclin 1-toll-like receptor (TLR) 9-sirtuin-(SIRT) 3 axis. TLR9 and SIRT3 were both essential for the protective effects of empagliflozin. The dilated cardiomyopathy patient with SIRT3 point mutation and reduced enzymatic activity is associated with reduced TLR9 activation and the absence of mitochondrial responses in the heart after the SGLT2 inhibitor treatment. Our data indicate a dynamic communication between autophagy and Beclin 1-TLR9-SIRT3 complexes in the mitochondria in response to empagliflozin that may serve as a potential treatment strategy for heart failure.

Keywords: Beclin 1; SGLT2 inhibitor; SIRT3; TLR9; doxorubicin; empagliflozin; heart failure.


Conflict of interest statement

The authors declare no conflict of interest.

Figures

Figure 1
Figure 1
Sodium-glucose co-transporter 2 inhibitor protects against doxorubicin-induced cardiotoxicity. (A) C57BL/6 mice were fed with empagliflozin starting from −1 week before weekly intraperitoneal doxorubicin injections for 4 weeks. Left ventricular function determined by m-mode echocardiography at the indicated time points (n = 10 for the vehicle or empagliflozin fed mice, 12 for the doxorubicin injection or doxorubicin injection with empagliflozin fed mice. * p < 0.05, data were analyzed by two-way analysis of variance (ANOVA) with Tukey post hoc analysis). Right panel: Representative echocardiograms from mice fed with vehicle or empagliflozin and injected with or without doxorubicin. (BG) Mice were sacrificed (SAC) immediately following the fourth injection at week 4. (B) Phosphorylation of H2A histone family member X (γ-H2AX) staining of left ventricular sections with representative images and quantifications, *** p < 0.001. (C) Picrosirius red staining with representative images and quantification, * p < 0.05. (D) Serum cardiac troponin-T, * p < 0.05. (E) BNP mRNA, * p < 0.05. (F) Col1a1 mRNA, * p < 0.05. (G) TP53 mRNA. (n = 10 for the Vehicle or EMPA, 12 for the DOXO or DOXO + EMPA, data were analyzed by one-way ANOVA with Tukey post hoc analysis). Data are represented by mean ± s.e.m. (EMPA, empagliflozin; DOXO, doxorubicin; DOXO + EMPA, doxorubicin and empagliflozin; FS, fraction shortening).
Figure 2
Figure 2
Sodium-glucose co-transporter 2 inhibition increases the autophagic flux in mice hearts. (A) Temporal changes in LC3-II/I ratio and Beclin 1 protein abundances after empagliflozin feedings. Hearts were analyzed at different time points after intraperitoneal injection of 1.5 mg/kg BafA1 or normal saline for 2 h (n = 3 per group. *** p < 0.001, ** p < 0.01, data were analyzed by one-way analysis of variance (ANOVA) with Dunnett post hoc analysis). (B) Representative fluorescence images of heart sections from CAG–RFP-EGFP–LC3 transgenic mice fed with 7-day empagliflozin and injected with BafA1 or normal saline for 2 h. Quantification of autophagosomes (yellow puncta) and autolysosomes (red puncta) numbers (n = 6 mice per group and 10 slices per one mice, ** p < 0.01, * p < 0.05, data were analyzed by one-way ANOVA with Tukey post hoc analysis). (C) Changes in LC3-II/I ratio and Beclin 1 protein abundances after 7-day empagliflozin feedings and 1-dose intravenous doxorubicin injection (5 mg/kg) for 24 h. Hearts were analyzed after intraperitoneal injection of 1.5 mg/kg BafA1 or normal saline for 2 h (n = 4 hearts per group with six microscopic fields (14,000 μm2) per heart section analyzed. ** p < 0.01, * p < 0.05, data were analyzed by one-way ANOVA with Tukey post hoc analysis). (D) Representative fluorescence images of heart sections from CAG–RFP-EGFP–LC3 transgenic mice injected with doxorubicin (5 mg/kg) and fed with 7-day empagliflozin. Quantification of autophagosomes (yellow puncta) and autolysosomes (red puncta) numbers (n = 6 per group. ** p < 0.01, * p < 0.05, data were analyzed by one-way ANOVA with Tukey post hoc analysis). (E) Representative transmission electron microscopy images of cardiomyocytes treated with doxorubicin and empagliflozin. Autophagosomes have two parallel membrane layers separated by a relatively narrower electron-translucent cleft. Autolysosomes have only one membrane and frequently contain electron dense cytoplasmic materials. Quantification of autophagosomes (yellow arrow) and autolysosomes (red arrow) numbers (n = 6. * p < 0.05, ** p < 0.01, data were analyzed by one-way ANOVA with Tukey post hoc analysis). (F) Changes in LC3-II/I ratio and Beclin 1 protein abundances in cardiomyocytes treated with doxorubicin and empagliflozin (n = 4 per group. * p < 0.05, data were analyzed by one-way ANOVA with Tukey post hoc analysis). (G) Changes in autophagy flux measured by RFP-GFP-LC3 tandem fluorescent-tagged LC3 in cardiomyocytes treated with doxorubicin and empagliflozin (n = 4 per group. * p < 0.05, ** p < 0.01, data were analyzed by one-way ANOVA with Tukey post hoc analysis). (H) Long-lived protein degradation assay in cardiomyocytes (n = 4 per group. * p < 0.05, data were analyzed by one-way ANOVA with Tukey post hoc analysis). Data are represented by mean ± s.e.m. (BafA1, bafilomycin A1; CAG-RFP-EGFP-LC3, CAG promoter-red fluorescent protein (RFP)–green fluorescent protein-LC3).
Figure 3
Figure 3
Empagliflozin further protects doxorubicin cardiotoxicity in Beclin 1 deficient mice. (A) Left ventricular function determined by m-mode echocardiography at the indicated time points (n = 7 per group. * p < 0.05, ** p < 0.01, data were analyzed by two-way analysis of variance (ANOVA) with Tukey post hoc analysis). (B–F) Mice were sacrificed immediately following the fourth injection at week 4. (B) Phosphorylation of H2A histone family member X (γ-H2AX) staining of left ventricular sections, *** p < 0.001. (C) Picrosirius red staining, *** p < 0.001. (D) Serum cardiac troponin-T, *** p < 0.001, ** p < 0.01. (E) BNP mRNA, ** p < 0.01, p = 0.06 for Beclin 1+/− + DOXO vs. Beclin 1+/− + DOXO/EMPA. (F) Col1a1 mRNA, * p < 0.05, NS, not significant (n = 7 per group, data were analyzed by one-way ANOVA with Tukey post hoc analysis). (G) TUNEL staining of the neonatal cardiomyocytes. (n = 4, ** p < 0.01, *** p < 0.001, data were analyzed by the Kruskal-Wallis one-way ANOVA). (H) Cellular ROS detected by H2DCFDA fluorescence (n = 4, ** p < 0.01, *** p < 0.001, NS, not significant, data were analyzed by the two-way ANOVA with Tukey post hoc analysis). Data are represented by mean ± s.e.m. (WT, wild-type; EMPA, empagliflozin; DOXO, doxorubicin; ROS, reactive oxygen species).
Figure 4
Figure 4
Identification of TLR9 and SIRT3 as major empagliflozin-regulated components of the Beclin 1 complexes. (A) SYPRO Ruby staining of affinity-purified Beclin 1 complexes from Flag-Beclin 1-HA overexpressed 293 cell lines treated with vehicles (lane 2) or empagliflozin (lane 3). Specific Beclin 1-interacting protein bands were analyzed by mass spectrometry. (B) Coimmunoprecipitation of Beclin 1 with TLR9 or TLR9 with Beclin 1 from 293 cells with or without empagliflozin (200 nM) treatment. Western blot analysis of 293 whole-cell extracts transfected with Flag-TLR9 and Beclin 1-HA and immunoprecipitated with Beclin 1-HA (lane 1) or Flag-TLR9 (lane 2). (C) Beclin 1 interaction with TLR9 in mice hearts and regulated by empagliflozin. WT mice were fed with or without empagliflozin for 7 days. Heart lysates were immunoprecipitated with Beclin 1 or TLR9 antibody recognizing full-length 130 kDa or cleaved form 53 kDa and analyzed by western blot. (D) Protein domains involved in the Beclin-TLR9 interaction. Flag-tagged TLR9 and its indicated fragments (FL: full length TLR9; Cter: C-terminal TLR9; TIR: TIR domain of the TLR9; Nter: N-terminal TLR9; d-Hinge: full length TLR9 without Hinge domain) were coexpressed in 293 cells with Beclin 1-HA, and anti-HA immunoprecipitates were analyzed by anti-Flag immunoblotting. (E) Protein domains involved in the TLR9-SIRT3 interaction. Flag-tagged TLR9 and its indicated fragments (FL: full length TLR9; Cter: C-terminal TLR9; TIR: TIR domain of the TLR9; Nter: N-terminal TLR9; d-Hinge: full length TLR9 without Hinge domain) were coexpressed in 293 cells with Myc-Sirt3, and anti-Myc immunoprecipitates were analyzed by anti-Flag immunoblotting. (F) Left: Temporal changes in TLR9 and SIRT3 protein abundances after empagliflozin feedings. Hearts were analyzed at different time points after empagliflozin feedings. Right: Western blot analysis of changes in TLR9 and SIRT3 protein abundances after intravenous doxorubicin injections (5 mg/kg) and 7-day empagliflozin feedings. (G) Images of AC16 human cardiomyocytes stained for mitochondria (red), nucleus (blue), and overexpressed GFP-TLR9 (green). Cells were treated with indicated doses of empagliflozin before imaging. Increases of the orange signals (green + red) indicate the increases of mitochondrial localization of TLR9. (H) Western blot analysis of the mitochondria and whole-cell lysates from AC16 human cardiomyocytes treated with vehicle or empagliflozin (200 nM). (I) Images of AC16 human cardiomyocytes stained for mitochondria (red), nucleus (blue), and overexpressed GFP-TLR9 (green). Cells were treated with indicated doses of empagliflozin before imaging.
Figure 5
Figure 5
SIRT3 is indispensable for the mitochondrial TLR9 trafficking and function by empagliflozin. (A) TUNEL staining of the neonatal cardiomyocytes treated with empagliflozin (200 nM) and doxorubicin (1 μM) for 24 h (n = 6, ** p < 0.01, data were analyzed by the Kruskal-Wallis one-way ANOVA). (B) Cellular ROS detected by H2DCFDA fluorescence (n = 4, ** p < 0.01, data were analyzed by the one-way ANOVA with Tukey post hoc analysis). (C) Mitochondrial DNA damages (n = 4, ** p < 0.01, data were analyzed by the one-way ANOVA with Tukey post hoc analysis). (D) Mitochondrial respiration analyzed by Seahorse instruments. Maximal respiration normalized by cell numbers (n = 4, * p < 0.05, ** p < 0.01, data were analyzed by the one-way ANOVA with Tukey post hoc analysis). E800D and E200D = empagliflozin 800 nM or 200 nM with doxorubicin 1 μM; E800 and E200 = empagliflozin 800 nm or 200 nM. (E) TUNEL staining of the neonatal cardiomyocytes transfected with TLR9 siRNA or sh control (n = 4, ** p < 0.01, data were analyzed by the Kruskal-Wallis one-way ANOVA). (F) Cellular ROS detected by H2DCFDA fluorescence (n = 4, *** p < 0.001, data were analyzed by the two-way ANOVA with Tukey post hoc analysis). (G) Mitochondrial DNA damages. (n = 4, * p < 0.05, data were analyzed by the two-way ANOVA with Tukey post hoc analysis). (H) Maximal respiration normalized by cell numbers (n = 4, ** p < 0.01, data were analyzed by the one-way ANOVA with Tukey post hoc analysis). (I) Images of WT and SIRT3 KO cells stained for mitochondria (red), nucleus (blue), and overexpressed GFP-TLR9 (green). Cells were treated with empagliflozin (200 nM) before imaging. (J) Western blot analysis of the mitochondria and total lysates from hearts of WT and SIRT3 KO mice fed with or without empagliflozin. (K) TUNEL staining of the neonatal cardiomyocytes transfected with SIRT3 siRNA or sh control (n = 4, *** p < 0.001, data were analyzed by the Kruskal-Wallis one-way ANOVA). (L) Cellular ROS detected by H2DCFDA fluorescence (n = 4, * p < 0.05, data were analyzed by the two-way ANOVA with Tukey post hoc analysis). (M) mitochondrial DNA damages assay with empagliflozin (200 nM) and doxorubicin (1 μM). (n = 6, ** p < 0.01, data were analyzed by the two-way ANOVA with Tukey post hoc analysis). (N) Maximal respiration analyzed by Seahorse instruments (n = 4, * p < 0.05, data were analyzed by the one-way ANOVA with Tukey post hoc analysis). Data are represented by mean ± s.e.m. (EMPA, empagliflozin; DOXO, doxorubicin; OCR, oxygen consumption rate; ROS, reactive oxygen species; WT, wild-type; SIRT3 KO, SIRT3 knockout).
Figure 6
Figure 6
Reduction of empagliflozin effects in SIRT3 or TLR9 knockout mice and in humans with SIRT3 point mutation with reduced enzymatic activity. (A) Left ventricular function determined by m-mode echocardiography at the indicated time points (n = 7 per group. * p < 0.05 for WT + DOXO + EMPA vs. SIRT3KO + DOXO + EMPA or TLR9KO + DOXO + EMPA, data were analyzed by two-way analysis of variance (ANOVA) with Tukey post hoc analysis). (BF) Mice were sacrificed at 4 weeks after doxorubicin injection. (B) Phosphorylation of H2A histone family member X (γ-H2AX) staining of left ventricular sections, *** p < 0.001. (C) Picrosirius red staining, *** p < 0.001. (D) Serum cardiac troponin-T, * p < 0.05. (E) BNP mRNA, * p < 0.05. (F) Col1a1 mRNA, * p < 0.05 (n = 7 per group, data were analyzed by one-way ANOVA with Tukey post hoc analysis). (G) Graphic representation of the SNP rs11246020 frequency in the prospective cohort of patients with DCM or control patients. CC corresponds to the normal alleles, CT to SNP heterozygosity, and TT to SNP homozygosity. (H) Western blots for TLR9 and SIRT3 performed on the cardiac biopsies before and after 28 days of empagliflozin treatment from patients with DCM (2 with SIRT3 rs11246020 CC and 1 with TT genotypes). (I) Basal mitochondrial respiration performed on the cardiac biopsies before and after 28 days of empagliflozin treatment from patients with DCM (2 with SIRT3 rs11246020 CC and 1 with TT genotypes). (J) Schematic of the empagliflozin promotes binding of the Beclin 1-TLR9 and trafficking to mitochondria toward SIRT3. In SIRT3 knockout mice, empagliflozin cannot enhance the trafficking of TLR9 toward mitochondria. Data are represented by mean ± s.e.m. (WT, wild-type, EMPA, empagliflozin; DOXO, doxorubicin, DCM, dilated cardiomyopathy).

Similar articles

Cited by

References

    1. Green J.B., Bethel M.A., Armstrong P.W., Buse J.B., Engel S.S., Garg J., Josse R.G., Kaufman K.D., Koglin J., Korn S., et al. Effect of Sitagliptin on Cardiovascular Outcomes in Type 2 Diabetes. N. Engl. J. Med. 2015;373:232–242. doi: 10.1056/NEJMoa1501352. - DOI - PubMed
    1. Castagno D., Baird-Gunning J., Jhund P.S., Zoccai G.B., Macdonald M.R., Petrie M.C., Gaita F., McMurray J.J. Intensive glycemic control has no impact on the risk of heart failure in type 2 diabetic patients: Evidence from a 37,229 patient meta-analysis. Am. Heart J. 2011;162:938.e2–948.e2. doi: 10.1016/j.ahj.2011.07.030. - DOI - PubMed
    1. Boussageon R., Bejan-Angoulvant T., Saadatian-Elahi M., Lafont S., Bergeonneau C., Kassaï B., Erpeldinger S., Wright J.M., Gueyffier F., Cornu C. Effect of intensive glucose lowering treatment on all cause mortality, cardiovascular death, and microvascular events in type 2 diabetes: Meta-analysis of randomised controlled trials. BMJ. 2011;343:d4169. doi: 10.1136/bmj.d4169. - DOI - PMC - PubMed
    1. Komajda M., McMurray J.J., Beck-Nielsen H., Gomis R., Hanefeld M., Pocock S.J., Curtis P.S., Jones N.P., Home P.D. Heart failure events with rosiglitazone in type 2 diabetes: Data from the RECORD clinical trial. Eur. Heart J. 2010;31:824–831. doi: 10.1093/eurheartj/ehp604. - DOI - PMC - PubMed
    1. Jia G., Hill M.A., Sowers J.R. Diabetic Cardiomyopathy: An Update of Mechanisms Contributing to This Clinical Entity. Circ. Res. 2018;122:624–638. doi: 10.1161/CIRCRESAHA.117.311586. - DOI - PMC - PubMed