. 2020 Oct;30(10):103113.
doi: 10.1063/5.0015533.

Assessing observability of chaotic systems using Delay Differential Analysis

Affiliations

Assessing observability of chaotic systems using Delay Differential Analysis

Christopher E Gonzalez et al. Chaos. 2020 Oct.

Abstract

Observability can determine which recorded variables of a given system are optimal for discriminating its different states. Quantifying observability requires knowledge of the equations governing the dynamics. These equations are often unknown when experimental data are considered. Consequently, we propose an approach for numerically assessing observability using Delay Differential Analysis (DDA). Given a time series, DDA uses a delay differential equation for approximating the measured data. The lower the least squares error between the predicted and recorded data, the higher the observability. We thus rank the variables of several chaotic systems according to their corresponding least square error to assess observability. The performance of our approach is evaluated by comparison with the ranking provided by the symbolic observability coefficients as well as with two other data-based approaches using reservoir computing and singular value decomposition of the reconstructed space. We investigate the robustness of our approach against noise contamination.


Figures

FIG. 1.
FIG. 1.
Differential embedding induced by each of the three variables of the Hindmarsh–Rose system.
FIG. 2.
FIG. 2.
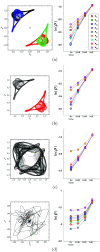
Chaotic attractor produced by the 9D Lorenz system (18). (a) R=14.22, (b) R=14.30, (c) R=15.10, and (d) R=45.00. Other parameter values: a=0.5 and σ=0.5. When there are co-existing attractors, they are plotted in different colors in the plane projections of the state space.
FIG. 3.
FIG. 3.
Error ρX vs a decreasing signal-to-noise ratio for some of the different systems investigated in this paper. (a) The Rössler 76 system, (b) the Lorenz 63 system, (c) the Cord system, (d) the Hindmarsh–Rose system, (e) the Hénon–Heiles system, and (f) the Chua system.

References

    1. Liu Y.-Y., Slotine J.-J., and Barabási A.-L., “Observability of complex systems,” Proc. Natl. Acad. Sci. U.S.A. 110, 2460–2465 (2013). 10.1073/pnas.1215508110 - DOI - PMC - PubMed
    1. Wang B., Gao L., Gao Y., Deng Y., and Wang Y., “Controllability and observability analysis for vertex domination centrality in directed networks,” Sci. Rep. 4, 5399 (2014). 10.1038/srep05399 - DOI - PMC - PubMed
    1. Whalen A. J., Brennan S. N., Sauer T. D., and Schiff S. J., “Observability and controllability of nonlinear networks: The role of symmetry,” Phys. Rev. X 5, 011005 (2015).10.1103/PhysRevX.5.011005 - DOI - PMC - PubMed
    1. Leitold D., Vathy-Fogarassy Á., and Abonyi J., “Controllability and observability in complex networks—The effect of connection types,” Sci. Rep. 7, 151 (2017). 10.1038/s41598-017-00160-5 - DOI - PMC - PubMed
    1. Haber A., Molnar F., and Motter A. E., “State observation and sensor selection for nonlinear networks,” IEEE Trans. Control Netw. Syst. 5, 694–708 (2018). 10.1109/TCNS.2017.2728201 - DOI - PMC - PubMed