

Influence of socio-economic, demographic and climate factors on the regional distribution of dengue in the United States and Mexico
- PMID: 33138827
- PMCID: PMC7607660
- DOI: 10.1186/s12942-020-00241-1
Influence of socio-economic, demographic and climate factors on the regional distribution of dengue in the United States and Mexico
Abstract
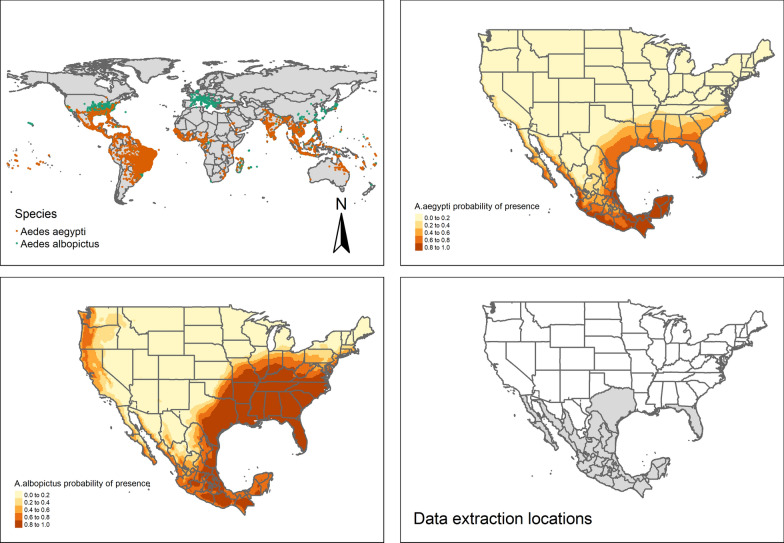
Background: This study examines the impact of climate, socio-economic and demographic factors on the incidence of dengue in regions of the United States and Mexico. We select factors shown to predict dengue at a local level and test whether the association can be generalized to the regional or state level. In addition, we assess how different indicators perform compared to per capita gross domestic product (GDP), an indicator that is commonly used to predict the future distribution of dengue.
Methods: A unique spatial-temporal dataset was created by collating information from a variety of data sources to perform empirical analyses at the regional level. Relevant regions for the analysis were selected based on their receptivity and vulnerability to dengue. A conceptual framework was elaborated to guide variable selection. The relationship between the incidence of dengue and the climate, socio-economic and demographic factors was modelled via a Generalized Additive Model (GAM), which also accounted for the spatial and temporal auto-correlation.
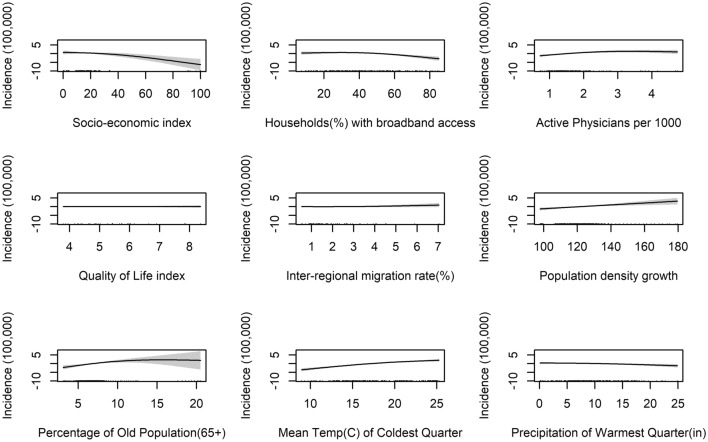
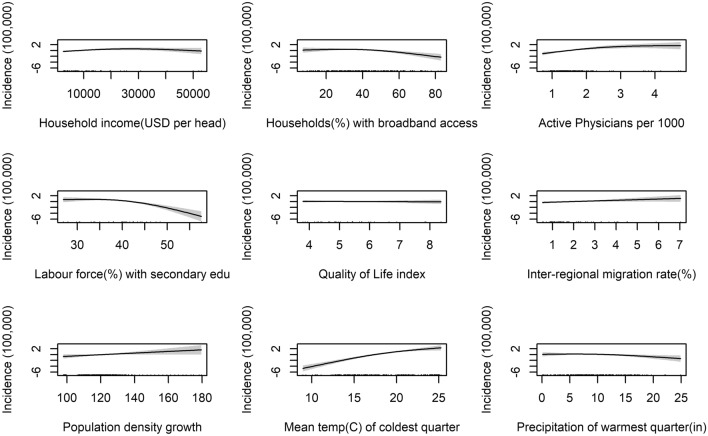
Results: The socio-economic indicator (representing household income, education of the labour force, life expectancy at birth, and housing overcrowding), as well as more extensive access to broadband are associated with a drop in the incidence of dengue; by contrast, population growth and inter-regional migration are associated with higher incidence, after taking climate into account. An ageing population is also a predictor of higher incidence, but the relationship is concave and flattens at high rates. The rate of active physicians is associated with higher incidence, most likely because of more accurate reporting. If focusing on Mexico only, results remain broadly similar, however, workforce education was a better predictor of a drop in the incidence of dengue than household income.
Conclusions: Two lessons can be drawn from this study: first, while higher GDP is generally associated with a drop in the incidence of dengue, a more granular analysis reveals that the crucial factors are a rise in education (with fewer jobs in the primary sector) and better access to information or technological infrastructure. Secondly, factors that were shown to have an impact of dengue at the local level are also good predictors at the regional level. These indices may help us better understand factors responsible for the global distribution of dengue and also, given a warming climate, may help us to better predict vulnerable populations on a larger scale.
Keywords: Climate-change; Dengue; GAM; GDP; Global-warming; Mosquito-borne; Socio-economic; Vector-borne-diseases.
Conflict of interest statement
No competing interests.
Figures
Similar articles
-
Socio-economic and Climate Factors Associated with Dengue Fever Spatial Heterogeneity: A Worked Example in New Caledonia.PLoS Negl Trop Dis. 2015 Dec 1;9(12):e0004211. doi: 10.1371/journal.pntd.0004211. eCollection 2015 Dec. PLoS Negl Trop Dis. 2015. PMID: 26624008 Free PMC article.
-
Aedes (Stegomyia) aegypti in the continental United States: a vector at the cool margin of its geographic range.J Med Entomol. 2013 May;50(3):467-78. doi: 10.1603/me12245. J Med Entomol. 2013. PMID: 23802440
-
Ecological, Social, and Other Environmental Determinants of Dengue Vector Abundance in Urban and Rural Areas of Northeastern Thailand.Int J Environ Res Public Health. 2021 Jun 2;18(11):5971. doi: 10.3390/ijerph18115971. Int J Environ Res Public Health. 2021. PMID: 34199508 Free PMC article.
-
The Minderoo-Monaco Commission on Plastics and Human Health.Ann Glob Health. 2023 Mar 21;89(1):23. doi: 10.5334/aogh.4056. eCollection 2023. Ann Glob Health. 2023. PMID: 36969097 Free PMC article. Review.
-
Projecting the future of dengue under climate change scenarios: Progress, uncertainties and research needs.PLoS Negl Trop Dis. 2020 Mar 2;14(3):e0008118. doi: 10.1371/journal.pntd.0008118. eCollection 2020 Mar. PLoS Negl Trop Dis. 2020. PMID: 32119666 Free PMC article.
Cited by
-
Annual global dengue dynamics are related to multi-source factors revealed by a machine learning prediction analysis.PLoS Negl Trop Dis. 2025 Jun 25;19(6):e0013232. doi: 10.1371/journal.pntd.0013232. eCollection 2025 Jun. PLoS Negl Trop Dis. 2025. PMID: 40561184 Free PMC article.
-
Associations between Dengue Incidence, Ecological Factors, and Anthropogenic Factors in Singapore.Viruses. 2023 Sep 13;15(9):1917. doi: 10.3390/v15091917. Viruses. 2023. PMID: 37766323 Free PMC article.
-
Geographically weighted regression analysis for nonnegative continuous outcomes: An application to Taiwan dengue data.PLoS One. 2024 Dec 12;19(12):e0315327. doi: 10.1371/journal.pone.0315327. eCollection 2024. PLoS One. 2024. PMID: 39666638 Free PMC article.
-
Introduction, establishment, and distribution of Aedes aegypti and dengue in a temperate capital of Brazil: a retrospective surveillance-based study.Lancet Reg Health Am. 2025 Jun 23;48:101153. doi: 10.1016/j.lana.2025.101153. eCollection 2025 Aug. Lancet Reg Health Am. 2025. PMID: 40620879 Free PMC article.
-
Projecting temperature-related dengue burden in the Philippines under various socioeconomic pathway scenarios.Front Public Health. 2024 Dec 23;12:1420457. doi: 10.3389/fpubh.2024.1420457. eCollection 2024. Front Public Health. 2024. PMID: 39764196 Free PMC article.
References
-
- Murray NEA, Quam MB, Wilder-Smith A. Epidemiology of dengue: past, present and future prospects. Clin Epidemiol. 2013;5:299. https://www.dovepress.com/getfile.php?fileID=17199. - PMC - PubMed
-
- Anosike JC, Nwoke BE, Okere AN, Oku EE, Asor JE, Emmy-Egbe IO, et al. Epidemiology of tree-hole breeding mosquitoes in the tropical rainforest of Imo state, south-east Nigeria. Ann Agric Environ Med. 2007;14:31–8. - PubMed
-
- WHO. Dengue and severe dengue. 2020. https://www.who.int/news-room/fact-sheets/detail/dengue-and-severe-dengue.
-
- WHO. Immunization, vaccines and biologicals. 2017; 2018. http://www.who.int/immunization/research/development/dengue_vaccines/en/.
Publication types
MeSH terms
LinkOut - more resources
Full Text Sources
Medical
