. 2020 Nov 2;11(1):462.
doi: 10.1186/s13287-020-01975-2.

Human adipose mesenchymal stem cells modulate myeloid cells toward an anti-inflammatory and reparative phenotype: role of IL-6 and PGE2

Affiliations

Human adipose mesenchymal stem cells modulate myeloid cells toward an anti-inflammatory and reparative phenotype: role of IL-6 and PGE2

Maitane Ortiz-Virumbrales et al. Stem Cell Res Ther. .

Abstract

Background: Mesenchymal stem cells (MSCs) activate the endogenous immune regulatory system, inducing a therapeutic effect in recipients. MSCs have demonstrated the ability to modulate the differentiation of myeloid cells toward a phagocytic and anti-inflammatory profile. Allogeneic, adipose-derived MSCs (ASCs) have been investigated for the management of complex perianal fistula, with darvadstrocel being the first ASC therapy approved in Europe in March 2018. Additionally, ASCs are being explored as a potential treatment in other indications. Yet, despite these clinical advances, their mechanism of action is only partially understood.

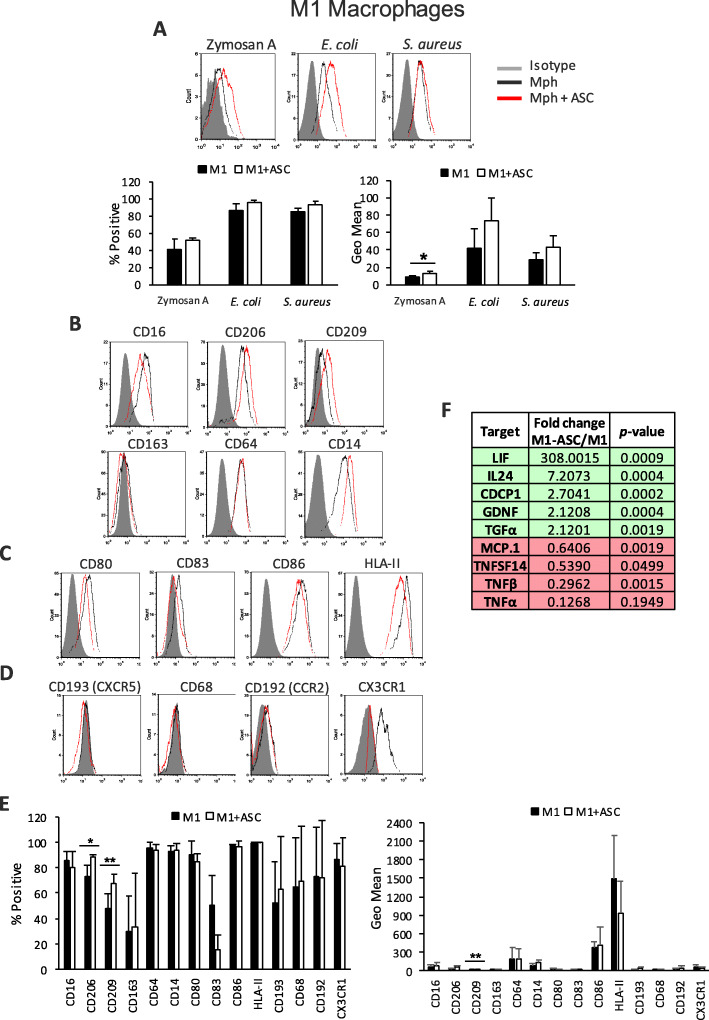
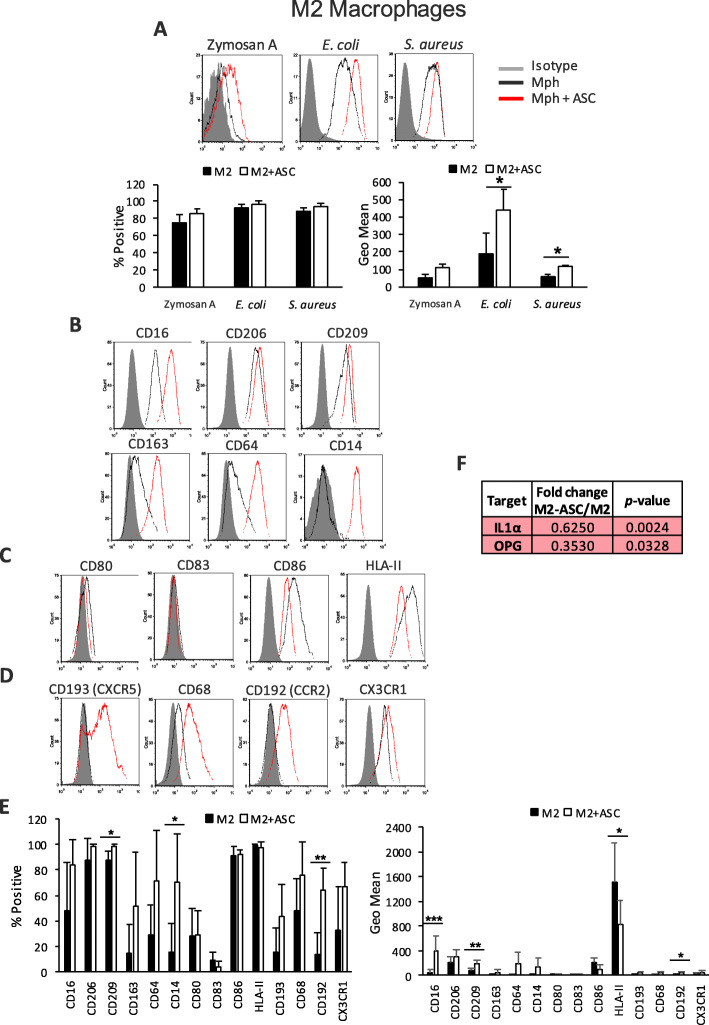
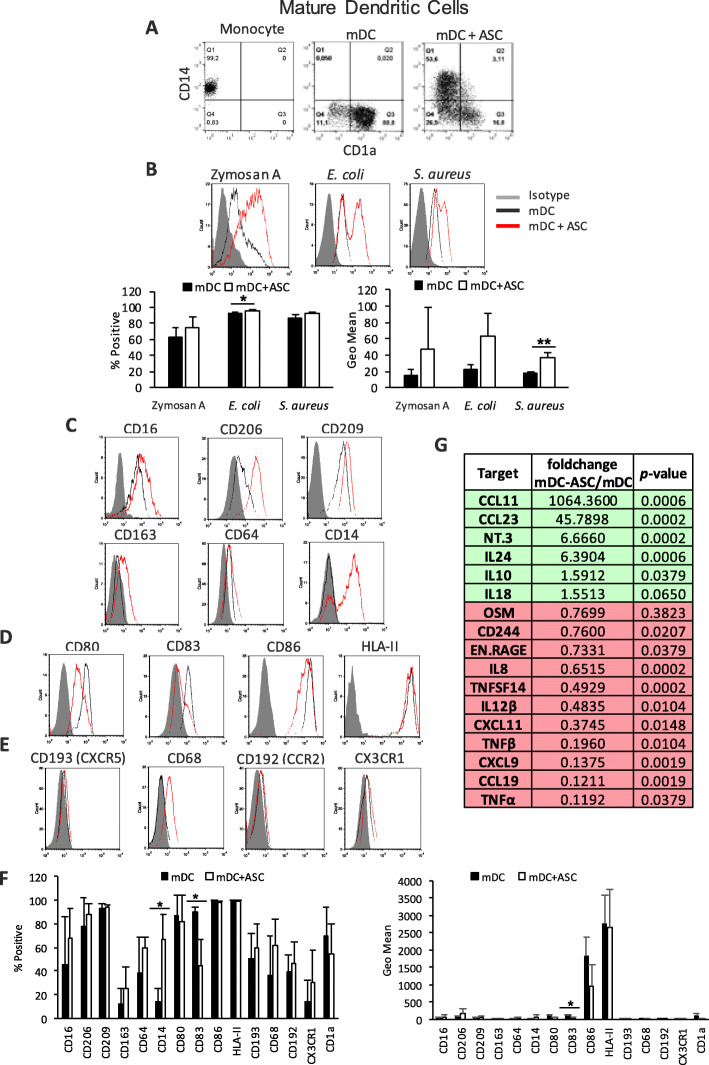
Methods: Freshly isolated human monocytes from the peripheral blood were differentiated in vitro toward M0 non-polarized macrophages (Mphs), M1 pro-inflammatory Mphs, M2 anti-inflammatory Mphs, or mature dendritic cells (mDCs) in the presence or absence of ASCs, in non-contact conditions. The phenotype and function of the differentiated myeloid populations were determined by flow cytometry, and their secretome was analyzed by OLINK technology. We also investigated the capacity of ASCs to modulate the phenotype and function of terminally differentiated M1 Mphs. The role of soluble factors interleukin (IL)-6 and prostaglandin E2 (PGE2) on the ability of ASCs to modulate myeloid cells was assessed using neutralization assays, CRISPR/Cas9 knock-down of cyclooxygenase 2 (COX-2), and ASC-conditioned medium assays using pro-inflammatory stimulus.

Results: Co-culture of monocytes in the presence of ASCs resulted in the polarization of Mphs and mDCs toward an anti-inflammatory and phagocytic phenotype. This was characterized by an increase in phagocytic receptors on the cell surface of Mphs (M0, M1, and M2) and mDCs, as well as modulation of chemokine receptors and reduced expression of pro-inflammatory, co-stimulatory molecules. ASCs also modulated the secretome of Mphs and mDCs, demonstrated by reduced expression of pro-inflammatory factors and increased expression of anti-inflammatory and reparative factors. Chemical inhibition of PGE2 with indomethacin abolished this modulatory effect, whereas treatment with a neutralizing anti-IL-6 antibody resulted in a partial abolishment. The knock-down of COX-2 in ASCs and the use of IL-1β-activated ASC-conditioned media confirmed the key role of PGE2 in ASC-mediated myeloid modulation. In our in vitro experimental settings, ASCs failed to modulate the phenotype and function of terminally polarized M1 Mphs.

Conclusions: The results demonstrate that ASCs are able to modulate the in vitro differentiation of myeloid cells toward an anti-inflammatory and reparative profile. This modulatory effect was mediated mainly by PGE2 and, to a lesser extent, IL-6.

Keywords: Adipose-derived mesenchymal stem cells; Anti-inflammatory; Dendritic cells; Interleukin 6; Macrophages; Monocytes; Prostaglandin E2.


Conflict of interest statement

All authors except WD are employees of Takeda.

MO-V, PM-C, AA-V, OdlR, and EL are inventors on patents owned by Takeda.

WD is a former employee of TiGenix and is an inventor on patents owned by Takeda.

Figures

Fig. 1
Fig. 1
Morphology changes of monocyte-derived populations by ASCs. a Transwell setting of ASC and monocyte co-cultures. b Bright-field microscopy pictures of Mphs or mDCs in the presence or absence of ASCs at × 20 magnification. c FSC/SSC analysis by flow cytometry of M0, M1, and M2 Mphs, and mDCs in the absence or presence of ASCs. d FSC-Height versus FSC-Area to select singlets on mDC population (left) and 7-AAD staining to exclude dead cells (right). Data are representative of at least four independent experiments. Numbers in c represent the percentage of the gated population in the total sample. ASC, adipose-derived mesenchymal stem cell; FSC, forward scatter; mDC, mature dendritic cell; Mph, macrophage; SSC, side scatter
Fig. 2
Fig. 2
Phenotypic and functional analysis of ASC-educated M0 Mphs. Flow cytometry analysis of a phagocytosis levels of Zymosan A, E. coli, or S. aureus particles labeled with pHrodo™. Average ± SEM of positive percentages and Geo Mean statistics are shown below; b surface expression of several phagocytic receptors; c surface expression of co-stimulatory molecules; d surface chemokine receptors, in M0 Mphs, in the presence or absence of ASCs; and e Average ± SEM of positive percentages and Geo Mean of the different surface markers. f OLINK analysis of the secretome of M0 Mphs alone, and M0 Mph and ASC co-cultures. Data are representative of at least three independent experiments. The table shows the fold change of NPX between M0 Mphs with ASCs and M0 Mphs alone, together with the p value for this calculation; green indicates the upregulation of targets, and red indicates the downregulation of targets; only statistically significant changes are shown (n = 4). *p < 0.05, **p < 0.01. ASC, adipose-derived mesenchymal stem cell; CCL, C-C motif chemokine; CCR, C-C motif chemokine receptor; CD, cluster of differentiation; CDCP, CUB domain-containing protein; CX3CR, CX3C chemokine receptor; CXCL, C-C-C motif chemokine; CXCR, C-X-C chemokine receptor; E. coli, Escherichia coli; GDNF, glial cell line-derived neurotrophic factor; HLA, human leukocyte antigen; IL, interleukin; IL10RB, IL-10 receptor subunit beta; LIF, leukemia inhibitory factor; MCP, monocyte chemotactic protein; MIP, macrophage inflammatory protein; Mph, macrophage; NGF, nerve growth factor; NPX, normalized protein expression; NT-3, neurotrophin-3; OSM, oncostatin-M; S. aureus, Staphylococcus aureus; TNFRSF, tumor necrosis factor receptor superfamily member; TNFSF, tumor necrosis factor ligand superfamily member
Fig. 3
Fig. 3
Phenotypic and functional analysis of ASC-educated M1 Mphs. Flow cytometry analysis of a phagocytosis levels of Zymosan A, E. coli, or S. aureus particles labeled with pHrodo™. Average ± SEM of positive percentages and Geo Mean statistics are shown below; b surface expression of several phagocytic receptors; c surface expression of co-stimulatory molecules; d surface chemokine receptors, in M1 Mphs, in the presence or absence of ASCs; and e Average ± SEM of positive percentages and Geo Mean of the different surface markers. f OLINK analysis of the secretome of M1 and ASC-M1 Mph co-cultures. Data are representative of at least three independent experiments. The table shows the fold change of NPX between M1 Mphs + ASCs and M1 alone, together with the p value for this calculation; green indicates the upregulation of targets, and red indicates the downregulation of targets; only statistically significant changes are shown (n = 4). *p < 0.05, **p < 0.01. ASC, adipose-derived mesenchymal stem cell; CCR, C-C motif chemokine receptor; CD, cluster of differentiation; CDCP, CUB domain-containing protein; CX3CR, CX3C chemokine receptor; CXCR, C-X-C chemokine receptor; E. coli, Escherichia coli; GDNF, glial cell line-derived neurotrophic factor; HLA, human leukocyte antigen; IL, interleukin; LIF, leukemia inhibitory factor; MCP, monocyte chemotactic protein; Mph, macrophage; NPX, normalized protein expression; S. aureus, Staphylococcus aureus; TGF, transforming growth factor; TNF, tumor necrosis factor; TNFSF, tumor necrosis factor ligand superfamily member
Fig. 4
Fig. 4
Phenotypic and functional analysis of ASC-educated M2 Mphs. Flow cytometry analysis of a phagocytosis levels of Zymosan A, E. coli, or S. aureus particles labeled with pHrodo™. Average ± SEM of positive percentages and Geo Mean statistics are shown below; b surface expression of several phagocytic receptors; c surface expression of co-stimulatory molecules; d surface chemokine receptors, in M2 Mphs, in the presence or absence of ASCs; and e Average ± SEM of positive percentages and Geo Mean of the different surface markers. f OLINK analysis of the secretome of M2 Mphs alone and ASC-M2 Mphs co-cultures. Data are representative of at least four independent experiments. The table shows the fold change of NPX between ASC-M2 Mphs and M1 alone, together with the p value for this calculation; red indicates the downregulation of targets; only statistically significant changes are shown (n = 4). *p < 0.05. ASC, adipose-derived mesenchymal stem cell; CCR, C-C motif chemokine receptor; CD, cluster of differentiation; CX3CR, CX3C chemokine receptor; CXCR, C-X-C chemokine receptor; E. coli, Escherichia coli; HLA, human leukocyte antigen; IL, interleukin; Mph, macrophage; NPX, normalized protein expression; OPG, osteoprotegerin; S. aureus, Staphylococcus aureus
Fig. 5
Fig. 5
Phenotypic and functional analysis of ASC-educated mDCs. Flow cytometry analysis of a surface expression of CD14/CD1a; b phagocytosis levels of Zymosan A, E. coli, or S. aureus particles labeled with pHrodo™. Average ± SEM of positive percentages and Geo Mean statistics are shown below; c surface expression of several phagocytic receptors; d surface expression of co-stimulatory molecules; and e surface chemokine receptors in mDCs in the presence or absence of ASCs. f Average ± SEM of positive percentages and Geo Mean of the different surface markers. Data are representative of at least four independent experiments; g OLINK analysis of the secretome of mDCs alone and ASC–mDC co-cultures. The table shows fold change of NPX between ASC–mDC and mDCs alone, together with the p value for this calculation; green indicates the upregulation of targets, and red indicates the downregulation of targets; only statistically significant changes are shown (n = 4). *p < 0.05, **p < 0.01. ASC, adipose-derived mesenchymal stem cell; CCL, C-C motif chemokine; CCR, C-C motif chemokine receptor; CD, cluster of differentiation; CX3CR, CX3C chemokine receptor; CXCL, C-C-C motif chemokine; CXCR, C-X-C chemokine receptor; E. coli, Escherichia coli; EN.RAGE, protein S100-A12; HLA, human leukocyte antigen; IL, interleukin; mDC, mature dendritic cell; NPX, normalized protein expression; NT-3, neurotrophin-3; OSM, oncostatin-M; S. aureus, Staphylococcus aureus; TNF, tumor necrosis factor; TNFSF, tumor necrosis factor ligand superfamily member
Fig. 6
Fig. 6
CD14/CD1a surface expression and phagocytic capacity of ASC-educated mDCs are modulated by IL-6 and PGE2. a Dot plots showing the surface expression of CD14/CD1a, in monocyte-derived mDCs in the presence or absence of ASCs and modulated by IL-6 or PGE2 inhibitors, measured by flow cytometry (n = 3). b Histograms show the phagocytosis levels of S. aureus particles by monocyte-derived mDCs, in the presence or absence of ASCs, and modulated by IL-6 or PGE2 inhibitors, measured by flow cytometry. c Graphs showing the average percentage of CD14+/CD1a ± SEM (left) and the average increase of the percentage of phagocytic cells ± SEM (right) (n = 3). IgG1 was the negative control for αIL-6, and ethanol was added as an indomethacin carrier. *p < 0.05. ASC, adipose-derived mesenchymal stem cell; CD, cluster of differentiation; EtOH, ethanol; IgG, immunoglobulin G; Indo, indomethacin; IL, interleukin; mDC, mature dendritic cell; PGE2, prostaglandin E2; S. aureus, Staphylococcus aureus
Fig. 7
Fig. 7
CD14/CD1a surface expression and phagocytic capacity of mDCs co-cultured with COX-2 KO or parental ASCs. a COX-2 qPCR (top) and PGE2 ELISA (bottom) of COX-2 KO or parental ASCs in basal conditions or upon IL-1β stimulation (n = 3). b, d Dot plots and graphs showing the surface expression of CD14/CD1a, in monocyte-derived mDCs in the presence or absence of COX-2 KO or parental ASCs, measured by flow cytometry (n = 3). Average positive percentage ± SEM is represented. c, e Histograms and graphs showing the phagocytosis levels of S. aureus by monocyte-derived mDCs, in the presence or absence of COX-2 KO or parental ASCs, measured by flow cytometry (n = 3). Average positive percentage increase versus mDC alone ± SEM is represented. ***p < 0.001, ****p < 0.0001. ASC, adipose-derived mesenchymal stem cell; CD, cluster of differentiation; COX-2, cyclooxygenase 2; Exp, experiment; KO, knock-out; mDC, mature dendritic cell; P, parental; PGE2, prostaglandin E2; S. aureus, Staphylococcus aureus
Fig. 8
Fig. 8
CD14/CD1a surface expression, phagocytic capacity, and CD163 expression of mDCs differentiated with ASC-conditioned supernatant. a PGE2 ELISA of basal or IL-1β-stimulated ASC-conditioned media. b Average positive percentage ± SEM of CD14+/CD1a mDC differentiated with basal or IL-1β-conditioned media (n = 3). c Average positive percentage increase of S. aureus phagocytosis versus mDC alone ± SEM of mDC differentiated with basal or IL-1β-conditioned media (n = 3). d Dot plots showing the surface expression of CD14/CD1a, in monocyte-derived mDCs in the presence of basal or IL-1β-conditioned media, measured by flow cytometry (data are representative of 3 independent experiments). e Histograms showing the phagocytosis levels of S. aureus by monocyte-derived mDCs, in the presence of basal or IL-1β-conditioned media, measured by flow cytometry (data are representative of 3 independent experiments). f Surface expression levels of CD163 on mDC differentiated in the presence of basal or IL-1β-conditioned media, measured by flow cytometry (data are representative of 3 independent experiments). ***p < 0.001. ASC, adipose-derived mesenchymal stem cell; CD, cluster of differentiation; CM, conditioned media; IL, interleukin; mDC, mature dendritic cell; PGE2, prostaglandin E2; S. aureus, Staphylococcus aureus

References

    1. Shi C, Pamer EG. Monocyte recruitment during infection and inflammation. Nat Rev Immunol. 2011;11:762–774. doi: 10.1038/nri3070. - DOI - PMC - PubMed
    1. Ushach I, Zlotnik A. Biological role of granulocyte macrophage colony-stimulating factor (GM-CSF) and macrophage colony-stimulating factor (M-CSF) on cells of the myeloid lineage. J Leukoc Biol. 2016;100:481–489. doi: 10.1189/jlb.3RU0316-144R. - DOI - PMC - PubMed
    1. Mosser DM, Edwards JP. Exploring the full spectrum of macrophage activation. Nat Rev Immunol. 2008;8:958–969. doi: 10.1038/nri2448. - DOI - PMC - PubMed
    1. Morva A, Lemoine S, Achour A, Pers JO, Youinou P, Jamin C. Maturation and function of human dendritic cells are regulated by B lymphocytes. Blood. 2012;119:106–114. doi: 10.1182/blood-2011-06-360768. - DOI - PubMed
    1. Chen L, Deng H, Hengmin C. Inflammatory responses and inflammation-associated diseases in organs. Oncotarget. 2018;9:7204–7218. doi: 10.18632/oncotarget.23208. - DOI - PMC - PubMed

Publication types