. 2020 Dec 16;65(1):e00487-20.
doi: 10.1128/AAC.00487-20. Print 2020 Dec 16.

Population Pharmacokinetic Properties of Antituberculosis Drugs in Vietnamese Children with Tuberculous Meningitis

Affiliations

Population Pharmacokinetic Properties of Antituberculosis Drugs in Vietnamese Children with Tuberculous Meningitis

Navarat Panjasawatwong et al. Antimicrob Agents Chemother. .

Abstract

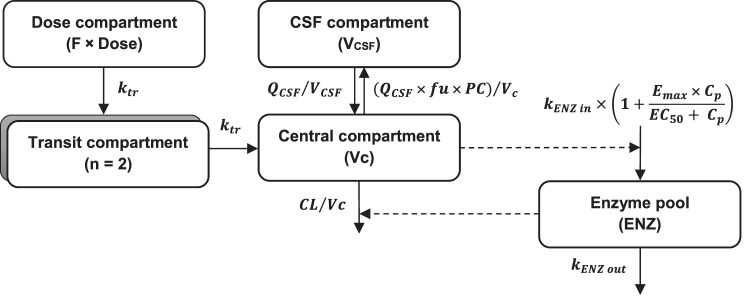
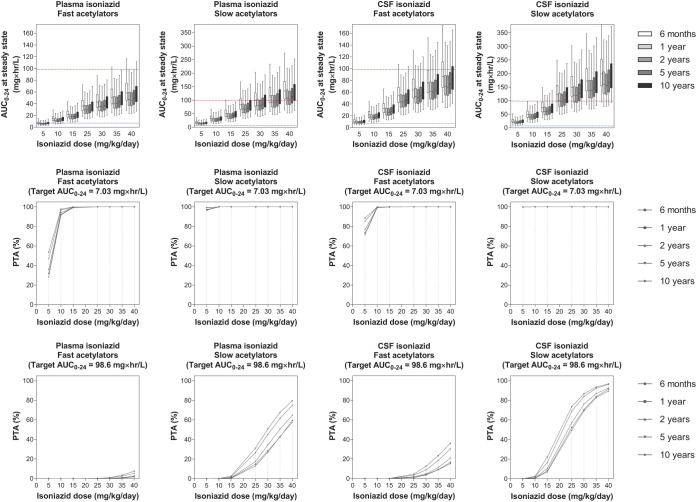
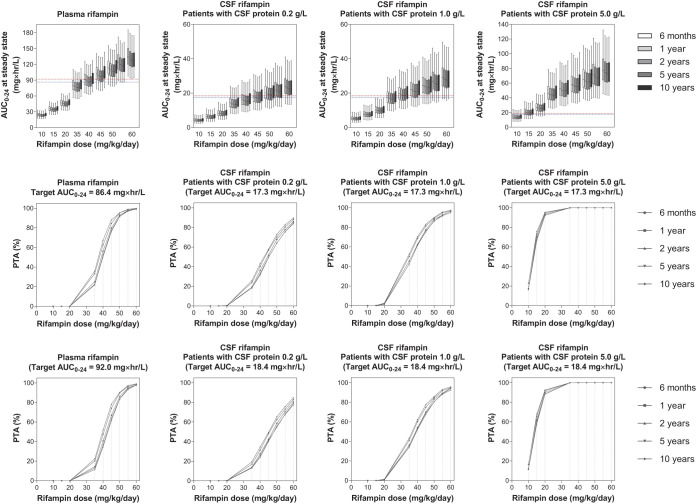
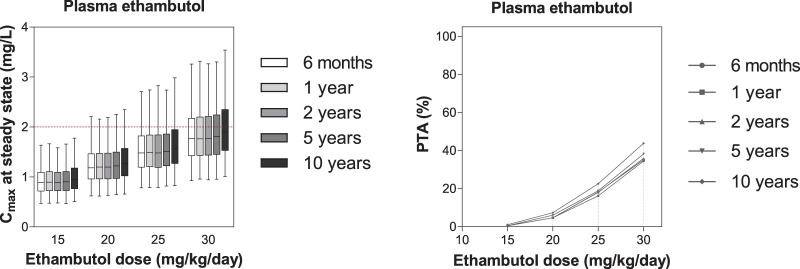
Optimal dosing of children with tuberculous meningitis (TBM) remains uncertain and is currently based on the treatment of pulmonary tuberculosis in adults. This study aimed to investigate the population pharmacokinetics of isoniazid, rifampin, pyrazinamide, and ethambutol in Vietnamese children with TBM, to propose optimal dosing in these patients, and to determine the relationship between drug exposure and treatment outcome. A total of 100 Vietnamese children with TBM were treated with an 8-month antituberculosis regimen. Nonlinear mixed-effects modeling was used to evaluate the pharmacokinetic properties of the four drugs and to simulate different dosing strategies. The pharmacokinetic properties of rifampin and pyrazinamide in plasma were described successfully by one-compartment disposition models, while those of isoniazid and ethambutol in plasma were described by two-compartment disposition models. All drug models included allometric scaling of body weight and enzyme maturation during the first years of life. Cerebrospinal fluid (CSF) penetration of rifampin was relatively poor and increased with increasing protein levels in CSF, a marker of CSF inflammation. Isoniazid and pyrazinamide showed good CSF penetration. Currently recommended doses of isoniazid and pyrazinamide, but not ethambutol and rifampin, were sufficient to achieve target exposures. The ethambutol dose cannot be increased because of ocular toxicity. Simulation results suggested that rifampin dosing at 50 mg/kg of body weight/day would be required to achieve the target exposure. Moreover, low rifampin plasma exposure was associated with an increased risk of neurological disability. Therefore, higher doses of rifampin could be considered, but further studies are needed to establish the safety and efficacy of increased dosing.

Keywords: antituberculosis drugs; dose optimization; pediatric; population pharmacokinetics; tuberculosis meningitis.


Figures

FIG 1
FIG 1
Prediction-corrected visual predictive checks of the final population pharmacokinetic models describing plasma (top panels) and CSF (bottom panels) isoniazid, rifampin, pyrazinamide, and ethambutol. Open circles represent the observed data. The lower, middle, and upper lines represent the 5th, 50th, and 95th percentiles of the observed data. The shaded areas represent the 95% confidence intervals of the 5th, 50th, and 95th percentiles of the simulated data (n = 1,000).
FIG 2
FIG 2
Final rifampin pharmacokinetic model. Abbreviations: Vc, central volume of distribution; VCSF, volume of distribution of CSF compartment; ktr, transfer rate constant; QCSF, intercompartmental clearance between central and CSF compartments; fu, fraction unbound; PC, penetration fraction from central to CSF compartment; KENZ in, zero-order enzyme production rate; KENZ out, first-order rate constant of enzyme degradation; Emax, maximum enzyme induction; EC50, drug concentration that results in half of Emax; ENZ, the amount of metabolizing enzyme in the enzyme pool; F, relative bioavailability; Cp, plasma concentration.
FIG 3
FIG 3
Exposure and probability of target attainment in different isoniazid dosing scenarios. The panels in the top row show box-and-whisker plots (the lower and upper limits of individual boxes denote the 25th and 75th percentiles, and the whiskers represent percentiles 2.5 and 97.5) of simulated steady-state plasma and CSF exposure from 0 to 24 h (AUC0–24) of isoniazid. The broken lines represent the plasma/CSF targets of isoniazid; i.e., the lower blue line represents the EC50 (7.03 mg × h/liter) and the upper red line represents the EC99 (98.6 mg × h/liter) associated with survival in adults with TBM (24). The panels in the two lower rows show the probability of target attainment (PTA) for isoniazid at steady state in plasma and CSF. The shaded bands represent the currently recommended WHO dose of isoniazid.
FIG 4
FIG 4
Exposure and probability of target attainment at different rifampin dosing scenarios. The panels in the top row show box-and-whisker plots (the lower and upper limits of individual boxes denote the 25th and 75th percentiles, and the whiskers represent percentiles 2.5 and 97.5) of simulated steady-state plasma and CSF exposure from 0 to 24 h (AUC0–24) of rifampin in children with CSF protein content of 0.2, 1.0, and 5.0 g/liter. The broken lines represent the plasma/CSF targets of rifampin; i.e., the lower line represents the EC50 (92.0 mg × h/liter in plasma and 18.4 mg × h/liter in CSF), and the upper line represents the EC99 (86.4 mg × h/liter in plasma and 17.3 mg × h/liter in CSF) associated with survival in adults with TBM (22). The panels in the two lower rows show the probability of target attainment (PTA) for rifampin at steady state in plasma and CSF. The shaded bands represent the dose of rifampin currently recommended by WHO.
FIG 5
FIG 5
Exposure and probability of target attainment in different pyrazinamide dosing scenarios. The panels in the top row show box-and-whisker plots (the lower and upper limits of individual boxes denote the 25th and 75th percentiles, and the whiskers represent percentiles 2.5 and 97.5) of simulated steady-state plasma and CSF peak concentrations (Cmax) of pyrazinamide. The broken red lines represent the plasma/CSF targets of pyrazinamide (31.5 mg/liter) derived from the target for the treatment of pulmonary TB in adults (17). The panels in the bottom row show the probability of target attainment (PTA) for pyrazinamide at steady state in plasma and CSF. The shaded bands represent the dose of pyrazinamide currently recommended by WHO.
FIG 6
FIG 6
Exposure and probability of target attainment in different ethambutol dosing scenarios. The left panel shows box-and-whisker plots (the lower and upper limits of individual boxes denote the 25th and 75th percentiles, and the whiskers represent percentiles 2.5 and 97.5) of simulated steady-state plasma peak concentrations (Cmax) of ethambutol. The broken red line represents the plasma target of ethambutol (2.0 mg/liter) derived from the target for the treatment of pulmonary TB in adults (17). The right panel shows the probability of target attainment (PTA) for ethambutol at steady state in plasma. The shaded bands represent the dose of ethambutol currently recommended by WHO.
FIG 7
FIG 7
Time-to-event survival analysis, stratified. Visual predictive plots represent the final pharmacodynamic model, stratified by TBM severity (grades I to III). The black lines represent the observed data. Shaded areas represent the 95% prediction intervals for the simulated data (n = 1,000). Data were subjected to right-censoring for patients lost to follow-up or at the end of the study (240 days).

References

    1. WHO. 2019. Global tuberculosis report. World Health Organization, Geneva, Switzerland.
    1. Galimi R. 2011. Extrapulmonary tuberculosis: tuberculous meningitis new developments. Eur Rev Med Pharmacol Sci 15:365–386. - PubMed
    1. Marx G, Chan E. 2011. Tuberculous meningitis: diagnosis and treatment overview. Tuberc Res Treat 2011:798764. doi:10.1155/2011/798764. - DOI - PMC - PubMed
    1. Lewinsohn D, Gennaro M, Scholvinck L, Lewinsohn D. 2004. Tuberculosis immunology in children: diagnostic and therapeutic challenges and opportunities. Int J Tuber Lung Dis 8:658–674. - PubMed
    1. Kumar A, Ramesh K, Kannan T, Sudha V, Haribabu H, Lavanya J, Swaminathan S, Ramachandran G. 2017. N-acetyltransferase gene polymorphisms & plasma isoniazid concentrations in patients with tuberculosis. Indian J Med Res 145:118–123. doi:10.4103/ijmr.IJMR_2013_15. - DOI - PMC - PubMed

LinkOut - more resources