. 2021 Jan 6;8(1):ENEURO.0111-20.2020.
doi: 10.1523/ENEURO.0111-20.2020. Print 2021 Jan-Feb.

ADAP1/Centaurin-α1 Negatively Regulates Dendritic Spine Function and Memory Formation in the Hippocampus

Affiliations

ADAP1/Centaurin-α1 Negatively Regulates Dendritic Spine Function and Memory Formation in the Hippocampus

Erzsebet M Szatmari et al. eNeuro. .

Abstract

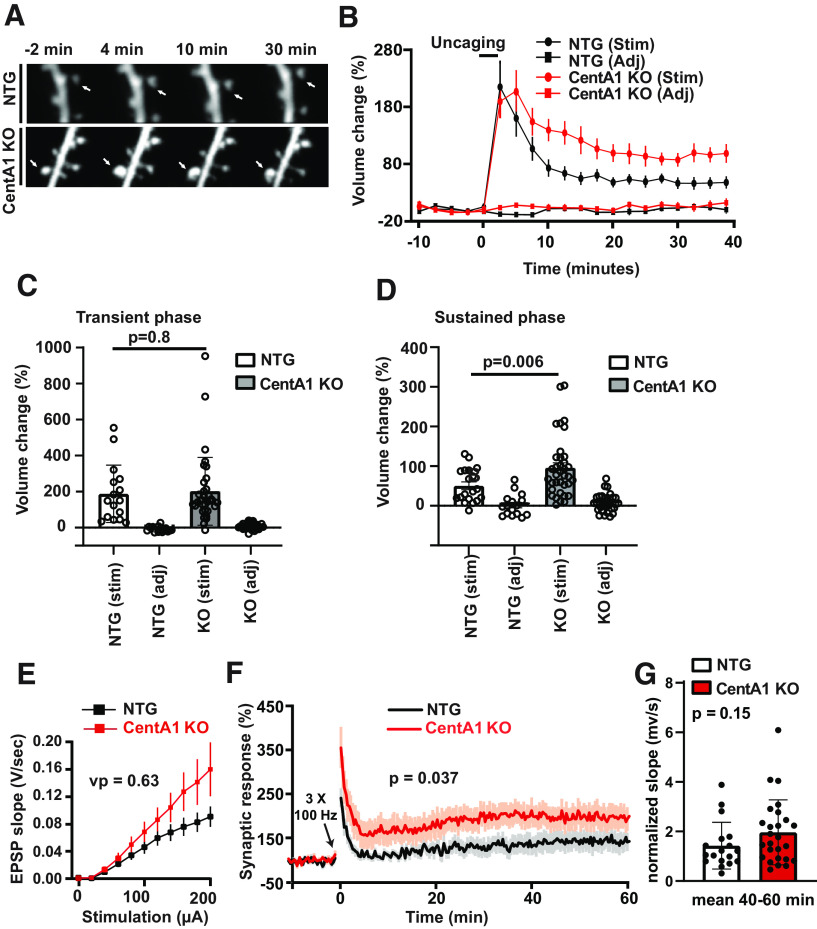
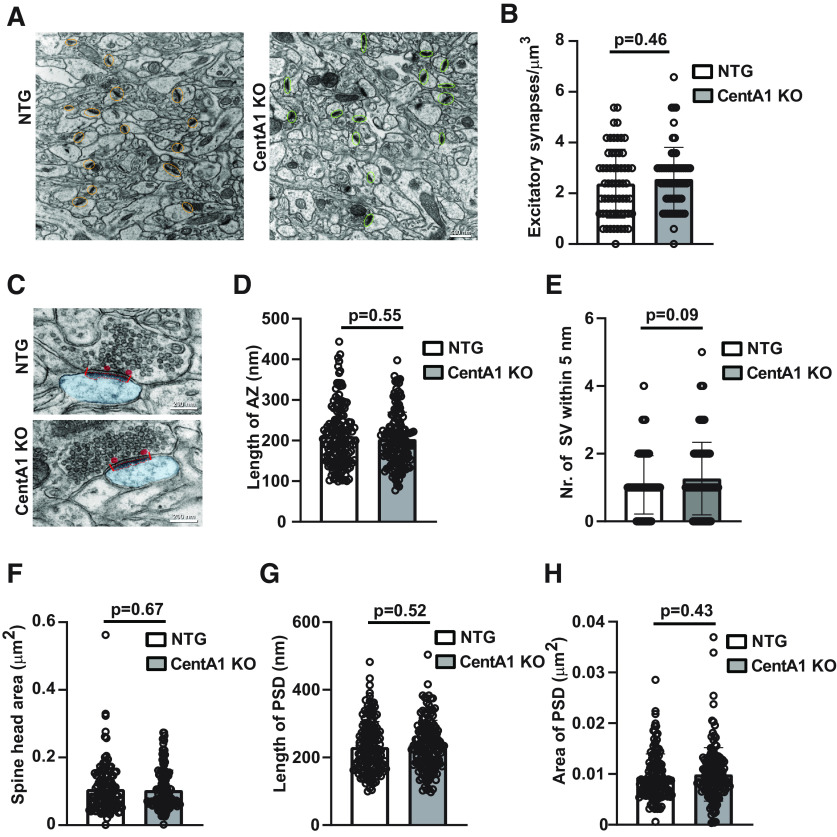
ADAP1/Centaurin-α1 (CentA1) functions as an Arf6 GTPase-activating protein highly enriched in the brain. Previous studies demonstrated the involvement of CentA1 in brain function as a regulator of dendritic differentiation and a potential mediator of Alzheimer's disease (AD) pathogenesis. To better understand the neurobiological functions of CentA1 signaling in the brain, we developed Centa1 knock-out (KO) mice. The KO animals showed neither brain development nor synaptic ultrastructure deficits in the hippocampus. However, they exhibited significantly higher density and enhanced structural plasticity of dendritic spines in the CA1 region of the hippocampus compared with non-transgenic (NTG) littermates. Moreover, the deletion of Centa1 improved performance in the object-in-place (OIP) spatial memory task. These results suggest that CentA1 functions as a negative regulator of spine density and plasticity, and of hippocampus-dependent memory formation. Thus, CentA1 and its downstream signaling may serve as a potential therapeutic target to prevent memory decline associated with aging and brain disorders.

Keywords: ADAP1/Centaurin-α1; Arf6; dendritic spines; hippocampus; learning and memory.


Figures

Figure 1.
Figure 1.
Generation of CentA1 KO mutant mice. A, Schematic drawing of the targeting strategy used to generate CentA1 global KO mouse lines. Exon 3 of Centa1 gene was replaced by sequences for LacZ, followed by a translational STOP, and a Neo selection cassette, flanked by frt sites. Expression and translation of this modified Centa1 locus resulted in a fusion protein of the beginning of CentA1 and LacZ, while functional CentA1 protein is lacking. B, NeuN immunohistochemistry of coronal sections from six- to eight-month-old CentA1 KO and NTG littermate mice show normal brain morphology in CentA1 KO mice. C, Immunoblots show the complete lack of CentA1 protein in the hippocampus from CentA1 KO mice. Bottom, Anti-β-Actin antibody shows that a similar amount of protein samples were loaded between genotypes. NTG: n = 5 mice; CentA1 KO: n = 3 mice. D, Immunoblots show that in the hippocampus of CentA1 KO mice, the level of another brain enriched Centaurin (Centγ3) does not undergo significant compensatory upregulation. The numbers under blots show hippocampal Centγ3 level normalized to β-Actin. NTG: n = 4 mice; CentA1 KO: n = 4 mice. Two-tailed t test, p = 0.29. E, Immunoblots show the level of Arf6 activation in the hippocampi of six-month-old CentA1 KO and NTG littermate mice, evaluated by active Arf6 pull-down assay. Bottom, Anti-Arf6 antibody shows a similar amount of total Arf6 protein in the hippocampal lysates between genotypes. Numbers under blots represent the level of active (GTP bound) Arf6 normalized to total Arf6 protein in the hippocampal tissue. NTG: n = 2 mice; CentA1 KO: n = 3 mice.
Figure 2.
Figure 2.
Lack of CentA1 protein leads to increased dendritic spine density in the hippocampus. A, Representative images of apical dendrites from CA1 pyramidal neurons in organotypic slices from CentA1 KO and NTG mice. Slices were prepared from postnatal day 6 mice and cultured for one to two weeks. Neurons were gene gun transfected with eGFP and two-photon laser scanning microscopy imaged at DIV12. Cumulative frequencies were plotted using each analyzed dendrite from all animals in a genotype group. The inset bar graph shows the average spine density calculated per animal and per genotype group (*p = 0.006; t-test). NTG: n = 16 neurons of seven mice, KO: n = 16 neurons of 11 mice. Error bars indicate SEM. The average apical dendritic spine density is significantly increased in the CentA1 KO slices. K-S test, p = 3e-6. B, Representative images of apical dendrites in Golgi-stained CA1 pyramidal neurons from four- to seven-month-old CentA1 KO mice and their NTG littermates. Cumulative frequencies were plotted using each analyzed dendrite from all animals in a genotype group. The inset bar graph shows the average spine density calculated per animal and per genotype group (*p = 0.002; t-test). NTG: n = 45 neurons of nine mice, KO: n = 35 neurons of seven mice. Error bars indicate SEM. Average apical dendritic spine density is significantly increased in the neurons of CentA1 KO mice. K-S test, p = 0.0003. C, Representative images of apical dendrites in Golgi-stained CA1 pyramidal neurons from eight- to 10-month-old CentA1 KO mice and their NTG littermates. Cumulative frequencies were plotted using each analyzed dendrite from all animals in a genotype group. The inset bar graph shows the average spine density calculated per animal and per genotype group (*p = 0.001; t-test). NTG: n = 45 neurons of nine mice, KO: n = 35 neurons of seven mice. Error bars indicate SEM. Average apical dendritic spine density is significantly increased in the neurons of CentA1 KO mice. K-S test, p = 0.00004. D, Representative images of apical dendrites in Golgi-stained CA1 pyramidal neurons from 11- to 14-month-old CentA1 KO mice and NTG littermates. Cumulative frequencies were plotted using each analyzed dendrite from all animals in a genotype group. The inset bar graph shows the average spine density calculated per animal and per genotype group (*p = 0.001; t-test). NTG: n = 30 neurons of six mice, KO: n = 25 neurons of five mice. Error bars indicate SEM. Average apical dendritic spine density is significantly increased in the neurons of CentA1 KO mice. K-S test, p = 6 × 10⁻¹⁰.
Figure 3.
Figure 3.
Lack of CentA1 enhances dendritic spine structural plasticity in the hippocampus. A, Time-lapsed images of spine structural plasticity induced by two-photon glutamate uncaging in CentA1 KO and NTG neurons transfected with eGFP and imaged 4–6 d later. The arrows indicate stimulated spines. Structural plasticity was induced by applying a low-frequency train of two-photon uncaging pulses (6 ms, 30 pulses, 0.5 Hz) to a single dendritic spine in zero extracellular Mg2+ and 2 mm MNI-caged glutamate. B, Time course of spine volume change in stimulated spines or adjacent spines (Adj) in CentA1 KO and NTG neurons. The number of samples (spine/neuron/mice) was 19/13/7 for NTG slices and 36/17/11 for KO slices. C, Transient spine volume change (volume change averaged over 25–30 min subtracted by volume change at 2 min; p = 0.8. Error bars indicate SEM. D, Sustained spine volume change (volume change averaged over 25–30 min.). Error bars indicate SEM. Two-tailed unpaired t test, p = 0.006. E, Electrophysiological recordings showing average input/output curve of CentA1 KO [n (mice/experiments) = 12/26] and NTG (n = 9/19) littermate mice. Error bars indicate SEM. Non-parametric RM-ANOVA, p = 0.63. F, Time course of change in synaptic response before and after LTP induction in CA1 pyramidal neurons from CentA1 KO [n (animals/experiments) = 12/26] and NTG (n = 9/19) littermate mice. Error bars indicate SEM. Non-parametric RM-ANOVA, p = 0.037. G, Quantification of average potentiation (40–60 min) of neurons in F. Mean and SEM are shown. Mann–Whitney’s U test, p = 0.1501.
Figure 4.
Figure 4.
CentA1 KO mice exhibit normal synaptic ultrastructure in hippocampal CA1 neurons. A, Representative EM images showing spine synapses in the middle of the SR of CA1 hippocampus from NTG (left) and CentA1 KO mice (right). Scale bar = 500 nm. B, Graph compares spine synapse density in hippocampal sections from CentA1 KO mice and NTG at seven to eight months of age using the physical dissector method (three mice/genotype; n = 239 axospinous synapses from 20 micrographs for NTG and n = 257 axospinous synapses from 20 micrographs for CentA1 KO). C, Representative EM images of spine synapses in the middle of the SR of the CA1 hippocampus from NTG (top) and CentA1 KO mice (bottom). Scale bar = 200 nm. D, E, Quantification of mean AZ length and the number of docked SVs (within 5 nm of the presynaptic membrane) in CA1 hippocampus of CentA1 KO mice and NTG at seven to eight months of age (three mice/genotype; n = 50 synapses/animal). F, Graph compares the size of dendritic spine head in hippocampal sections from CentA1 KO mice and NTG at seven to eight months of age (three mice/genotype; n = 50 synapses/animal). G, H, Quantification of mean PSD length (between red lines) and area (demarcated with dotted red line) in CA1 hippocampus of CentA1 KO mice and NTG at seven to eight months of age (three mice/genotype; n = 50 synapses/animal). All data are presented as mean ± SEM. Unpaired t test showed no significant difference between genotypes.
Figure 5.
Figure 5.
Behavioral evaluation of CentA1 KO mice. A–B, Morris Water Maze test shows no significant difference between genotypes in latency to platform during acquisition phase (A) or during probe test (B) (CentA1 KO; n = 28 and NTG littermates; n = 23). C, Diagram of OIP memory test, D, Graph shows no significant difference between genotypes in the average duration of object exploration during training (CentA1 KO; n = 15 and NTG littermates; n = 11). E, CentA1 KO mice exhibit significant discrimination of the familiar and novel object locations and exhibit a strong preference for the object in the novel location as compared with their NTG littermates (p = 0.03) during OIP testing session. All data are presented as mean ± SEM.

Similar articles

Cited by

References

    1. Aziz W, Wang W, Kesaf S, Mohamed AA, Fukazawa Y, Shigemoto R (2014) Distinct kinetics of synaptic structural plasticity, memory formation, and memory decay in massed and spaced learning. Proc Natl Acad Sci USA 111:E194–E202. 10.1073/pnas.1303317110 - DOI - PMC - PubMed
    1. Barker GR, Warburton EC (2015) Object-in-place associative recognition memory depends on glutamate receptor neurotransmission within two defined hippocampal-cortical circuits: a critical role for AMPA and NMDA receptors in the hippocampus, perirhinal, and prefrontal cortices. Cereb Cortex 25:472–481. 10.1093/cercor/bht245 - DOI - PMC - PubMed
    1. Boros BD, Greathouse KM, Gearing M, Herskowitz JH (2019) Dendritic spine remodeling accompanies Alzheimer's disease pathology and genetic susceptibility in cognitively normal aging. Neurobiol Aging 73:92–103. 10.1016/j.neurobiolaging.2018.09.003 - DOI - PMC - PubMed
    1. Colgan LA, Yasuda R (2014) Plasticity of dendritic spines: subcompartmentalization of signaling. Annu Rev Physiol 76:365–385. 10.1146/annurev-physiol-021113-170400 - DOI - PMC - PubMed
    1. De Strooper B, Karran E (2016) The cellular phase of Alzheimer's disease. Cell 164:603–615. 10.1016/j.cell.2015.12.056 - DOI - PubMed

Substances