. 2020 Dec 2;40(49):9372-9385.
doi: 10.1523/JNEUROSCI.1922-20.2020. Epub 2020 Nov 2.

Disentangling the Roles of RIM and Munc13 in Synaptic Vesicle Localization and Neurotransmission

Affiliations

Disentangling the Roles of RIM and Munc13 in Synaptic Vesicle Localization and Neurotransmission

Fereshteh Zarebidaki et al. J Neurosci. .

Abstract

Efficient neurotransmitter release at the presynaptic terminal requires docking of synaptic vesicles to the active zone membrane and formation of fusion-competent synaptic vesicles near voltage-gated Ca2+ channels. Rab3-interacting molecule (RIM) is a critical active zone organizer, as it recruits Ca2+ channels and activates synaptic vesicle docking and priming via Munc13-1. However, our knowledge about Munc13-independent contributions of RIM to active zone functions is limited. To identify the functions that are solely mediated by RIM, we used genetic manipulations to control RIM and Munc13-1 activity in cultured hippocampal neurons from mice of either sex and compared synaptic ultrastructure and neurotransmission. We found that RIM modulates synaptic vesicle localization in the proximity of the active zone membrane independent of Munc13-1. In another step, both RIM and Munc13 mediate synaptic vesicle docking and priming. In addition, while the activity of both RIM and Munc13-1 is required for Ca2+-evoked release, RIM uniquely controls neurotransmitter release efficiency. However, activity-dependent augmentation of synaptic vesicle pool size relies exclusively on the action of Munc13s. Based on our results, we extend previous findings and propose a refined model in which RIM and Munc13-1 act in overlapping and independent stages of synaptic vesicle localization and release.SIGNIFICANCE STATEMENT The presynaptic active zone is composed of scaffolding proteins that functionally interact to localize synaptic vesicles to release sites, ensuring neurotransmission. Our current knowledge of the presynaptic active zone function relies on structure-function analysis, which has provided detailed information on the network of interactions and the impact of active zone proteins. Yet, the hierarchical, redundant, or independent cooperation of each active zone protein to synapse functions is not fully understood. Rab3-interacting molecule and Munc13 are the two key functionally interacting active zone proteins. Here, we dissected the distinct actions of Rab3-interacting molecule and Munc13-1 from both ultrastructural and physiological aspects. Our findings provide a more detailed view of how these two presynaptic proteins orchestrate their functions to achieve synaptic transmission.

Keywords: Munc13; RIM; active zone; electron microscopy; synaptic transmission; synaptic vesicle.


Figures

Figure 1.
Figure 1.
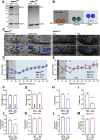
RIM1/2 and Munc13-1 differentially affect SV distribution and docking. A, Immunoblots of lysates from RIM1/2flox hippocampal neurons infected with ΔCre (control) and Cre recombinase (cDKO) detecting RIM1/2 (left) and Munc13-1 (right) expression. Tubulin expression was used as a loading control. Left, Markers designate the molecular weight. B, Diagram represents the analysis of SVs based on their distance from AZ membrane. P.M., plasma membrane. C, Example TEM images displaying the presynaptic area of RIM1/2 control and cDKO (left), as well as Munc13-1 WT and KO (right). Top, Raw images. Bottom, Vesicles are color-coded according to their distance to the AZ membrane: docked SVs (orange), proximal SVs (green), and distal SVs (blue). Scale bar, 100 nm. Additional example pictures are represented in Extended Data Figure 1-2. D, E, Plots represent the number of SVs as a function of distance from the AZ membrane for RIM1/2 cDKO (D) and Munc13-1 KO (E) synapses, compared with their corresponding control (binned to 10 nm). F-M, Bar plots represent the mean PSD length (F,G), docked SVs (H,I), proximal SVs (1-20 nm) (J,K), and distal SVs (21-100 nm) (L,M) for RIM1/2 cDKO and Munc13-1 KO synapses compared with their corresponding controls. The data are obtained from the same experimental settings for all the electron microscopy analysis (RIM1/2 control: 153/3 and RIM1/2 cDKO: 161/3; Munc13-1 WT: 148/3 and Munc13-1 KO: 173/3) indicated in F and G. The numbers are obtained from three independent cultures. Values indicate mean ± SEM. *p ≤ 0.05; **p ≤ 0.01; ***p ≤ 0.001; ****p ≤ 0.0001; nonparametric t test, followed by Mann–Whitney test. For the statistical overview, see also the table in Extended Data Figure 1-1.
Figure 2.
Figure 2.
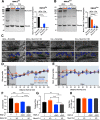
Munc13-1-independent impact of RIM on SV localization. A, B, Immunoblots (left) and bar plots (right) represent the expression of Munc13-1 (A) and RIM1/2 (B) in RIM1/2flox cultures infected with ΔCre + Scramble (Scr.) shRNA (black), ΔCre + 40 × 105 infectious units (IU) Munc13-1 KD shRNA (orange), Cre + Scramble shRNA (blue), and Cre + 40 × 105 Munc13-1 shRNA (gray). Tubulin expression was used as a loading control. Molecular weight markers are indicated on blots. The analysis was performed from three independent cultures. Significance was calculated using one-way ANOVA followed by Tukey's post hoc test (A: F(3,8) = 133.8, p < 0.0001; B: F(3,8) = 48.07, p < 0.0001). C, Example TEM images of RIM1/2flox hippocampal cultures infected as in A and B. Top, Raw images. Bottom, Vesicles are color-coded according to their distance to the AZ membrane: docked SVs (orange), proximal SVs (green), distal SVs (blue). Scale bar, 100 nm. Additional example pictures are represented in Extended Data Figure 2-2. D, E, Plot represents the SV number as a function of distance from the AZ membrane (binned 10 nm; D) and the same values normalized to the control (binned to 10 nm; E). F–H, Bar plots displaying the mean number of docked SVs (F), proximal SVs (1-20 nm) (G), and distal SVs (21-100 nm) (H). Bar graph label “+” indicates endogenous expression of RIM1/2 or Munc13-1. “KD” refers to Munc13-1 KD. “cDKO” refers to RIM1/2-deficient neurons. Number of synaptic profiles for DH are indicated in F. Values indicate mean ± SEM. *p ≤ 0.05; **p ≤ 0.01; ***p ≤ 0.001; ****p ≤ 0.0001; nonparametric one-way ANOVA with Kruskal–Wallis test followed by Dunn's post hoc test. For the statistical overview, see also the table in Extended Data Figure 2-1.
Figure 3.
Figure 3.
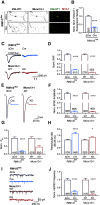
Comparison of synaptic properties of murine RIM1/2- and Munc13-1 KOs in autaptic hippocampal neurons. A, Representative confocal microscopy projections display the immunofluorescence for Munc13-1 and VGLUT1 in RIM1/2 control and cDKO autaptic neurons. Scale bar, 10 µm. B, Bar plot represents the ratiometric fluorescence intensity levels of Munc13-1 to VGLUT1 normalized to the control. Significance was calculated using Student's t test (t(38) = 9.25, p < 0.0001). C, Example traces of current induced by application of hypertonic solution (0.5 m sucrose [Suc], 5 s) to estimate the size of RRP in neurons derived from RIM1/2 control (navy blue), RIM1/2 cDKO (light blue), Munc13-1 WT (dark red), and Munc13-1 KO (light red). D, Bar plots represent the normalized mean of RRP size (sucrose charge transfer). E, Example traces of EPSCs from the same experimental groups as in C. F, Bar plot represents the normalized mean of EPSC amplitude. G, Bar plot represents the normalized vesicular release probability calculated by dividing the charge of EPSC to the sucrose charge. H, Bar plot represents the paired-pulse ratio (with an interstimulus interval of 25 ms). I, Example traces of spontaneous release events from the same experimental groups as in C. J, Bar plot represents the normalized mean frequency of mEPSCs. All of the bar plots are normalized to the corresponding controls, except the paired-pulse ratio. Significances were calculated between the RIM1/2 control and cDKO (navy blue and light blue), and between Munc13-1 WT and KO (dark red and light red) using nonparametric t tests, followed by a Mann–Whitney test. All numbers in bars indicate the cell number/culture number. Data indicate normalized mean ± SEM. *p ≤ 0.05. ****p ≤ 0.0001. For the absolute values and statistical overview, see also the table in Extended Data Figure 3-1.
Figure 4.
Figure 4.
Munc13-1 titration in hippocampal neurons. A, Immunoblot detecting Munc13-1 expression in RIM1/2flox lysates from cultured hippocampal neurons infected with ΔCre + Scramble (Scr.) shRNA as control, ΔCre + Munc13-1 KD shRNAs (2-40 × 105 IU) to produce Munc13-1 dose gradients, and Cre recombinase + Scramble shRNA to create RIM1/2 cDKO. Tubulin expression was used as a loading control. Left, Molecular weight markers. B, Bar plot represents ratiometric quantification of Munc13-1 expression levels to tubulin. Data were collected from three independent cultures and normalized to the corresponding control. Significances were calculated using one-way ANOVA followed by Tukey's post hoc test (F(6,14) = 46.79, p < 0.0001). *p ≤ 0.05. ****p ≤ 0.0001. C, Representative confocal microscopy projections display immunofluorescence intensity of Munc13-1 and VGLUT1 in the same experimental groups as in A. Scale bar, 10 µm. D, Horizontal bar plot represents the ratiometric fluorescence intensity levels of Munc13-1 to VGLUT1 normalized to the control. For each neuron, ∼50 synapses were measured and averaged. Statistical significances are represented only in comparison with RIM1/2 cDKO. Significances and p values were calculated with a nonparametric one-way ANOVA with Kruskal–Wallis test followed by Dunn's post hoc test (H = 128.2, p < 0.0001). *p ≤ 0.05. ****p ≤ 0.0001. Data indicate normalized mean ± SEM. For the statistical overview, see also the table in Extended Data Figure 4-1.
Figure 5.
Figure 5.
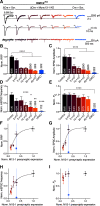
Quantification of RIM-dependent loss of Munc13-1 activity on synaptic properties. A, Sample traces of current induced by hypertonic sucrose to estimate the RRP size (top), sample traces of EPSCs (middle), and mEPSCs (bottom). Autaptic hippocampal neurons were infected with ΔCre + Scramble (Scr.) shRNA as control, ΔCre + Munc13-1 KD shRNAs (2-40 × 105 IU) to produce Munc13-1 dose gradients, and Cre recombinase + Scramble shRNA to create RIM1/2 cDKO. Dashed lines indicate the maximum current amplitude of RIM1/2 cDKO. B–E, Bar plots represent the normalized mean RRP defined as a charge measured by hypertonic sucrose application (B), normalized EPSC amplitude (C), normalized mEPSC frequency (D), and normalized Pvr (E). FI, Plots represent the normalized RRP size (F), EPSC amplitude (G), mEPSC frequency (H), and Pvr (I) as a function of normalized Munc13-1/VGLUT1 presynaptic expression. F-I, Black dashed lines indicate fitting with the Hill equation. Blue dashed line indicates Munc13-1/VGLUT1 expression in RIM1/2 cDKO neurons. Data indicate normalized mean ± SEM. *p ≤ 0.05; **p ≤ 0.01; ****p ≤ 0.0001; nonparametric one-way ANOVA with Kruskal–Wallis test followed by Dunn's post hoc test. For the absolute values and statistical overview, see also the table in Extended Data Figure 5-1.
Figure 6.
Figure 6.
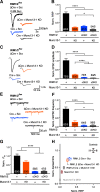
RIM-independent function of Munc13-1 on synaptic properties. A, Sample traces represent the current evoked by hypertonic sucrose as an estimate for RRP in RIM1/2flox cultures infected with ΔCre + Scramble (Scr.) shRNA (black), ΔCre + 40 × 105 IU of Munc13-1 KD shRNA (orange), Cre + Scramble shRNA (blue), and Cre + 40 × 105 Munc13-1 shRNA (gray). B, Bar plot represents the normalized mean of charge released by hypertonic sucrose (referred to as RRP). C, D, Sample traces of EPSC (C) and bar plot of normalized EPSC amplitude. E, F, Sample traces of spontaneous release events (E), and the bar plot represents the normalized mean mEPSC frequency (F). G, Bar plot represents the normalized Pvr. Normalization in all of the bar plots is performed relative to the corresponding control (ΔCre + scramble; black). In graph labels, “+” refers to the endogenous expression. “KD” refers to the Munc13-1 KD. “cDKO” refers to RIM1/2 deficiency. Numbers in bars indicate the cell number/culture number. Data indicate normalized mean ± SEM. *p ≤ 0.05; ****p ≤ 0.0001; nonparametric one-way ANOVA with Kruskal–Wallis test followed by Dunn's post hoc test. For the absolute values and statistical overview, see also the table in Extended Data Figure 6-1. H, Plot represents the SV docking/priming relationship. Munc13-1/2 DKO data are adapted from Camacho et al. (2017). Controls represent ΔCre + Scr., Munc13-1 WT, and Munc13-1/2 DKO rescue with WT Munc13-1 (Camacho et al., 2017).
Figure 7.
Figure 7.
The regulation of RRP augmentation in the absence of RIM and Munc13-1. A, Sample traces represent RRP augmentation protocol in RIM1/2flox cultures infected with ΔCre + Scramble (Scr.) shRNA (black), ΔCre + 40 × 105 IU Munc13-1 KD shRNA (orange), Cre + Scramble shRNA (blue), and Cre + 40 × 105 Munc13-1 shRNA (gray). After initial sucrose-evoked charge measurement (Suc1), 50 APs at 10 Hz were applied followed by another sucrose-evoked charge measurement 2 s after (Suc2). B, Bar plot represents the mean RRP augmentation (ratio of Suc2 to Suc1) in neurons described in A. Graph labels indicate endogenous expression “+.” “KD” refers to the Munc13-1 KD. “cDKO” refers to RIM1/2-deficient neurons; nonparametric one-way ANOVA with Kruskal–Wallis test followed by Dunn's post hoc test. C, Sample traces of RRP augmentation protocol applied on Munc13-2 KO neurons with Munc13-1 KD (40 × 105 shRNA IU). D, Bar plot represents the measurement of RRP augmentations (Suc2/Suc1) in neurons as described in C. The nonparametric t test, followed by Mann–Whitney test, did not show differences between Munc13-2 KO with Scramble and Munc13-1 KD. Numbers in bar plots indicate the cell number/culture number. Data indicate mean ± SEM. *p ≤ 0.05; **p ≤ 0.01; ****p ≤ 0.0001. For the statistical overview, see also the table in Extended Data Figure 7-1.

Similar articles

Cited by

References

    1. Ackermann F, Waites CL, Garner CC (2015) Presynaptic active zones in invertebrates and vertebrates. EMBO Rep 16:923–938. 10.15252/embr.201540434 - DOI - PMC - PubMed
    1. Ackermann F, Schink KO, Bruns C, Izsvak Z, Hamra FK, Rosenmund C, Garner CC (2019) Critical role for Piccolo in synaptic vesicle retrieval. Elife 8:e46629 10.7554/eLife.46629 - DOI - PMC - PubMed
    1. Acuna C, Liu X, Sudhof TC (2016) How to make an active zone: unexpected universal functional redundancy between RIMs and RIM-BPs. Neuron 91:792–807. 10.1016/j.neuron.2016.07.042 - DOI - PubMed
    1. Andrews-Zwilling YS, Kawabe H, Reim K, Varoqueaux F, Brose N (2006) Binding to Rab3A-interacting molecule RIM regulates the presynaptic recruitment of Munc13-1 and ubMunc13-2. J Biol Chem 281:19720–19731. 10.1074/jbc.M601421200 - DOI - PubMed
    1. Arancillo M, Min SW, Gerber S, Münster-Wandowski A, Wu YJ, Herman M, Trimbuch T, Rah JC, Ahnert-Hilger G, Riedel D, Südhof TC, Rosenmund C (2013) Titration of Syntaxin1 in mammalian synapses reveals multiple roles in vesicle docking, priming, and release probability. J Neurosci 33:16698–16714. 10.1523/JNEUROSCI.0187-13.2013 - DOI - PMC - PubMed

Publication types

MeSH terms

LinkOut - more resources