. 2020 Nov 24;117(47):29720-29729.
doi: 10.1073/pnas.2002314117. Epub 2020 Nov 2.

Forest and woodland replacement patterns following drought-related mortality

Affiliations

Forest and woodland replacement patterns following drought-related mortality

Enric Batllori et al. Proc Natl Acad Sci U S A. .

Abstract

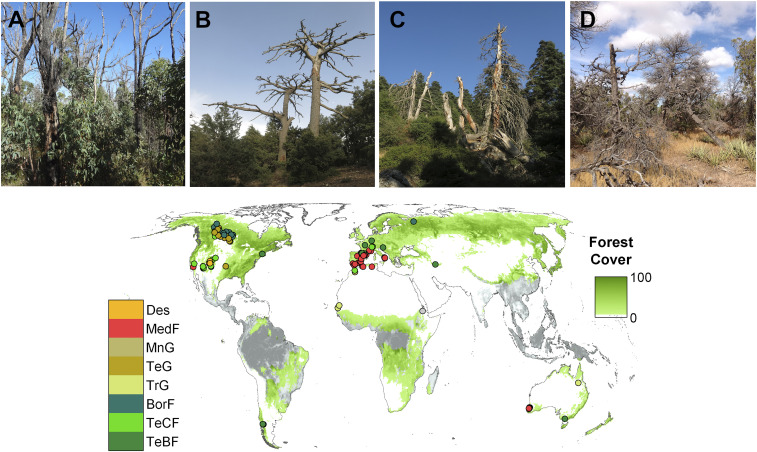
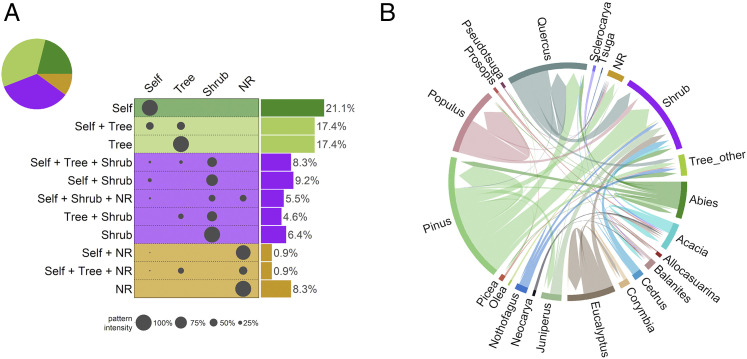
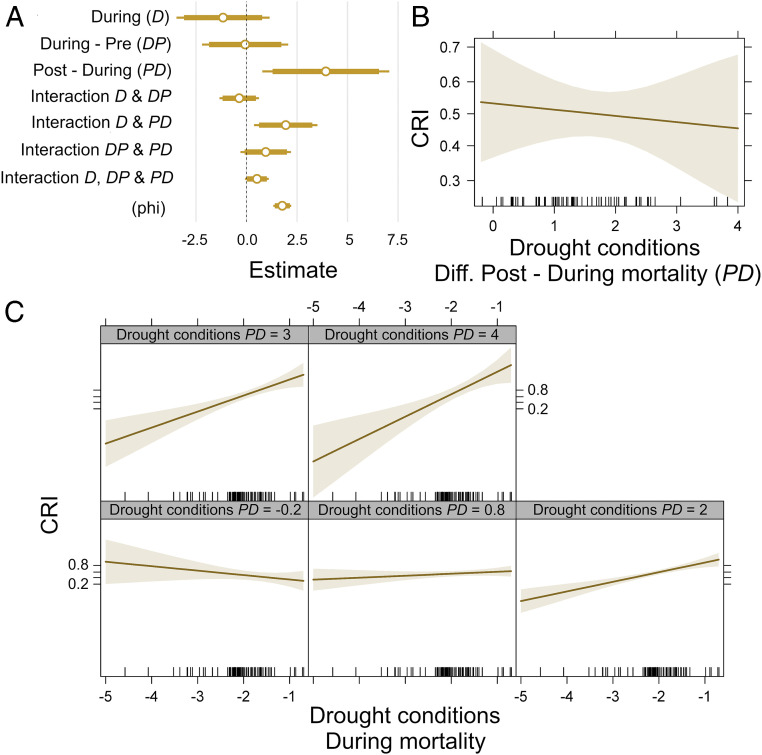
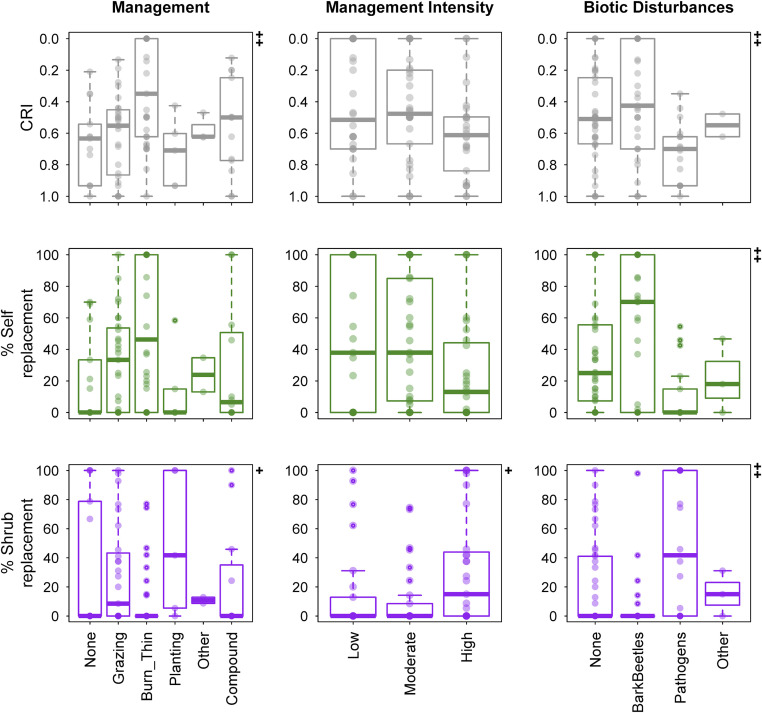
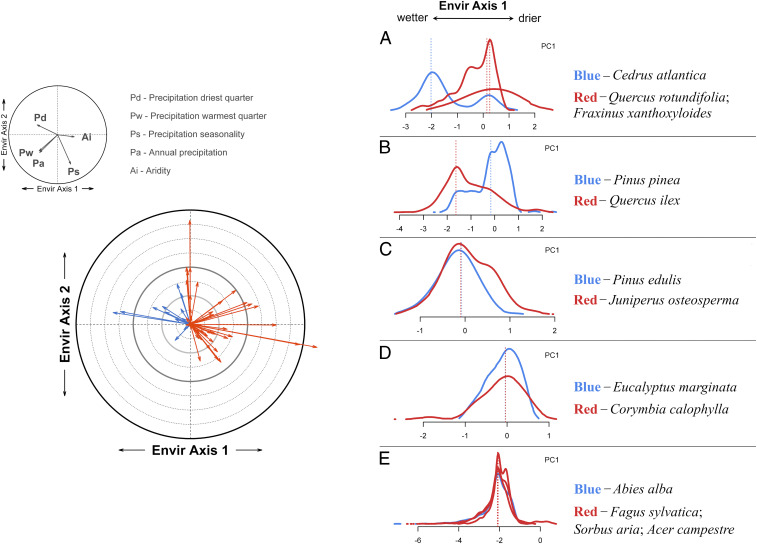
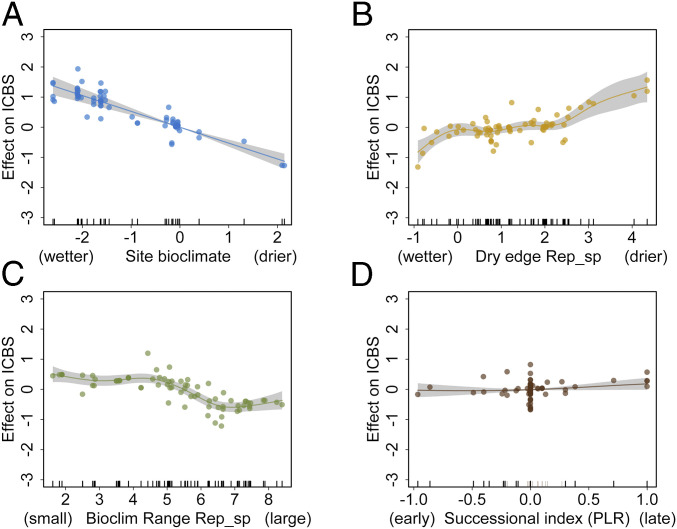
Forest vulnerability to drought is expected to increase under anthropogenic climate change, and drought-induced mortality and community dynamics following drought have major ecological and societal impacts. Here, we show that tree mortality concomitant with drought has led to short-term (mean 5 y, range 1 to 23 y after mortality) vegetation-type conversion in multiple biomes across the world (131 sites). Self-replacement of the dominant tree species was only prevalent in 21% of the examined cases and forests and woodlands shifted to nonwoody vegetation in 10% of them. The ultimate temporal persistence of such changes remains unknown but, given the key role of biological legacies in long-term ecological succession, this emerging picture of postdrought ecological trajectories highlights the potential for major ecosystem reorganization in the coming decades. Community changes were less pronounced under wetter postmortality conditions. Replacement was also influenced by management intensity, and postdrought shrub dominance was higher when pathogens acted as codrivers of tree mortality. Early change in community composition indicates that forests dominated by mesic species generally shifted toward more xeric communities, with replacing tree and shrub species exhibiting drier bioclimatic optima and distribution ranges. However, shifts toward more mesic communities also occurred and multiple pathways of forest replacement were observed for some species. Drought characteristics, species-specific environmental preferences, plant traits, and ecosystem legacies govern postdrought species turnover and subsequent ecological trajectories, with potential far-reaching implications for forest biodiversity and ecosystem services.

Keywords: climate change; drought-induced mortality; forest dynamics; forest resilience; global tree mortality.


Conflict of interest statement

The authors declare no competing interest.

Figures

Fig. 1.
Fig. 1.
Location of the 131 field sites (Dataset S1) for which this research assessed tree species replacement patterns after mortality concomitant with drought. The analysis considers forest and woodland sites across Earth’s forested biomes, excluding species-rich tropical biomes (gray areas in the map). Global forest cover is based on Global Forest Watch (http://globalforestwatch.org). Biome classification (61): BorF, boreal forests/taiga; Des, deserts and xeric shrublands; MedF, Mediterranean forests, woodlands, and scrub; MnG, montane grasslands; TeBF, temperate broadleaf and mixed forests; TeCF, temperate conifer forests; TeG, temperate grasslands, savannas, and shrublands; TrG, tropical and subtropical grasslands, savannas, and shrublands. Photos exemplifying the four replacement processes considered are as follows. (A) Self-replacement; E. marginata, Northern Jarrah Forest, Australia (G.M., 2014). (B) Replacement by another tree species; Cedrus atlantica, Middle Atlas, Morocco (E.B., 2017). (C) Replacement by shrub species; Abies pinsapo, Sierra de las Nieves, Spain (E.B., 2017). (D) No replacement by woody vegetation; P. edulis, New Mexico, USA (F.L., 2012).
Fig. 2.
Fig. 2.
Postdrought replacement patterns by vegetation replacement type (NR, no replacement by woody vegetation; Self, self-replacement; Shrub, replacement by shrublands; Tree, replacement by other tree species) and by tree genus. In A, each bar depicts the possible combinations of replacement by the different types (e.g., Self + Tree corresponds to sites in which self-replacement and replacement by other tree species are observed), whereas the proportion of each replacement type across all sites is depicted by the size of the gray dots. The overall proportion of sites showing a given replacement type is shown (Right). Colors depict major replacing categories in which trees (green), shrubs (violet), or lack of replacement by woody vegetation (brown) dominate. In B, outer-level colored bars show the dominant (predrought) genus and the most important replacing woody genera (NR, lack of replacement by woody vegetation; Shrub, replacement by shrub species; Tree_other, replacement by other scarcely represented tree genera: Acer, Arbutus, Austrocedrus, Betula, Carya, Dasyphyllum, Fagus, Ilex, Lomatia, Sorbus, Ulmus, Weinmannia). Inner links are directional, joinning predrought dominant genera (flat ends) and postdrought replacing genera (arrow ends). The inner links depict replacement proportions, so link width is proportional to the number of cases showing any given replacement pattern.
Fig. 3.
Fig. 3.
Effects of drought conditions before (pre), during, and after (post) tree mortality on the reported replacement patterns. The panels show the results of a beta regression model where replacement pattern (included in the model as the community resemblance index) is the dependent variable and drought conditions are the explanatory variables. The CRI is a joint compositional and structural index that quantifies the vegetation-type change in initial tree forest composition. CRI = 0 reflects no change in composition or structure (complete self-replacement by neighboring canopy trees) and CRI = 1 corresponds to the maximum possible change (no woody replacement). (A) The model’s coefficient estimates. (B) Influence of the difference between postmortality and during-mortality drought conditions on CRI; larger values correspond thus to more favorable conditions after mortality. (C) Influence of the interaction between during-mortality drought and the difference between postmortality and during-mortality drought conditions on CRI. Model pseudo-R2 = 0.274.
Fig. 4.
Fig. 4.
Postdrought replacement patterns in relation to management, management intensity, and biotic disturbances. The CRI is a joint compositional and structural index that quantifies the vegetation-type change in initial tree forest composition (Fig. 3). The symbols (Top Right) in each plot show significant differences among the different classes in each panel: +P < 0.05, ++P < 0.01.
Fig. 5.
Fig. 5.
Community bioclimatic shift as a result of forest mortality associated with drought. (Left) Relative change within the environmental space defined by precipitation regime and aridity. Environmental axes 1 and 2 encompass 82.4% of the variability of individual variables (PCA-derived axes). Each arrow represents the bioclimatic shift for a given forest site computed as the difference between the bioclimatic centroids of the dominant (predrought) and the replacing woody species weighted by the relative abundance of each species at the site. Orange and blue arrows illustrate shifts toward more xeric and more mesic communities, respectively. (Right) From A to E are examples of bioclimatic niches of the predrought dominant (blue) and postdrought replacing (red) species. Solid lines show the abundance and distribution range of each species along environmental axis 1, whereas the dotted vertical lines correspond to the species’ bioclimatic optima (center of mass of the distribution).
Fig. 6.
Fig. 6.
Contribution of (A) the bioclimatic characteristics of the study sites, (B) the dry bioclimatic edge of the replacing species (Rep_sp), (C) the range of the bioclimatic distribution of the replacing woody species, and (D) the successional index of the replacing species versus the dominant (predrought) species on the bioclimatic shift index. ICBS is the difference between the bioclimatic optima of the replacing woody species and the bioclimatic optima of the dominant (predrought) species along environmental axis 1 (Fig. 4). Positive ICBS values indicate shifts toward more xeric communities, whereas negative values indicate shifts toward more mesic communities. A shows a linear fit and BD depict the component smooth functions of a generalized additive model fitted using the four variables depicted here; model R2 = 0.612, explained deviance = 67.2%; all variables are significant at P < 0.05.

References

    1. Allen C. D., Breshears D. D., McDowell N. G., On underestimation of global vulnerability to tree mortality and forest die-off from hotter drought in the Anthropocene. Ecosphere 6, 1–55 (2015).
    1. Anderegg W. R. L., Kane J. M., Anderegg L. D. L., Consequences of widespread tree mortality triggered by drought and temperature stress. Nat. Clim. Chang. 3, 30–36 (2013).
    1. Williams A. P., et al. , Temperature as a potent driver of regional forest drought stress and tree mortality. Nat. Clim. Chang. 3, 292–297 (2013).
    1. Greenwood S., et al. , Tree mortality across biomes is promoted by drought intensity, lower wood density and higher specific leaf area. Ecol. Lett. 20, 539–553 (2017). - PubMed
    1. Intergovernmental Panel on Climate Change (IPCC) , “Summary for policymakers” in Global Warming of 1.5°C. An IPCC Special Report on the Impacts of Global Warming of 1.5°C above Pre-Industrial Levels and Related Global Greenhouse Gas Emission Pathways, in the Context of Strengthening the Global Response to the Threat of Climate Change, Sustainable Development, and Efforts to Eradicate Poverty, Masson-Delmotte V., Ed. et al. (World Meteorological Organization, Geneva, Switzerland, 2018), pp. 1–32.

Publication types

LinkOut - more resources