. 2020 Nov 17;117(46):29133-29143.
doi: 10.1073/pnas.2013552117. Epub 2020 Nov 2.

The inhibition of LSD1 via sequestration contributes to tau-mediated neurodegeneration

Affiliations

The inhibition of LSD1 via sequestration contributes to tau-mediated neurodegeneration

Amanda K Engstrom et al. Proc Natl Acad Sci U S A. .

Abstract

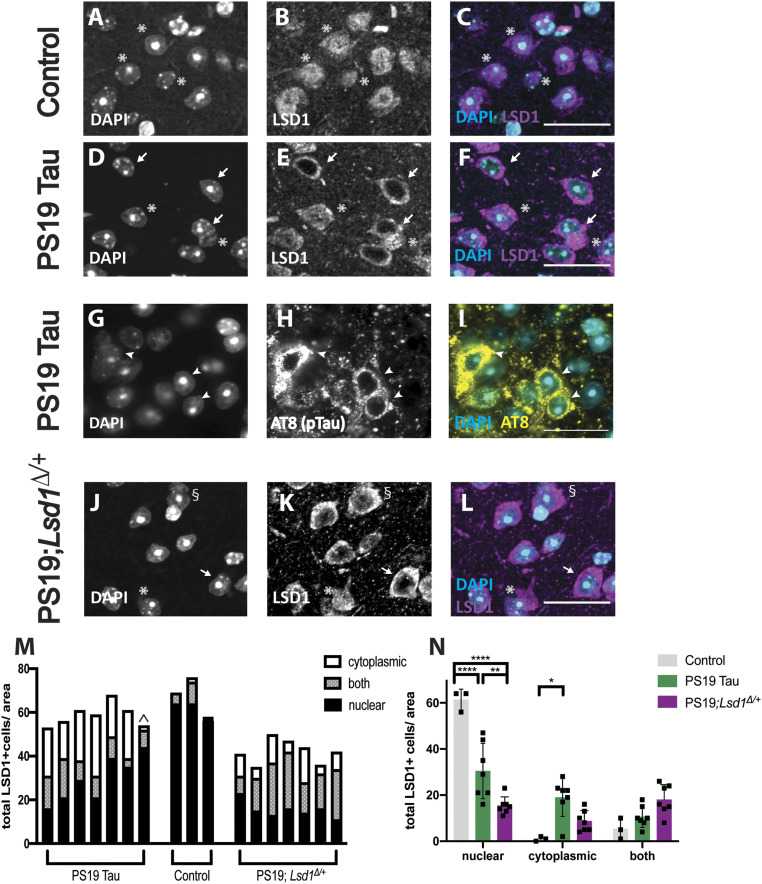
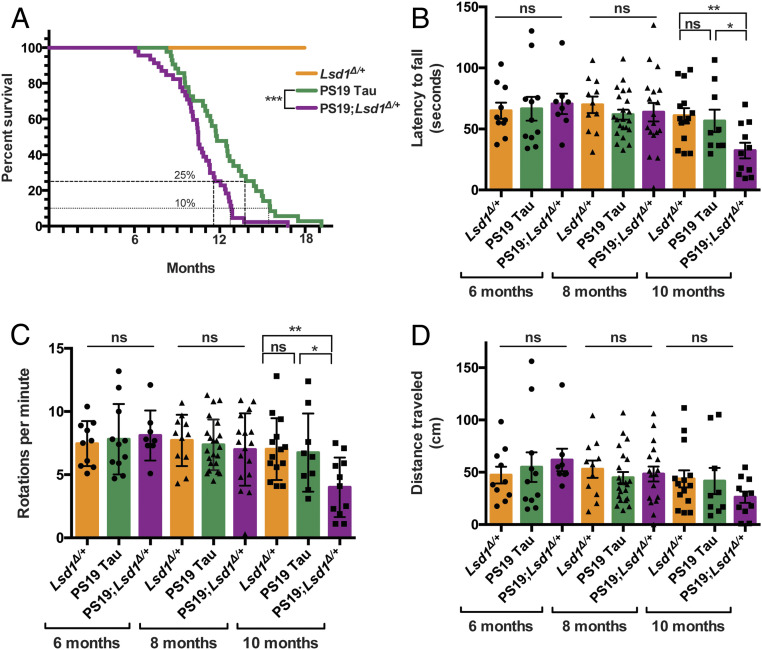
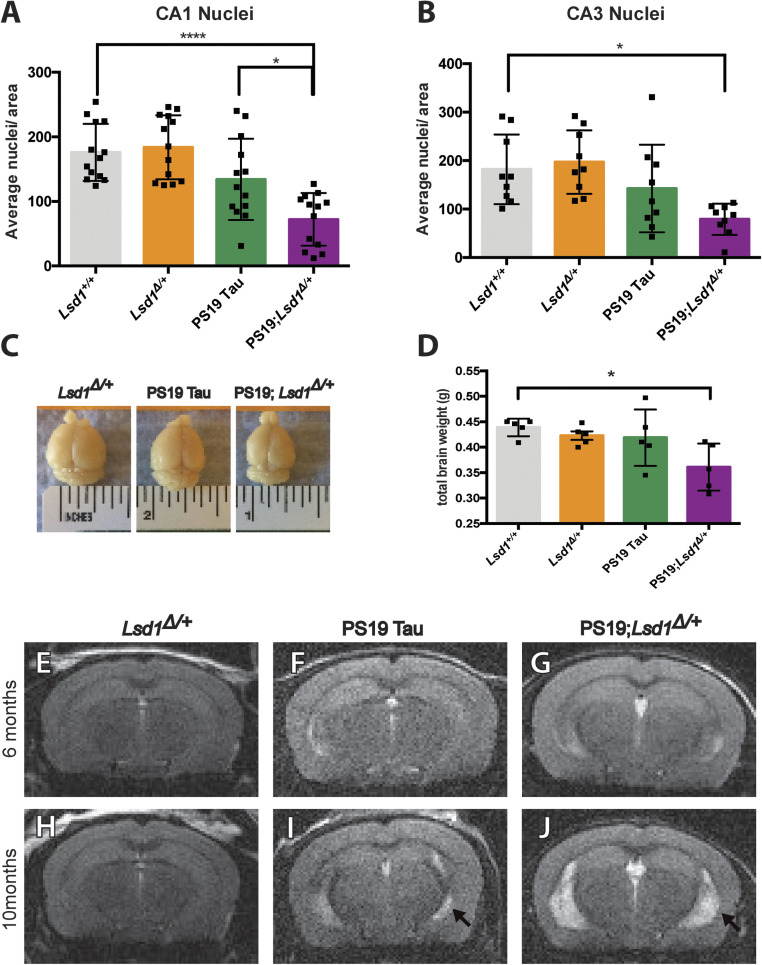
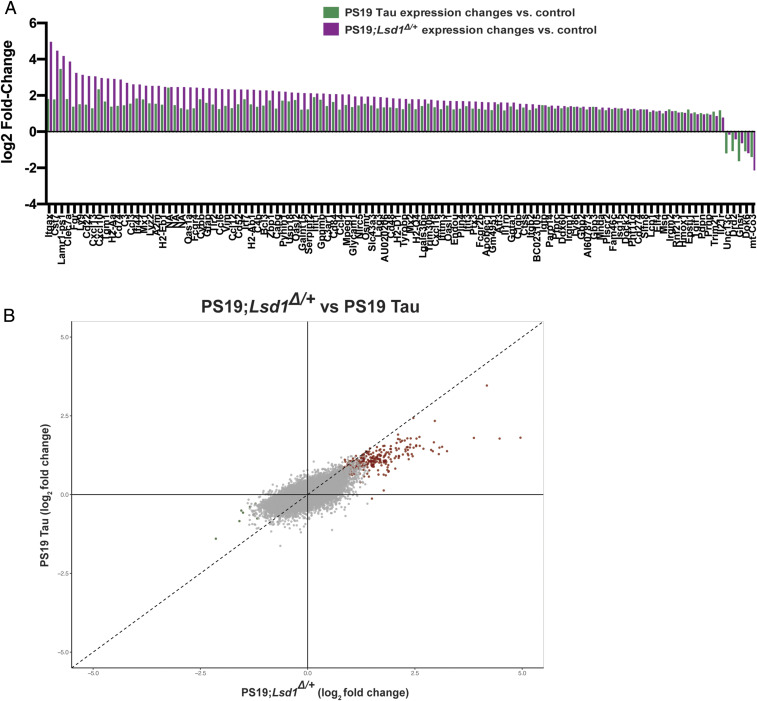
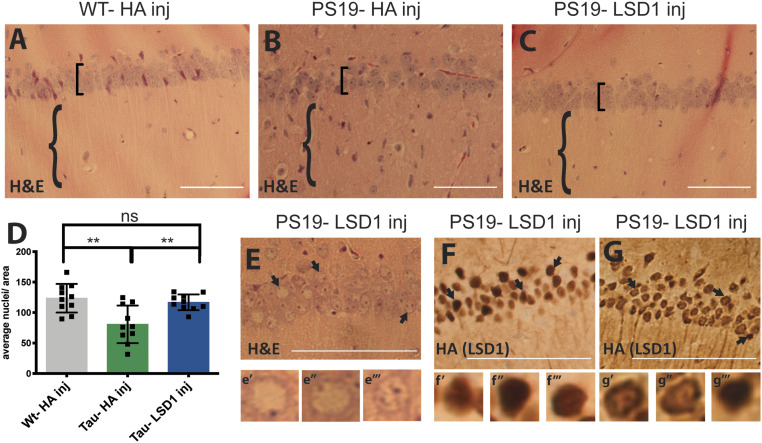
Tauopathies are a class of neurodegenerative diseases associated with pathological tau. Despite many advances in our understanding of these diseases, the direct mechanism through which tau contributes to neurodegeneration remains poorly understood. Previously, our laboratory implicated the histone demethylase LSD1 in tau-induced neurodegeneration by showing that LSD1 localizes to pathological tau aggregates in Alzheimer's disease cases, and that it is continuously required for the survival of hippocampal and cortical neurons in mice. Here, we utilize the P301S tauopathy mouse model to demonstrate that pathological tau can exclude LSD1 from the nucleus in neurons. In addition, we show that reducing LSD1 in these mice is sufficient to highly exacerbate tau-mediated neurodegeneration and tau-induced gene expression changes. Finally, we find that overexpressing LSD1 in the hippocampus of tauopathy mice, even after pathology has formed, is sufficient to significantly delay neurodegeneration and counteract tau-induced expression changes. These results suggest that inhibiting LSD1 via sequestration contributes to tau-mediated neurodegeneration. Thus, LSD1 is a promising therapeutic target for tauopathies such as Alzheimer's disease.

Keywords: Alzheimer’s disease; LSD1; epigenetics; neurodegeneration; tauopathy.


Conflict of interest statement

The authors declare no competing interest.

Figures

Fig. 1.
Fig. 1.
LSD1 sequestration and tau accumulation in the presence of pathological tau. (AC) Representative immunofluorescence of 12-mo-old control wild-type mice showing the nuclear marker DAPI (4',6-diamidino-2-phenylindole) (A), LSD1 (B), and merged (C) in the cerebral cortex where LSD1 is localized specifically to DAPI-positive nuclei. (DF) Representative image of the cerebral cortex in 12-mo-old PS19 Tau mice. Staining for DAPI (D), LSD1 (E), and merged (F) shows that LSD1 is localized outside the nucleus and depleted from the DAPI-positive nucleus. Arrows denote cells where LSD1 is localized outside of the nucleus, and asterisks denote LSD1 localized specifically to the nucleus. (GI) Representative immunofluorescence of 12-mo-old PS19 Tau mouse with staining for DAPI (G), AT8-positive hyperphosphorylated tau (H), and merge (I) where hyperphosphorylated tau accumulates in the cytoplasm of the cell body. Arrowheads denote hyperphosphorylated tau. (JL) Representative immunofluorescence of 12-mo-old control Tau mice that are heterozygous for Lsd1 (PS19; Lsd1Δ/+) showing DAPI (J), LSD1 (K), and merged (L) in the cerebral cortex. Arrows denote cells where LSD1 is localized outside of the nucleus, asterisks denote LSD1 localized specifically inside the nucleus, and § denotes cells where LSD1 is both nuclear and cytoplasmic. (Scale bars, 25 μm.) (M and N) Quantification of the LSD1 localization represented in AF and JL. (M) Each bar represents a single mouse. LSD1 was scored as being localized to the nucleus, the cytoplasm, or both areas. ^ denotes the one PS19 Tau mouse with low levels of observed cytoplasmic LSD1 localization. (N) Combined analysis from M in each cell region for control (WT n = 3), PS19 Tau (n = 7), and PS19;Lsd1Δ/+ (n = 7) mice. Values are mean ± SEM, two-way analysis of variance (ANOVA) with Tukey’s post hoc test *P < 0.05, **P < 0.01,****P < 0.001.
Fig. 2.
Fig. 2.
Reduction of Lsd1 exacerbates the PS19 Tau mouse paralysis phenotype. (A) Lifespan curve showing that no Lsd1Δ/+ mice died before 18 mo (orange, n = 20). PS19;Lsd1Δ/+ mice (purple, n = 44) have a significant reduction in survival compared to PS19 Tau mice with wild-type levels of Lsd1 (green, n = 37) (Log-rank Mantle–Cox test ***P < 0.005). (BD) Rotarod testing of latency to fall (in seconds) (B), rotations per minute (when the mouse fell) (C), and distance traveled (in centimeters) (D) for mice at ages 6, 8, and 10 mo. Lsd1Δ/+ (orange, n = 10, 11, 14), PS19 Tau (green, n = 11, 22, 9), and PS19;Lsd1Δ/+ (purple, n = 8, 17, 11). Values are mean ± SEM (two-way ANOVA) with Tukey’s post hoc test *P < 0.05, **P < 0.01; ns, not significant.
Fig. 3.
Fig. 3.
Reduction of Lsd1 exacerbates neurodegeneration in PS19 Tau mice. (A and B) Average nuclei per area in the CA1 (A) and CA3 (B) regions of the hippocampus in 12-mo-old Lsd1+/+, Lsd1Δ/+, PS19 Tau, and PS19;Lsd1Δ/+ mice. Quantification from histology represented in SI Appendix, Fig. S5 AH. Values are mean ± SD (A, n = 13 and B, n = 9). (C) Representative image of the brains of 12-mo-old Lsd1Δ/+, PS19 Tau, and PS19;Lsd1Δ/+ littermates. (D) Total brain weight of 12-mo-old littermates represented in C. Values are mean ± SD (n = 5). For all graphs: one-way ANOVA with Tukey’s post hoc test (two sided) *P < 0.05, ****P < 0.001. (EJ) Representative image of T2-weighted RARE coronal MRI taken from 6 mo (EG) and 10 mo (HJ) of age in Lsd1Δ/+ (E and H), PS19 (F and J), and PS19;Lsd1Δ/+ (G and J) mice (n = 3). Arrow denotes region of hippocampal atrophy.
Fig. 4.
Fig. 4.
Molecular overlap between loss of LSD1 function and tauopathy. (A) Histogram (log2 fold change) of the 112 genes that have significant changes in gene expression in the PS19 Tau mice (green, n = 4) and their corresponding gene expression change in PS19;Lsd1Δ/+ mice (purple, n = 4). (B) Scatterplot showing the correlation between the genome-wide log2 fold change in gene expression between PS19 Tau and PS19;Lsd1Δ/+. The most significantly changed genes in PS19;Lsd1Δ/+ mice are shown in red (up-regulated) and green (down-regulated). All other genes are shown in gray. Dotted line represents 1:1 relationship between gene expression changes in PS19 Tau versus PS19;Lsd1Δ/+. Exacerbated genes fall to the Right of the dotted line in the positively correlated quadrant and to the Left of the dotted line in the negatively correlated quadrant. Genes with correlated expression changes are found in the Top Right and Bottom Left quadrants, while genes that do not correlate are found in the opposite quadrants.
Fig. 5.
Fig. 5.
LSD1 overexpression rescues the neurodegenerative phenotype in the hippocampus of 11-mo-old PS19 Tau mice. (AC) Representative image of H&E-stained CA1 region of the hippocampus of 11-mo-old wild-type mice injected with HA control virus (WT-HA inj) (A), PS19 Tau mice injected with HA control virus (PS19-HA inj) (B), and PS19 Tau mice injected with Lsd1 overexpressing virus (PS19-LSD1 inj) (C). Square brackets denote thickness of pyramidal layer of the CA1 of the hippocampus and braces denote hippocampal region with or without infiltrating cells. (D) Quantification of the average number of nuclei in the pyramidal layer of the hippocampus per area per mouse from histology represented in A–C. Values are mean ± SD (n = 10, one-way ANOVA with Tukey’s post hoc test, **P < 0.01; ns, not significant). (E) Representative H&E of PS19-LSD1 inj mouse with abnormal nuclei blebbing in the CA1 region of the hippocampus. E′–E‴, high magnified image of cells denoted by arrows in E of individual nuclei that are either abnormally blebbed (E′, E″) or normal (E‴). (F and G) Immunohistochemistry staining of HA(LSD1) in 11 mo PS19-LSD1 inj mice. HA is either localized specifically to the nucleus in all nuclei (F) or in only a few nuclei while it is partially sequestered in the cytoplasm in others (G). F′–F‴, high magnified image of cells denoted by arrows in F of nuclear HA localization in individual nuclei. G′ and G‴, high magnified image of cells denoted by arrows in G of individual nuclei with HA(LSD1) either sequestered to the cytoplasm (G′, G″) or confined to the nucleus (G‴). (Scale bars, 50 μm.)
Fig. 6.
Fig. 6.
Overexpression of LSD1 rescues the moleular changes in PS19 Tau mice. (A) Histogram (log2 fold change) of the 144 genes that have significant changes in expression in the PS19 Tau-HA inj mice (green, n = 3) and their corresponding gene expression changes in the PS19 Tau-LSD1 inj mice (blue, n = 3). (B) Scatterplot showing the correlation between the genome-wide log2 fold change in gene expression between PS19 Tau-HA inj and PS19 Tau-LSD1 inj. The most significantly changed genes in the PS19 Tau-HA inj mice are shown in red (up-regulated) and green (down-regulated). All other genes are shown in gray. Dotted line represents 1:1 relationship between gene expression changes in PS19 Tau-Ha inj and PS19 Tau-LSD1 inj. Rescued genes fall to the Left of the dotted line in the positively correlated quadrant and to the Right of the dotted line in the negatively correlated quadrant. Genes with correlated expression changes are found in the Top Right and Bottom Left quadrants, while genes that do not correlate are found in the opposite quadrants.

Similar articles

Cited by

References

    1. Orr M. E., Sullivan A. C., Frost B., A brief overview of tauopathy: Causes, consequences, and therapeutic strategies. Trends Pharmacol. Sci. 38, 637–648 (2017). - PMC - PubMed
    1. Wang Y., Mandelkow E., Tau in physiology and pathology. Nat. Rev. Neurosci. 17, 5–21 (2016). - PubMed
    1. Holtzman D. M., et al. , Tau: From research to clinical development. Alzheimers Dement. 12, 1033–1039 (2016). - PubMed
    1. Wischik C. M., et al. , Isolation of a fragment of tau derived from the core of the paired helical filament of Alzheimer disease. Proc. Natl. Acad. Sci. U.S.A. 85, 4506–4510 (1988). - PMC - PubMed
    1. Goedert M., Wischik C. M., Crowther R. A., Walker J. E., Klug A., Cloning and sequencing of the cDNA encoding a core protein of the paired helical filament of alzheimer disease: Identification as the microtubule-associated protein tau. Proc. Natl. Acad. Sci. U.S.A. 85, 4051–4055 (1988). - PMC - PubMed

Publication types