. 2020 Nov 17;117(46):28795-28805.
doi: 10.1073/pnas.2008122117. Epub 2020 Nov 2.

Comparative roles of charge, π, and hydrophobic interactions in sequence-dependent phase separation of intrinsically disordered proteins

Affiliations

Comparative roles of charge, π, and hydrophobic interactions in sequence-dependent phase separation of intrinsically disordered proteins

Suman Das et al. Proc Natl Acad Sci U S A. .

Abstract

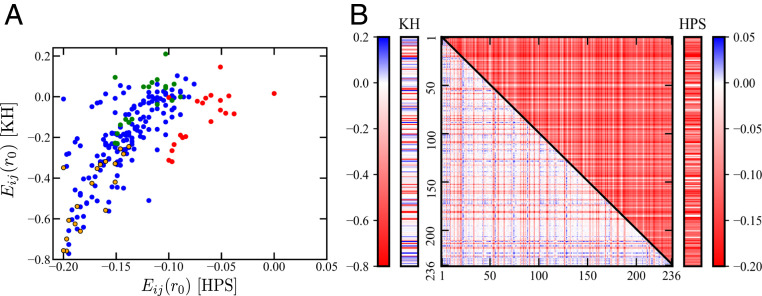
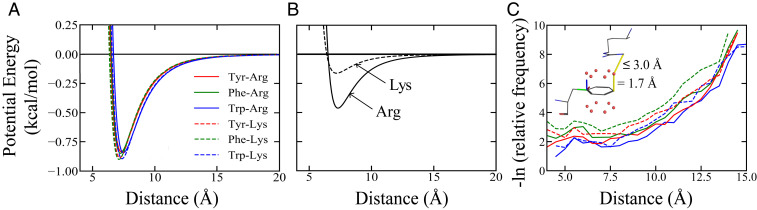
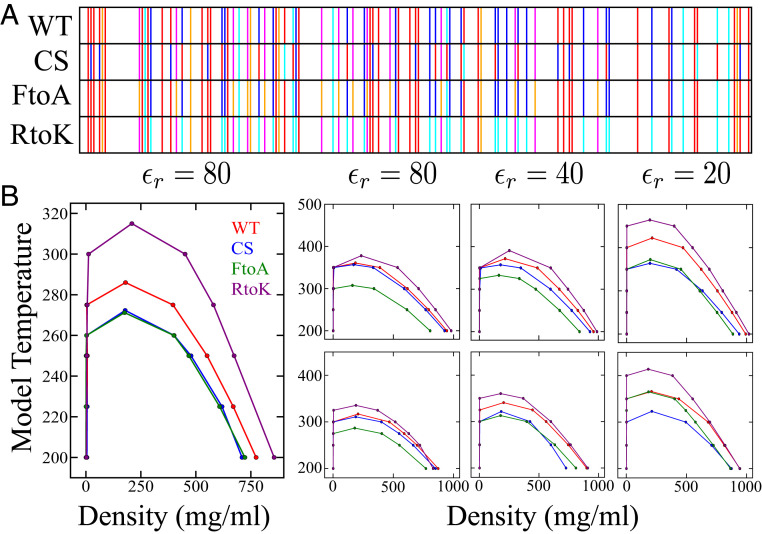
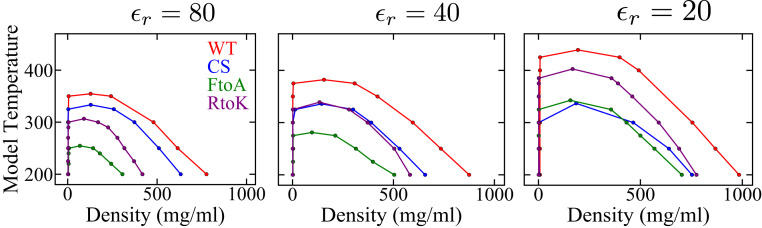
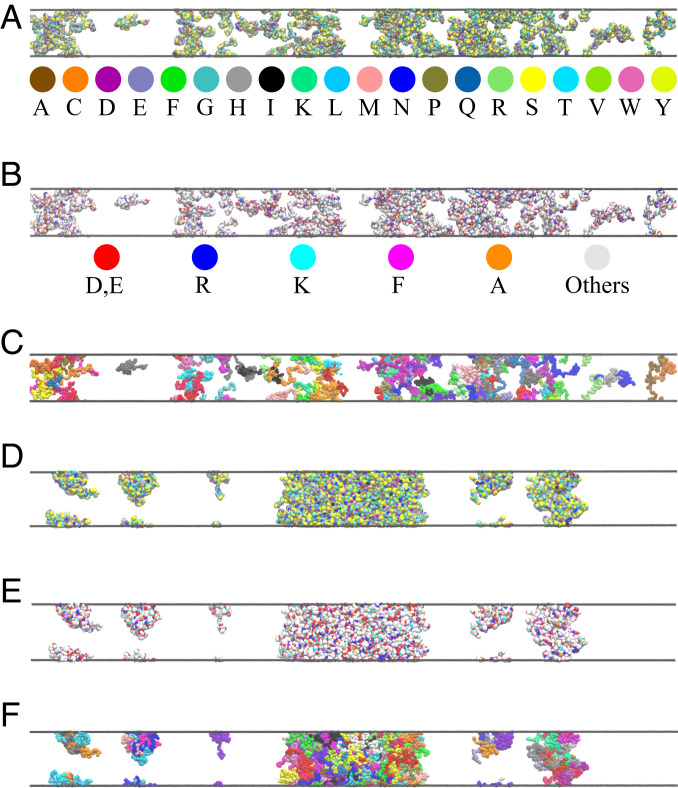
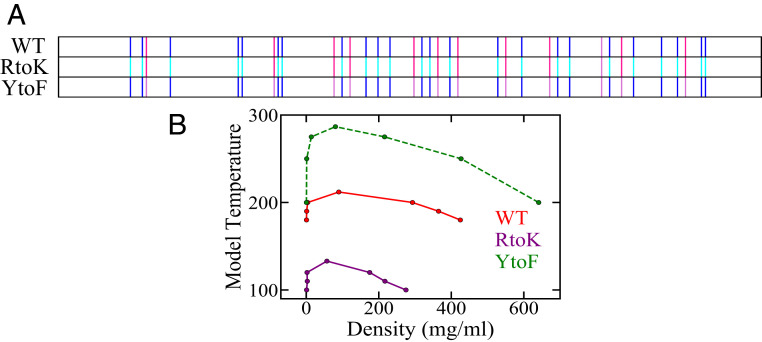
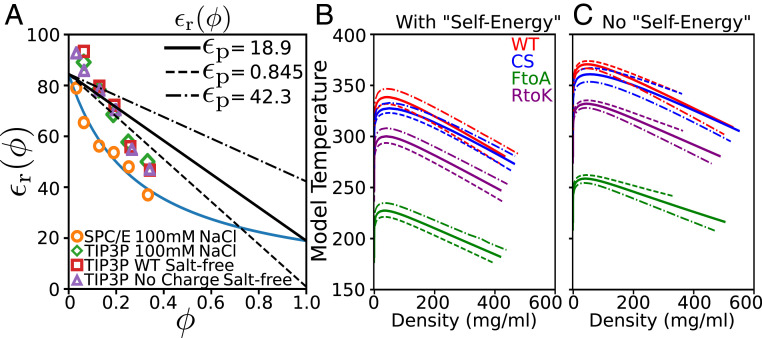
Endeavoring toward a transferable, predictive coarse-grained explicit-chain model for biomolecular condensates underlain by liquid-liquid phase separation (LLPS) of proteins, we conducted multiple-chain simulations of the N-terminal intrinsically disordered region (IDR) of DEAD-box helicase Ddx4, as a test case, to assess roles of electrostatic, hydrophobic, cation-π, and aromatic interactions in amino acid sequence-dependent LLPS. We evaluated three different residue-residue interaction schemes with a shared electrostatic potential. Neither a common hydrophobicity scheme nor one augmented with arginine/lysine-aromatic cation-π interactions consistently accounted for available experimental LLPS data on the wild-type, a charge-scrambled, a phenylalanine-to-alanine (FtoA), and an arginine-to-lysine (RtoK) mutant of Ddx4 IDR. In contrast, interactions based on contact statistics among folded globular protein structures reproduce the overall experimental trend, including that the RtoK mutant has a much diminished LLPS propensity. Consistency between simulation and experiment was also found for RtoK mutants of P-granule protein LAF-1, underscoring that, to a degree, important LLPS-driving π-related interactions are embodied in classical statistical potentials. Further elucidation is necessary, however, especially of phenylalanine's role in condensate assembly because experiments on FtoA and tyrosine-to-phenylalanine mutants suggest that LLPS-driving phenylalanine interactions are significantly weaker than posited by common statistical potentials. Protein-protein electrostatic interactions are modulated by relative permittivity, which in general depends on aqueous protein concentration. Analytical theory suggests that this dependence entails enhanced interprotein interactions in the condensed phase but more favorable protein-solvent interactions in the dilute phase. The opposing trends lead to only a modest overall impact on LLPS.

Keywords: biomolecular condensates; membraneless organelles; phase separation.


Conflict of interest statement

The authors declare no competing interest.

Figures

Fig. 1.
Fig. 1.
Comparing two amino acid residue-based coarse-grained potentials. (A) Scatterplot of 210 pairwise contact energies (in units of kcal mol1) in the HPS (horizontal variable) versus those in the KH (vertical variable) model (52). Eij(r0)s are the pairwise potential energies Uaa|HPS(r) or Uaa|KH(r) (SI Appendix, SI Text), between two residues of types i,j separated by rij=r0 where the Lennard–Jones component of the potential is minimum (i,j here stand for labels for the 20 amino acid types). Energies of contacts involving Arg (red circles), Lys (green circles), and Phe (yellow-filled black circles) are colored differently from others (blue circles). (B) Contact energies between residue pairs at positions i,j of the n=236 sequence of WT Ddx4 IDR [Ddx4N1 (4)] in the two potentials are color coded by the scales. The vertical and horizontal axes represent residue positions i,jn. The ij contact energies in the HPS and KH models are provided in the 2D plot, whereas the i=j contact energies are shown alongside the model potentials’ respective color scales.
Fig. 2.
Fig. 2.
Possible cation–π interaction potentials. (A) Sum of the coarse-grained HPS potential and a model cation–π interaction with a uniform (ϵcπ)ij=3.0 kcal mol1 as a function of residue–residue distance for the residue pairs Arg–Tyr, Arg–Phe, Arg–Trp, Lys–Tyr, Lys–Phe, and Lys–Trp, wherein Tyr, Phe, and Trp are labeled as red, green, and blue, and Arg and Lys are represented by solid and dashed curves. (B) An alternate cation–π potential in which Arg–Tyr/Phe/Trp is significantly more favorable (solid curve; (ϵcπ)ij=1.85 kcal mol1) than Lys–Tyr/Phe/Trp (dashed curve; (ϵcπ)ij=0.65 kcal mol1). Note that the plotted curves here—unlike those in A—do not contain the HPS potential. (C) Normalized CαCα distance-dependent contact frequencies for the aforementioned six cation–π pairs (color coded as in A) computed using a set of 6,943 high-resolution X-ray protein crystal structures (resolution 1.8 Å) from a published nonredundant set (67). Contact pair statistics are collected from residues on different chains in a given structure and residues separated by 50 amino acids along the same chain. CαCα distances are divided into 0.2-Å bins. For each bin, the relative frequency is the number of instances of a cation–π-like contact (defined below) divided by the total number of residue pairs with CαCα distances within the narrow range of the bin. Thus, the shown curves quantify the tendency for a given pair of residues to engage in cation–π interaction provided that the pair is spatially separated by a given CαCα distance. Here a cation–π-like contact is recognized if either a Lys NZ or an Arg NH1 nitrogen atom is within 3.0 Å of any one of the points 1.7 Å above or below an sp2 carbon atom along the normal of the aromatic ring in a Tyr, Phe, or Trp residue. This criterion is exemplified by the molecular drawing (Inset) of a contact between an Arg (at the top) and a Phe (at the bottom). Colors of the chemical bonds indicate types of atom involved, with carbon in black, oxygen in red, and nitrogen in blue. The red dots here are points on the exterior surfaces of the electronic orbitals farthest from the sp2 carbons in the aromatic ring. The blue, green, and red lines emanating from a corner of the aromatic ring constitute a local coordinate frame, with the blue line being the normal vector of the plane of the aromatic ring determined from the positions of its first three atoms. The yellow lines mark spatial separations used to define the cation–π-like contact. These yellow lines do not represent chemical bonds.
Fig. 3.
Fig. 3.
Simulated phase behaviors of Ddx4 IDR variants in a hydrophobicity-dominant potential augmented by cation–π interactions. (A) Sequence patterns of the WT and its charge-scrambled (CS), Phe to Ala (FtoA) and Arg to Lys (RtoK) variants. Select residue types are highlighted: Ala (orange), Asp and Glu (red), Phe (magenta), Lys (cyan), and Arg (dark blue); other residue types are not distinguished. (B) Simulated phase diagrams of WT, CS, FtoA, and RtoK Ddx4 IDR at various relative permittivities (ϵr) as indicated, using the HPS model only (Left) and the HPS model augmented with cation–π interactions (Right) with either (Top) a uniform (ϵcπ)ij as described in Fig. 2A or (Bottom) different (ϵcπ)ij values for Arg and Lys as given in Fig. 2B.
Fig. 4.
Fig. 4.
Simulated phase behaviors of Ddx4 IDR variants using an interaction scheme based largely on PDB-derived statistical potentials. Phase diagrams were computed using the KH model at three different relative permittivities (ϵr).
Fig. 5.
Fig. 5.
Illustrative snapshots of Ddx4N1CS phase behaviors simulated using the KH potential for ϵr=40. (A) A non–phase-separated snapshot at model temperature 375 K, wherein the amino acid residues are colored using the default VMD scheme (91, 92) as provided by the key below the snapshot. (B) Same as A except the color scheme (as shown) is essentially identical to that in Fig. 3A. (C) Same as A and B except all residues along the same chain share the same color. Neighboring chains are colored differently to highlight the diversity of conformations in the system. (DF) A phase-separated snapshot at model temperature 325 K. The color schemes are the same as those in AC, respectively.
Fig. 6.
Fig. 6.
Simulated phase diagrams of LAF-1 IDRs computed by the KH model at ϵr=40 for the three sequences in SI Appendix, Fig. S5. (A) Sequence patterns of the WT and two variants. Highlighted residues are Phe (magenta); Lys (cyan); Arg (dark blue), as in Fig. 3A; and Tyr (pink); other residue types, including Ala, Asp, and Glu which were highlighted in Fig. 3A, are not distinguished here. (B) Phase diagrams for WT and mutant sequences are plotted in different colors as indicated.
Fig. 7.
Fig. 7.
Effects of IDR concentration-dependent relative permittivity on phase behaviors. (A) Relative permittivity ϵr(ϕ) values obtained by atomic simulations (symbols) using various explicit-water models (as indicated at the bottom) are shown as functions of Ddx4 volume fraction ϕ (ϕ=1 corresponds to pure Ddx4). The blue curve is a theoretical fit of the SPC/E, [NaCl] = 100 mM explicit-water simulated data based on the Slab [Bragg and Pippard (114)] model (equation 34 of ref. 37), viz., 1/ϵr(ϕ)=ϕ/ϵp+(1ϕ)/ϵw with the fitted ϵp=18.9 and ϵw=84.5 where ϵp and ϵw are the relative permittivity of pure protein and pure water, respectively. The black solid, dashed, and dashed-dotted lines are approximate linear models of ϵr(ϕ)=ϵpϕ+ϵw(1ϕ) with the same ϵw but different ϵp values as indicated (at the top right), resulting in dϵr(ϕ)/dϕ slopes of 65.6, 83.9, and 42.2. (B and C) Theoretical phase diagrams of the four Ddx4 IDR variants were obtained by a RPA theory that incorporates an ϵr(ϕ) linear in ϕ. Solid, dashed, and dashed-dotted curves correspond, as in A, to the three different ϵp values used in the theory. The electrostatic contribution to the phase behaviors is calculated here using either (B) the expression for fel given in SI Appendix, SI Text, Eq. S51 [i.e., equation 68 of ref. with its self-interaction term G2(k) excluded] or (C) the full expression for fel (equation 68 of ref. or equivalently SI Appendix, SI Text, Eq. S2). Further details are provided in SI Appendix, SI Text.

Similar articles

Cited by

References

    1. Brangwynne C. P., et al. , Germline P granules are liquid droplets that localize by controlled dissolution/condensation. Science 324, 1729–1732 (2009). - PubMed
    1. Li P., et al. , Phase transitions in the assembly of multivalent signalling proteins. Nature 483, 336–340 (2012). - PMC - PubMed
    1. Kato M., et al. , Cell-free formation of RNA granules: Low complexity sequence domains form dynamic fibers within hydrogels. Cell 149, 753–767 (2012). - PMC - PubMed
    1. Nott T. J., et al. , Phase transition of a disordered nuage protein generates environmentally responsive membraneless organelles. Mol. Cell 57, 936–947 (2015). - PMC - PubMed
    1. Molliex A., et al. , Phase separation by low complexity domains promotes stress granule assembly and drives pathological fibrillization. Cell 163, 123–133 (2015). - PMC - PubMed

Publication types

Substances