. 2020 Nov 17;117(46):28950-28959.
doi: 10.1073/pnas.2012495117. Epub 2020 Nov 2.

A biomimetic five-module chimeric antigen receptor (5MCAR) designed to target and eliminate antigen-specific T cells

Affiliations

A biomimetic five-module chimeric antigen receptor (5MCAR) designed to target and eliminate antigen-specific T cells

Shio Kobayashi et al. Proc Natl Acad Sci U S A. .

Abstract

T cells express clonotypic T cell receptors (TCRs) that recognize peptide antigens in the context of class I or II MHC molecules (pMHCI/II). These receptor modules associate with three signaling modules (CD3γε, δε, and ζζ) and work in concert with a coreceptor module (either CD8 or CD4) to drive T cell activation in response to pMHCI/II. Here, we describe a first-generation biomimetic five-module chimeric antigen receptor (5MCAR). We show that 1) chimeric receptor modules built with the ectodomains of pMHCII assemble with CD3 signaling modules into complexes that redirect cytotoxic T lymphocyte (CTL) specificity and function in response to the clonotypic TCRs of pMHCII-specific CD4+ T cells, and 2) surrogate coreceptor modules enhance the function of these complexes. Furthermore, we demonstrate that adoptively transferred 5MCAR-CTLs can mitigate type I diabetes by targeting autoimmune CD4+ T cells in NOD mice. This work provides a framework for the construction of biomimetic 5MCARs that can be used as tools to study the impact of particular antigen-specific T cells in immune responses, and may hold potential for ameliorating diseases mediated by pathogenic T cells.

Keywords: 5M-CAR; CAR; T1D; TCR; pMHC.


Conflict of interest statement

Competing interest statement: M.S.K. and T.S. have disclosed an outside interest in Module Therapeutics to the University of Arizona and the Joslin Diabetes Center. Conflicts of interest resulting from this interest are being managed by The University of Arizona and Joslin Diabetes Center in accordance with their policies. M.S.K. and T.S. are inventors on patent filings covering the intellectual property tested in this study.

Figures
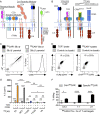
Fig. 1.
Fig. 1.
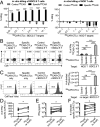
Structure, assembly, and function of biomimetic 5MCARs. (A) The five modules that drive pMHC-specific T cell activation (TCR, CD3γε, CD3δε, CD3ζζ, and CD4/CD8) are compared with a third-generation single-module CAR (1MCAR). (B) The TCR–CD3 complex and CD8 are compared with the CRMpMHCII–CD3 complex and CD80–Lck ScoR of 5MCARs. (C) Flow cytometry plots showing I-Ek, CD3, and CD80 expression on parental 58αβ cells and 5MCAR–58αβ cells. (D) FFLISA of TCR–CD3 and CRMpMHCII–CD3 complexes. Anti-CD3ε beads incubated without lysate (gray), or with lysates from TCR–CD3+ 58αβ cells or 5MCAR–58αβ cells (black), were analyzed by flow cytometry for TCRβ or CRMpMHCIIβ (GFP) and CD3ζ association. (E) IL-2 production by K5:I-Ek, MCC:I-Ek, T102S:I-Ek, T102G:I-Ek, and Hb:I-Ek 5MCAR–58αβ cells after 16-h coculture with parental M12 B cells (TCR, CD28), 2B4 TCR+ M12 cells, or 2B4 TCR+ CD28+ M12 cells as measured by ELISA. Results are shown as the mean ± SD of triplicates (*P < 0.05, **P < 0.01, and ****P < 0.0001, one-way ANOVA with Tukey’s posttest). (F) 5MCAR–CTL killing of CD4+ 5c.c7 TCR Tg T cell targets. Percent killing of targets cocultured with control (Hb:I-Ek) or specific (MCC:I-Ek) 5MCAR–CTLs was measured by flow cytometry and is presented relative to number of targets cultured in the absence of 5MCAR–CTLs. Results are shown as the mean ± SD of triplicates (*P < 0.05, ***P < 0.001, and ****P < 0.0001 by unpaired, two-tailed t test). All data are representative of at least two experiments. Figure is related to SI Appendix, Fig. S1.
Fig. 2.
Fig. 2.
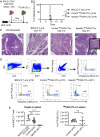
5MCAR–CTLs can target autoimmune CD4+ T cells. (A) 5MCAR–CTL killing of BDC2.5 CD4+ T cell targets (Left) or control NOD CD4+ T cells (Right) after coculture with control (GPI:I-Ag7) or specific (RLGL-WE14:I-Ag7) 5MCAR–CTLs, presented as in Fig. 1 (****P < 0.0001 by unpaired, two-tailed t test). (B) IFNγ production by 5MCAR–CTLs. 5MCAR–CTLs incubated with target BDC2.5 T cells or NOD T cells for 6 h were stained for intracellular IFNγ and gated on live cells. Representative plots are shown. The bar graph shows the frequency of IFNγ-producing 5MCAR–CTLs gated on GFP+CD8+mRaspCD4 cells (****P < 0.0001 by one-way ANOVA and Tukey’s posttest). (C) Proliferation of CellTrace Violet-labeled 5MCAR–CTLs after coculture with or without target BDC2.5 T cells for 3 d. Representative histograms show CellTrace Violet dilution of 5MCAR–CTLs. Bar graphs show the number of dividing 5MCAR–CTLs (****P < 0.0001 by one-way ANOVA and Tukey’s multiple-comparison test). (D) The numbers of specific 4MCAR– (without ScoR) or 5MCAR–CTLs (with ScoR) making IFNγ were measured by flow cytometry after coculture with BDC2.5 T cells for 6 h. (E) IFNγ was measured by ELISA for supernatants after specific 4MCAR– (without ScoR) or 5MCAR– (with ScoR) CTLs coculture with target BDC2.5 T cells for 24 h. (F) The number of divided specific 4MCAR– (without ScoR) or 5MCAR–CTLs (with ScoR) were determined by flow cytometry after coculture with target BDC2.5 T cells for 3 or 4 d. Columns in AC show mean ± SD of triplicates or quadruplicates. Each graph is representative of three independent experiments. Paired data points (connected by lines) in DF represent the mean ± SD of triplicates or quadruplicates for independent experiments (*P < 0.05 by paired, two-tailed t test). Each line represents an independent experiment. Figure is related to SI Appendix, Fig. S2.
Fig. 3.
Fig. 3.
5MCAR–CTLs kill target T cells in vivo. Control (GPI:I-Ag7) or specific (RLGL-WE14:I-Ag7) 5MCAR–CTLs were transferred into NOD mice followed 12 h later with a mixture of mRasp+ BDC2.5 CD4+ T cell targets and CellTrace Violet-labeled NOD CD4+ T cells as a reference population. Then, 5.5 h later, the spleens were analyzed by flow cytometry to evaluate target cell killing. Plots show analysis of target and control cells in representative mice, gated live CD3+CD4+ cells (full gating shown in SI Appendix, Fig. S3). The graph shows the ratio of target cells/control cells as mean ± SD. Each point represents the ratio from a single spleen (*P < 0.05, ***P < 0.001 by one-way ANOVA and Tukey’s posttest). Data are shown as mean ± SD of combined from two independent experiments. Figure is related to SI Appendix, Fig. S3.
Fig. 4.
Fig. 4.
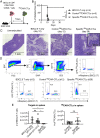
5MCAR–CTLs prevent BDC2.5 CD4+ T cell-induced T1D in NOD-SCID mice. (A) BDC2.5 CD4+ T cells were adoptively transferred into NOD-SCID mice on day 0. On day 1, the mice received 5MCAR–CTLs or were left untreated. (B) Survival curve shows the percentage of diabetes-free mice that were treated with control (GPI:I-Ag7) 5MCAR–CTLs, specific (RLGL-WE14:I-Ag7) 5MCAR–CTLs, or left untreated (BDC2.5 only) (**P < 0.01, ***P < 0.001 by log-rank test). (C) Pancreases of representative mice from each group are shown stained with hematoxylin–eosin (magnification: 4×). Black box Inset shows clear islet (20×; scale bar, 200 μm). (D and E) Analysis of mRasp+ target CD4+ T cells and GFP+ 5MCAR–CTLs in spleens of treated and untreated mice. (D) Gating schematic and representative dot plots show frequencies of targets and 5MCAR–CTLs in spleens. (E) Graphs show absolute cell counts of BDC2.5 CD4+ T cells or 5MCAR–CTLs. The days of recipient analysis are shown for each group. Each point represents an individual recipient. The horizontal lines indicate mean ± SD. **P < 0.01, ****P < 0.0001 by one-way ANOVA and Tukey’s posttest (Bottom, Left) or unpaired, two-tailed t test (Bottom, Right). ns means not statistically significant. Data are representative of two similar independent experiments. Numbers of mice/group are indicated in the figure. Figure is related to SI Appendix, Fig. S4.
Fig. 5.
Fig. 5.
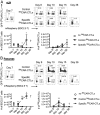
5MCAR–CTLs prevent diabetes after initiation of insulitis. (A) NOD-SCID mice receiving BDC2.5 CD4+ T cells on day 0 were treated with 5MCAR–CTLs on day 7, or left untreated. (B) Survival curve shows the percentage of diabetes-free mice treated with either control (GPI:I-Ag7) 5MCAR–CTLs, specific (RLGL-WE14:I-Ag7) 5MCAR–CTLs, or left untreated (BDC2.5 only) (**P < 0.01, ***P < 0.001 by log-rank test). (C) Pancreases of representative mice from each group, stained with hematoxylin–eosin, are shown (magnification: 4×). Black box Inset shows clear islet (20×; scale bar, 200 μm). (D and E) Analysis of mRasp+ CD4+ T cells and GFP+ 5MCAR–CTLs in spleens of treated and untreated mice. (D) Gating schematic for the analysis and representative dot plots show frequencies of targets and 5MCAR–CTLs in spleens. (E) Graphs show absolute cell counts of BDC2.5 T cells or 5MCAR–CTLs. The days of recipient analysis are shown for each group. Each data point represents an individual recipient. The horizontal lines indicate mean ± SD. *P < 0.05 by one-way ANOVA and Tukey’s multiple-comparison test (Bottom, Left) or by unpaired, two-tailed t test (Bottom, Right). ns means not statistically significant. Data are combined from two independent experiments. Numbers of mice/group are indicated in the figure. Figure is related to SI Appendix, Fig. S5.
Fig. 6.
Fig. 6.
5MCAR–CTLs migrate to the pancreas and eliminate BDC2.5 CD4+ T cells. (A and B) NOD-SCID mice receiving BDC2.5 T cells (day 0) were either treated with control (GPI:I-Ag7) 5MCAR–CTLs, specific (RLGL-WE14:I-Ag7) 5MCAR–CTLs, or killed prior to treatment on day 7. Treated groups were killed on day 8, 10, 15 or 36. Flow cytometry was used to determine the frequency and number of mRasp+ CD4+ BDC2.5 T cells and GFP+ 5MCAR–CTLs in the pLNs (A) or pancreases (B). Representative dot plots show frequencies of target BDC2.5 T cells, and 5MCAR–CTLs (Top, pregated on live, CD11b cells). Graphs show the number of CD4+ BDC2.5 T cells (Left) or the number of 5MCAR–CTLs at each time point (Right). Data show combined results from two independent experiments as mean ± SD. Three to six mice were analyzed for each group and time point (*P < 0.05, **P < 0.01 by unpaired, two-tailed t test between the control and specific 5MCAR–CTLs groups). † means no data. Figure is related to SI Appendix, Fig. S6.
Fig. 7.
Fig. 7.
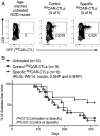
Treatment with an oligoclonal set of specific 5MCAR–CTLs decreases diabetes incidence in NOD mice. Newborn NOD mice received control (GPI:I-Ag7) 5MCAR–CTLs, a mixture of specific 5MCAR–CTLs targeting four populations of T1D-related autoimmune T cell (INSB:I-Ag7, HIP2.5:I-Ag7, HIP6.9:I-Ag7, and RLGL-WE14:I-Ag7), or were left untreated. (A) A subset of male mice were killed at 13 wk of age, and their spleens were analyzed by flow cytometry. 5MCAR–CTLs were identified by CD8 and GFP expression (pregated on live, CD3+ cells). Plots from representative engrafted mice are shown (five of five control 5MCAR–CTL recipients engrafted; five of six specific 5MCAR–CTL recipients engrafted). (B) Female mice were screened weekly for glycosuria from day 32 to day 315 and cumulative incidence of diabetes (survival probability plots based on the Kaplan–Meier method) is shown with exact P values determined by log-rank test. Data show the combined results from three independent cohorts. Numbers of mice/group are indicated in the figure. Figure is related to SI Appendix, Fig. S7.

Similar articles

Cited by

References

    1. Zehn D., Lee S. Y., Bevan M. J., Complete but curtailed T-cell response to very low-affinity antigen. Nature 458, 211–214 (2009). - PMC - PubMed
    1. Tubo N. J., et al. , Single naive CD4+ T cells from a diverse repertoire produce different effector cell types during infection. Cell 153, 785–796 (2013). - PMC - PubMed
    1. Zhu J., Yamane H., Paul W. E., Differentiation of effector CD4 T cell populations (*). Annu. Rev. Immunol. 28, 445–489 (2010). - PMC - PubMed
    1. Jameson S. C., Masopust D., Understanding subset diversity in T cell memory. Immunity 48, 214–226 (2018). - PMC - PubMed
    1. Josefowicz S. Z., Lu L. F., Rudensky A. Y., Regulatory T cells: Mechanisms of differentiation and function. Annu. Rev. Immunol. 30, 531–564 (2012). - PMC - PubMed

Publication types