. 2020 Nov 2;11(1):5540.
doi: 10.1038/s41467-020-19264-0.

APOE4 exacerbates synapse loss and neurodegeneration in Alzheimer's disease patient iPSC-derived cerebral organoids

Affiliations

APOE4 exacerbates synapse loss and neurodegeneration in Alzheimer's disease patient iPSC-derived cerebral organoids

Jing Zhao et al. Nat Commun. .

Erratum in

Abstract

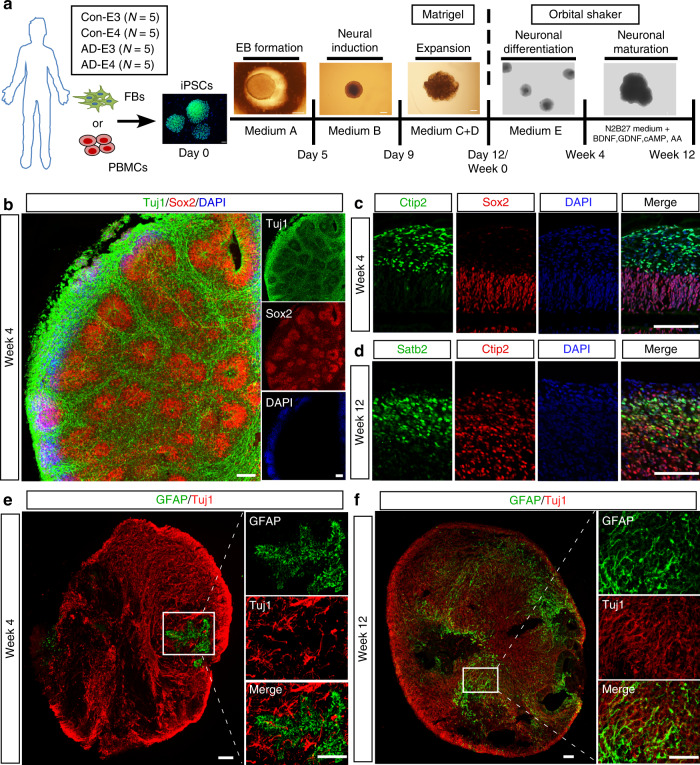
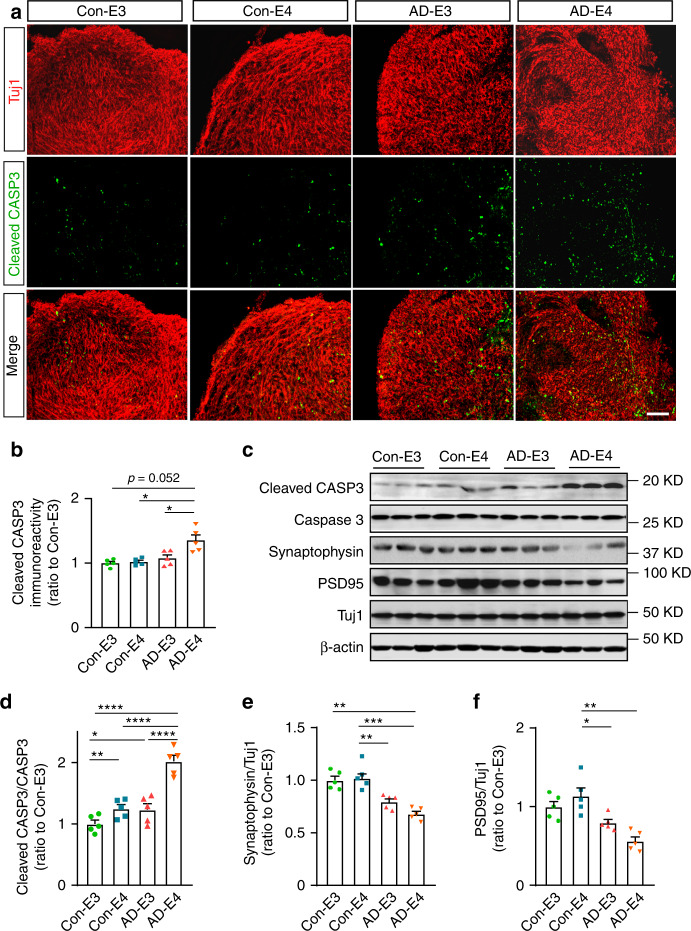
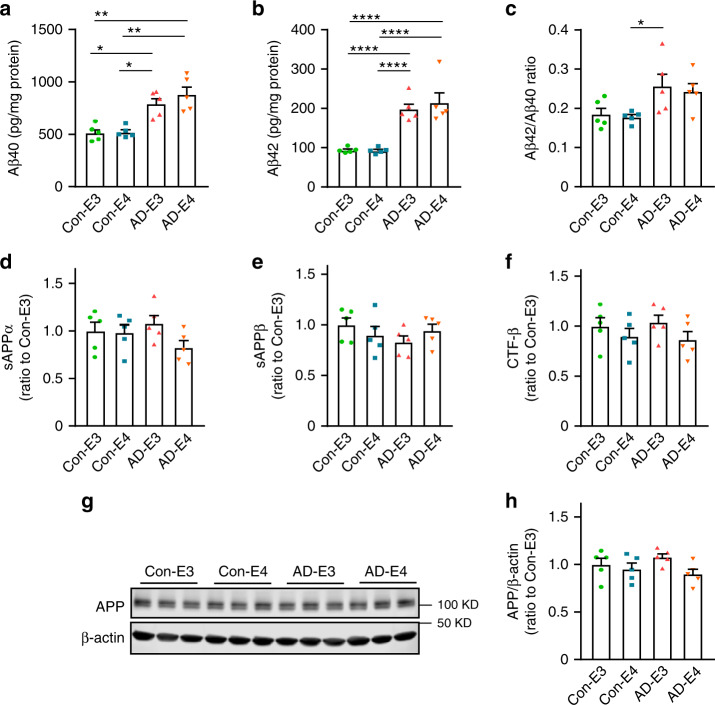
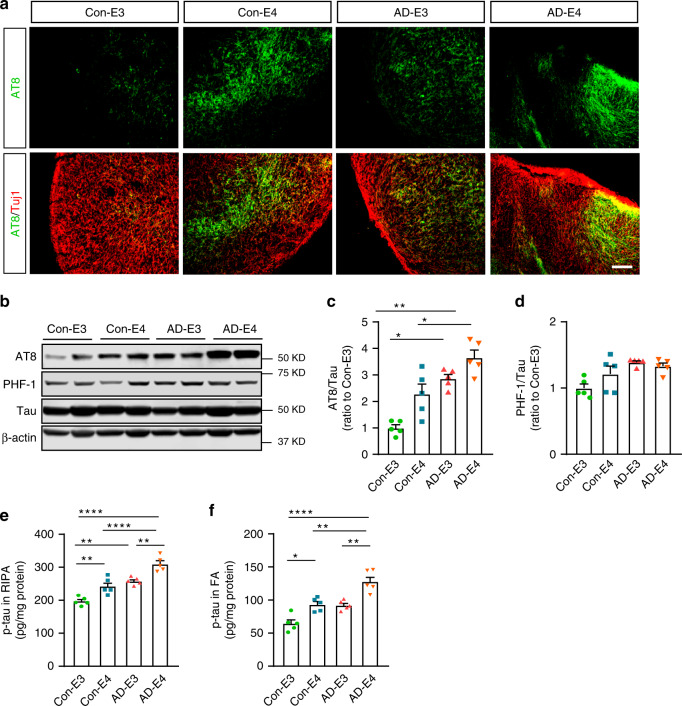
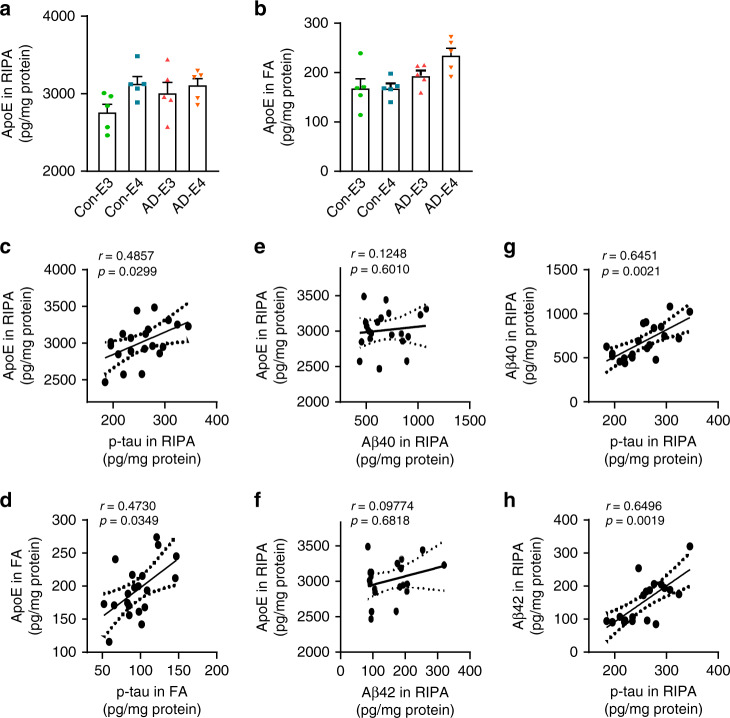
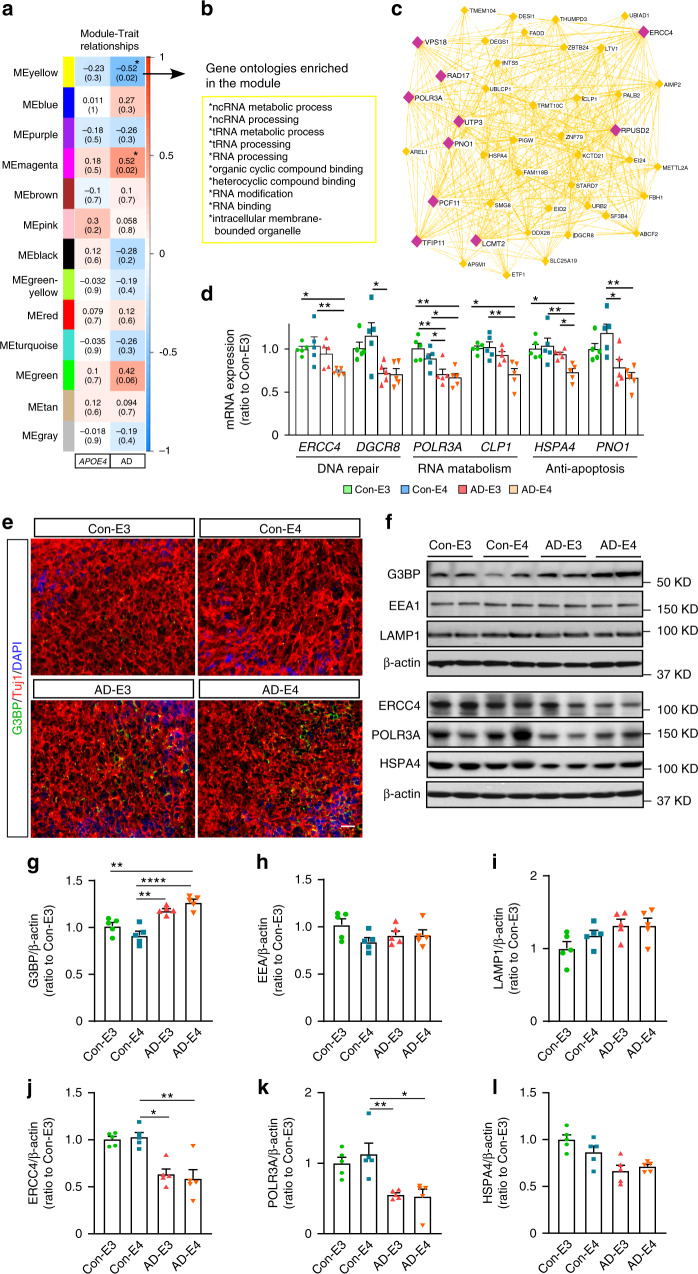
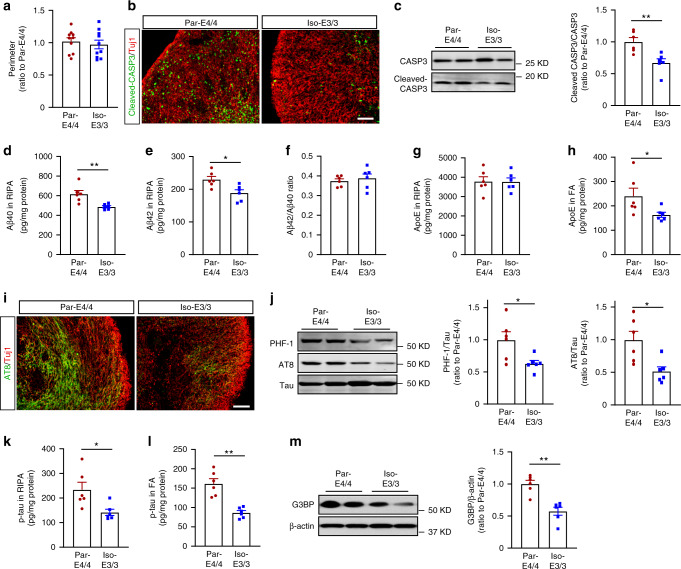
APOE4 is the strongest genetic risk factor associated with late-onset Alzheimer's disease (AD). To address the underlying mechanism, we develop cerebral organoid models using induced pluripotent stem cells (iPSCs) with APOE ε3/ε3 or ε4/ε4 genotype from individuals with either normal cognition or AD dementia. Cerebral organoids from AD patients carrying APOE ε4/ε4 show greater apoptosis and decreased synaptic integrity. While AD patient-derived cerebral organoids have increased levels of Aβ and phosphorylated tau compared to healthy subject-derived cerebral organoids, APOE4 exacerbates tau pathology in both healthy subject-derived and AD patient-derived organoids. Transcriptomics analysis by RNA-sequencing reveals that cerebral organoids from AD patients are associated with an enhancement of stress granules and disrupted RNA metabolism. Importantly, isogenic conversion of APOE4 to APOE3 attenuates the APOE4-related phenotypes in cerebral organoids from AD patients. Together, our study using human iPSC-organoids recapitulates APOE4-related phenotypes and suggests APOE4-related degenerative pathways contributing to AD pathogenesis.


Conflict of interest statement

The authors declare no competing interests.

Figures

Fig. 1
Fig. 1. Generation and characterization of cerebral organoids from human iPSCs.
a A schematic overview of the procedures for generating cerebral organoids from human iPSCs using the STEMdiff™ Cerebral Organoid Kit. b Representative images of the ventricular zone (VZ)-like structure formed by new-born neurons (Tuj1, green) and neural progenitor cells (Sox2, red) in cerebral organoids at week 4 of differentiation. c, d Confocal images showed the cortical layer structure formation when immunostained for Ctip2 (deep cortical layer marker) and Satb2 (superficial cortical layer marker) at week 4 (c) and 12 (d), respectively. e, f Proliferation and migration of astrocytes within cerebral organoids; the differentiation pattern of astrocytes in organoids were monitored by GFAP immunostaining (astrocytic marker) at week 4 (e) and 12 (f), respectively. Scale bar: 100 μm.
Fig. 2
Fig. 2. APOE4 enhances apoptosis and synaptic loss in cerebral organoids from AD patients.
cerebral organoids were subjected to immunostaining and western blotting at week 12. a Representative images and quantification of cellular apoptosis evaluated by immunostaining of cleaved CASP3. Scale bar: 100 μm. b Cleaved CASP3 immunoreactivities were quantified from 5 cerebral organoids per line, and the averaged values were compared among the groups (APOE4: p = 0.032, AD: p = 0.0569, APOE4 x AD: p = 0.018, Con-E3 vs. AD-E4: p = 0.0523, Con-E4 vs. AD-E4: p = 0.0112, AD-E3 vs. AD-E4: p = 0.014). All data are expressed as mean ± SEM (N = 5). cf Cleaved CASP3, CASP3, synaptophysin, PSD95, and Tuj1 levels in the lysates of 4–5 cerebral organoids per line were analyzed by western blotting and quantified. All data are expressed as mean ± SEM (N = 5). d Cleaved CASP3 levels were normalized to total CASP3 levels and compared among groups (APOE4: p < 0.0001, AD: p < 0.0001, APOE4 x AD: p = 0.0020, Con-E3 vs. Con-E4: p = 0.009, Con-E3 vs. AD-E3: p = 0.0206, Con-E4 vs. AD-E4: p < 0.0001, AD-E3 vs. AD-E4: p < 0.0001). Synaptophysin and PSD95 levels were normalized to Tuj1 levels and compared among groups (e APOE4: p = 0.5841, AD: p = 0.0002, APOE4 x AD: p = 0.0453, Con-E3 vs. AD-E4: p = 0.0069, Con-E4 vs. AD-E4: p = 0.0002, Con-E4 vs. AD-E3: p = 0.0077. f APOE4: p = 0.8794, AD: p = 0.0025, APOE4 x AD: p = 0.0551, Con-E4 vs. AD-E3: p = 0.0404, Con-E4 vs. AD-E4: 0.0019). ANCOVA for APOE4, AD status, and APOE4 x AD status was performed by including sex, sampling age, and source of iPSCs as co-variables, which was followed by two-sided Tukey–Kramer tests to compare between the groups with two factors (APOE4 and AD status). *p < 0.05, **p < 0.01, ***p < 0.001, ****p < 0.0001.
Fig. 3
Fig. 3. Increased Aβ accumulation in iPSC-derived cerebral organoids from AD patients.
Lysates of 4–5 cerebral organoids per iPSC line were analyzed by ELISA and western blotting at week 12. ac Amounts of Aβ40 (a; APOE4: p = 0.2167, AD: p = 0.0002, APOE4 x AD: p = 0.4849, Con-E3 vs. AD-E3: p = 0.0287, Con-E3 vs. AD-E4: p = 0.0028, Con-E4 vs. AD-E3: p = 0.0171, Con-E4 vs. AD-E4: p = 0.0011) and Aβ42 (b; APOE4: p = 0.1014, AD: p < 0.0001, APOE4 x AD: p = 0.7778, Con-E3 vs. AD-E3: p < 0.0001, Con-E3 vs. AD-E4: p < 0.0001, Con-E4 vs. AD-E3: p < 0.0001, Con-E4 vs. AD-E4: p < 0.0001) in the RIPA fraction were measured by ELISA. Data were normalized to the total protein concentration of the respective sample. The ratio of Aβ42/Aβ40 was calculated accordingly (c; APOE4: p = 0.9549, AD: p = 0.0034, APOE4 x AD: p = 0.5331, Con-E4 vs. AD-E3: p = 0.0397). df Amounts of sAPPα (d; APOE4: p = 0.1081, AD: p = 0.8009, APOE4 x AD: p = 0.1351), sAPPβ (E; APOE4: p = 0.7772, AD: p = 0.4410, APOE4 x AD: p = 0.0936) and CTF-β (f; APOE4: p = 0.1150, AD: p = 0.5326, APOE4 x AD: p = 0.9877) in RIPA were measured by ELISA. Data are shown as ratios to Con-E3 after normalization to total protein concentration. g, h Amounts of full-length APP were assessed by western blotting analysis using 22C11 monoclonal antibody in RIPA lysate (APOE4: p = 0.0331, AD: p = 0.6706, APOE4 x AD: p = 0.3170). All data are expressed as mean ± SEM (N = 5). ANCOVA for APOE4, AD status, and APOE4 x AD status was performed by including sex, sampling age, and source of iPSCs as co-variables, which was followed by two-sided Tukey–Kramer tests to compare between the groups with two factors (APOE4 and AD status). *p < 0.05, **p < 0.01, ****p < 0.0001.
Fig. 4
Fig. 4. APOE4 and AD status enhance p-tau levels in iPSC-derived cerebral organoids.
Cerebral organoids were subjected to analyses by immunostaining, western blotting, and ELISA at week 12. a Representative images of the immunostaining for p-tau with AT8 (Ser202/Thr205) antibody. Scale bar: 100 μm. bd Total tau and p-tau levels in the RIPA lysates of 4–5 cerebral organoids per line were analyzed by western blotting and quantified. The p-tau levels detected by AT8 antibody (c; APOE4: p = 0.0037, AD: p = 0.0010, APOE4 x AD p = 0.6128, Con-E3 vs. AD-E3: p = 0.0290, Con-E3 vs. AD-E4: p = 0.0010, Con-E4 vs. AD-E4: p = 0.0273) and PHF1 (Ser396/Ser404) (d; APOE4: p = 0.3742, AD: p = 0.0404, APOE4 x AD: p = 0.1823) were normalized to total tau. e, f Amounts of p-tau in the RIPA fraction (e; APOE4: p < 0.0001, AD: p < 0.0001, APOE4 x AD: p = 0.7063, Con-E3 vs. Con-E4: p = 0.0029, Con-E3 vs. AD-E3: p = 0.0015, Con-E3 vs. AD-E4: p < 0.0001, Con-E4 vs. AD-E4: p < 0.0001, AD-E3 vs. AD-E4: p = 0.0010) and the FA fraction (f; APOE4: p < 0.0001, AD: p = 0.0005, APOE4 x AD: p = 0.4038, Con-E3 vs. Con-E4: p = 0.0121, Con-E3 vs. AD-E4: p < 0.0001, Con-E4 vs. AD-E4: p = 0.0024, AD-E3 vs. AD-E4: p = 0.0012) from 4 to 5 cerebral organoids per line were measured by ELISA. Data were normalized to individual total protein concentration. All data are expressed as mean ± SEM (N = 5). ANCOVA for APOE4, AD status, and APOE4 x AD status was performed by including sex, sampling age, and source of iPSCs as co-variables, which was followed by two-sided Tukey–Kramer tests to compare between the groups with two factors (APOE4 and AD status). *p < 0.05, **p < 0.01, ****p < 0.0001.
Fig. 5
Fig. 5. Positive correlation between apoE and p-tau levels in the iPSC-derived cerebral organoids.
a, b Amounts of apoE in the RIPA fraction (a; APOE4: p = 0.0322, AD: p = 0.3691, APOE4 x AD: p = 0.4301) and the FA fraction (b; APOE4: p = 0.641, AD: p = 0.0244, APOE4 x AD: p = 0.4023) of 4–5 cerebral organoids per line were measured by ELISA at week 12. Data were normalized to individual total protein concentration. All data are expressed as mean ± SEM (N = 5). ANCOVA for APOE4, AD status, and APOE4 x AD status was performed by including sex, sampling age, and source of iPSCs as co-variables, which was followed by two-sided Tukey–Kramer tests to compare between the groups with two factors (APOE4 and AD status). ch Two-sided Spearman correlation analysis (before adjustment) of apoE vs. p-tau in RIPA (c) and FA (d) fractions, apoE vs. Aβ40 (e) or Aβ42 (f) in RIPA fraction, and p-tau vs. Aβ40 (g) or Aβ42 (h) in RIPA fraction.
Fig. 6
Fig. 6. Transcriptomics profiling of the iPSC-derived cerebral organoids by WGCNA.
a Module-trait relationships between modules and APOE genotype, and between modules and AD status are shown. b, c Top gene ontologies and interaction of genes enriched in the yellow module genes. Purple nodes are hub genes (top 10 highest connectivity). d The mRNA expressions of ERCC4 (APOE4: p = 0.0576, AD: p = 0.0064, APOE4 x AD: p = 0.0742, Con-E3 vs. AD-E4: p = 0.0164, Con-E4 vs. AD-E4: p = 0.0049), DGCR8 (APOE4: p = 0.1088, AD: p = 0.0469, APOE4 x AD: p = 0.3298, Con-E4 vs. AD-E3: p = 0.0409), POLR3A (APOE4: p = 0.3926, AD: p = 0.0004, APOE4 x AD: p = 0.1349, Con-E3 vs. AD-E3: p = 0.0048, Con-E3 vs. AD-E4: p = 0.0084, Con-E4: AD-E3: p = 0.0221, Con-E4 vs. AD-E4: p = 0.0484), CLP1 (APOE4: p = 0.0953, AD: p = 0.0039, APOE4 x AD: p = 0.1831, Con-E3 vs. AD-E4: p = 0.0157, Con-E4 vs. AD-E4: p = 0.0066), HSPA4 (APOE4: p = 0.0501, AD: p = 0.0077, APOE4 x AD: p = 0.0410, Con-E3 vs. AD-E4: p = 0.0171, Con-E4 vs. AD-E4: p = 0.0038, AD-E3 vs. AD-E4: p = 0.0339), and PNO1 (APOE4: p = 0.8087, AD: p = 0.0022, APOE4 x AD: p = 0.1706, Con-E4 vs. AD-E3: p = 0.0218, Con-E4 vs. AD-E4: p = 0.0038) were quantified by RT-qPCR. e Representative images of the immunostaining for G3BP and Tuj1. Scale bar: 50 μm. fi G3BP, EEA1, and LAMP1 levels were analyzed by western blotting. The levels of G3BP (g; APOE4: p = 0.6345, AD: p < 0.0001, APOE4 x AD: p = 0.0133, Con-E3 vs. AD-E4: p = 0.0025, Con-E4 vs. AD-E3: p = 0.0019, Con-E4 vs. AD-E4: p < 0.0001), EEA1 (h; APOE4: p = 0.2792, AD: p = 0.6789, APOE4 x AD: p = 0.0671), and LAMP1 (I; APOE4: p = 0.2558, AD: p = 0.0954, APOE4 x AD: p = 0.5646) were normalized to β-actin. jl ERCC4, POLR3A, and HSPA4 were analyzed by western blotting. The levels of ERCC4 (j; APOE4: p = 0.9762, AD: p = 0.0016, APOE4 x AD: p = 0.3378, Con-E4 vs. AD-E3: p = 0.0241, Con-E4 vs. AD-E4: p = 0.0054), POLR3A (k; APOE4: p = 0.2095, AD: p = 0.0018, APOE4 x AD: p = 0.7764, Con-E4 vs. AD-E3: p = 0.0048, Con-E4 vs. AD-E4: p = 0.0149), and HSPA4 (l; APOE4: p = 0.6526, AD: p = 0.0152, APOE4 x AD: p = 0.2371) were normalized to β-actin. All data are expressed as mean ± SEM (N = 5). ANCOVA for APOE4, AD status, and APOE4 x AD status was performed by including sex, sampling age, and source of iPSCs as co-variables, which was followed by two-sided Tukey–Kramer tests to compare between the groups with two factors (APOE4 and AD status). *p < 0.05, **p < 0.01, ****p < 0.0001.
Fig. 7
Fig. 7. Isogenic conversion of APOE4 to APOE3 attenuates AD-related phenotypes in cerebral organoids.
The iPSC-derived cerebral organoids from an AD patient carrying APOE ε4/ε4 (Par-E4/4) and the APOE ε3/ε3 isogenic line (Iso-E3/3) were analyzed at week 12. a The perimeters of cerebral organoids were measured (n = 10). b Representative images of cellular apoptosis with the immunostaining for cleaved CASP3. Scale bar: 100 μm. c Cleaved CASP3 and CASP3 levels in the lysates were analyzed by western blotting and quantified (p = 0.0043). df Amounts of Aβ40 (d: p = 0.0043) and Aβ42 (e: p = 0.0152) in RIPA fraction were measured by ELISA. Data were normalized to individual protein concentrations. The ratio of Aβ42/Aβ40 (f) was calculated accordingly. g, h Amounts of apoE in RIPA (g) and FA (h: p = 0.0411) were measured by ELISA. Data were normalized to individual total protein concentrations. i Representative images of the immunostaining for p-tau with AT8 antibody. Scale bar: 100 µm. j Total tau and p-tau in RIPA lysates were analyzed by western blotting and quantified. The p-tau detected by AT8 antibody and PHF1 antibody were normalized to total tau (AT8: p = 0.0152, PHF1: p = 0.0411). k, l Amounts of p-tau in RIPA (k: p = 0.0152) and FA (l: p = 0.0022) were measured by ELISA. Data were normalized to individual total protein concentration. m G3BP, levels in RIPA lysates were analyzed by western blotting and quantified. The levels of G3BP were normalized to β-actin (p = 0.0022). ch, jm Lysates of 4–5 cerebral organoids were analyzed as one sample. All data are expressed as mean ± SEM (n = 6). Two-sided Mann–Whitney U tests were performed to determined statistical significance, *p < 0.05, **p < 0.01.

Comment in

Similar articles

Cited by

References

    1. Selkoe DJ. Toward a remembrance of things past: deciphering Alzheimer disease. Harvey Lect. 2003;99:23–45. - PubMed
    1. Jack CR, Jr., et al. Hypothetical model of dynamic biomarkers of the Alzheimer’s pathological cascade. Lancet Neurol. 2010;9:119–128. - PMC - PubMed
    1. DeTure MA, Dickson DW. The neuropathological diagnosis of Alzheimer’s disease. Mol. Neurodegener. 2019;14:32. - PMC - PubMed
    1. Corder EH, et al. Gene dose of apolipoprotein E type 4 allele and the risk of Alzheimer’s disease in late onset families. Science. 1993;261:921–923. - PubMed
    1. Kim J, Basak JM, Holtzman DM. The role of apolipoprotein E in Alzheimer’s disease. Neuron. 2009;63:287–303. - PMC - PubMed

Publication types