. 2020 Nov 2;11(1):5538.
doi: 10.1038/s41467-020-19215-9.

Allomorphy as a mechanism of post-translational control of enzyme activity

Affiliations

Allomorphy as a mechanism of post-translational control of enzyme activity

Henry P Wood et al. Nat Commun. .

Abstract

Enzyme regulation is vital for metabolic adaptability in living systems. Fine control of enzyme activity is often delivered through post-translational mechanisms, such as allostery or allokairy. β-phosphoglucomutase (βPGM) from Lactococcus lactis is a phosphoryl transfer enzyme required for complete catabolism of trehalose and maltose, through the isomerisation of β-glucose 1-phosphate to glucose 6-phosphate via β-glucose 1,6-bisphosphate. Surprisingly for a gatekeeper of glycolysis, no fine control mechanism of βPGM has yet been reported. Herein, we describe allomorphy, a post-translational control mechanism of enzyme activity. In βPGM, isomerisation of the K145-P146 peptide bond results in the population of two conformers that have different activities owing to repositioning of the K145 sidechain. In vivo phosphorylating agents, such as fructose 1,6-bisphosphate, generate phosphorylated forms of both conformers, leading to a lag phase in activity until the more active phosphorylated conformer dominates. In contrast, the reaction intermediate β-glucose 1,6-bisphosphate, whose concentration depends on the β-glucose 1-phosphate concentration, couples the conformational switch and the phosphorylation step, resulting in the rapid generation of the more active phosphorylated conformer. In enabling different behaviours for different allomorphic activators, allomorphy allows an organism to maximise its responsiveness to environmental changes while minimising the diversion of valuable metabolites.


Conflict of interest statement

The authors declare no competing interest.

Figures

Fig. 1
Fig. 1. βPGM catalytic cycle.
βPGM reaction scheme for the enzymatic conversion of βG1P to G6P via a βG16BP intermediate. The phosphoryl transfer reaction between phospho-enzyme (βPGMP, phosphorylated at residue D8) and βG1P is illustrated with the transferring phosphate (blue) in the proximal site and the 1-phosphate (red) of βG1P in the distal site. The  phosphoryl transfer reaction between βPGM and βG16BP is shown with the transferring phosphate (red) in the proximal site and the 6-phosphate (blue) of βG16BP in the distal site.
Fig. 2
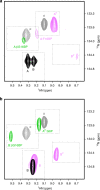
Fig. 2. Effect of different phosphorylating agents on βPGM.
a, b Overlays of a section of 1H15N-TROSY spectra highlighting the behaviour of residue A113. a βPGMWT (black) populates conformer A and conformer B in slow exchange. βPGMWT supplemented with F16BP (pink) populates phosphorylated conformer A (AP) as the dominant species, phosphorylated conformer B (BP) and a βPGMWT:F16BP species (A:F16BP). βPGMWT supplemented with βG16BP (green) populates an A:βG16BP complex. b βPGMP146A (black) populates one conformer (conformer B). βPGMP146A supplemented with F16BP (pink) populates conformer B and BP. βPGMP146A supplemented with βG16BP (green) populates a AP:G6P complex and a B:βG16BP complex. Peaks indicated by grey asterisks correspond to the βPGMWT:BeF3 complex (grey; δN = 133.5 ppm; BMRB 17851), which is an analogue of AP, and the Mg2+-saturated βPGMD10N:βG16BP complex (grey; δN = 133.8 ppm; BMRB 27174), which is a mimic of the A:βG16BP complex, and are shown for comparison.
Fig. 3
Fig. 3. Exchange behaviour in βPGMWT.
Crystal structure of βPGMWT (PDB 2WHE) showing residues of βPGMWT undergoing conformational exchange on different timescales. Residues that populate two conformations in slow exchange are coloured in shades of blue according to chemical shift differences between conformer A and conformer B, with the intensity of colour and thickness of the backbone corresponding to larger values. Residues in conformer A and conformer B with missing backbone amide peaks in the 1H15N-TROSY spectrum of βPGMWT are coloured black, whereas missing backbone amide peaks in conformer B only are coloured purple. The amide 1H15N coherences are likely broadened beyond detection owing to intermediate exchange on the millisecond timescale. The catalytic Mg2+ ion is indicated as a green sphere.
Fig. 4
Fig. 4. Conformational plasticity of the active site of βPGM.
a, b Active sites of βPGMWT (as conformer A) and βPGMP146A superposed on the core domain. a Selected residues are shown as sticks for the crystal structures of βPGMWT (grey carbon atoms; PDB 6YDL) and βPGMP146A (dark green carbon atoms; PDB 6YDK). In βPGMWT, a cis K145–P146 peptide bond allows coordination of the K145 sidechain by E169 and A113, whereas in βPGMP146A a trans K146-A146 peptide bond changes significantly the backbone conformation of the D137–A147 loop, which precludes active site engagement of the K145 sidechain. The catalytic Mg2+ ion is drawn as a green sphere, black dashes indicate metal ion coordination and orange dashes show probable hydrogen bonds. b Selected residues, the MgF3 moiety and G6P are shown as sticks for the crystal structures of the βPGMWT:MgF3:G6P TSA complex (grey carbon atoms; PDB 2WF5) and the βPGMP146A:MgF3:G6P TSA complex (dark green carbon atoms; PDB 6YDJ). βPGMWT maintains the cis K145–P146 peptide bond, whereas βPGMP146A changes the isomerisation state of the K145–A146 peptide bond from a trans conformation in the substrate-free enzyme to a cis conformation in the transition state. c, d Omit maps generated by refinement in the absence of residues S144–P148 in βPGMP146A. c The S144–P148 segment, containing a trans K145–A146 peptide bond, with positive difference density (Fo–Fc; green mesh contoured at +2.5σ) in substrate-free βPGMP146A. d The S144–P148 segment, containing a cis K145–A146 peptide bond, with positive difference density (Fo–Fc; green mesh contoured at +2.5σ) in the βPGMP146A:MgF3:G6P TSA complex.
Fig. 5
Fig. 5. Kinetic profiles of βPGM activity.
a, b Reaction kinetics for the conversion of βG1P to G6P catalysed by βPGMWT and βPGMP146A. The rate of G6P production was measured indirectly using a glucose 6-phosphate dehydrogenase coupled assay, in which G6P is oxidised and concomitant NAD+ reduction is monitored by the increase in absorbance at 340 nm. Reaction catalysed by either a βPGMWT or b βPGMP146A in standard kinetic buffer using either F16BP (circles), AcP (squares) or βG16BP (diamonds) as a phosphorylating agent. For clarity, between 100 and 8% of the data points are included in the kinetic profiles. Following βG1P substrate depletion, the kinetic profiles show an apparent increase in G6P concentration, which results from: (1) the concentration of the reaction ingredients through evaporation from the assay plate wells and (2) for the reactions recorded using βG16BP, the enzyme-dependent conversion of remaining βG16BP to G6P via βPGMP, occurring at a rate proportional to the amount of enzyme.
Fig. 6
Fig. 6. Kinetic model of βPGM activity.
a, b Reaction schemes for βPGMWT as conformer A or conformer B with different phosphorylating agents. The favoured pathways are shown (red text) for βPGMWT with a F16BP as a phosphorylating agent and b βG16BP as a phosphorylating agent. The βG16BP generating steps are highlighted in blue text. Fructose monophosphate (FMP) is either fructose 6-phosphate or fructose 1-phosphate. The complexes X:P1G6P (X = A or B) and A:P6G1P denote explicitly the orientation of βG16BP bound in the active site. The double-headed arrows connecting AP and BP indicate that these species interconvert with a multi-second exchange rate, similar to that described for the interconversion of conformer A and conformer B.
Fig. 7
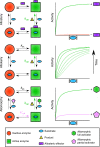
Fig. 7. Mechanisms of regulation and activity profiles in monomeric enzymes.
In allostery, binding (or reaction) of an allosteric effector (purple rectangle) outside of the active site shifts the enzyme population from an inactive form (red circle and red profile) to an active form (green square and green profile), which stimulates the transformation of substrate (blue oval) to product (yellow triangle) at the catalytic rate (kcat, green arrow). In allokairy, binding of substrate in the active site shifts the enzyme population from an inactive form to an active form, at an exchange rate (kex) that is similar to kcat, resulting in time-dependent activity profiles (gradient of light green to dark green profiles). Following exhaustion of substrate, the enzyme population returns to the original equilibrium position. In allomorphy, reaction of the activating substrate, termed here allomorphic full activator (green hexagon), in the active site shifts the enzyme population from an inactive form to an active form, which stimulates the transformation of the native substrate (blue oval) to product (yellow triangle) at the maximal catalytic rate (kcat, green arrow and green profile). However, reaction of alternatives substrates, termed here allomorphic partial activators (pink pentagon), in the active site are unable to shift the enzyme population from an inactive form to an active form, resulting in a slower overall catalytic rate (k’cat, pink arrow and pink profile). The exchange rate (kex) between the two enzyme forms is much slower than kcat. Following exhaustion of the allomorphic activator, the enzyme population returns to the original equilibrium position.

References

    1. Jacob F, Monod J. Genetic regulatory mechanisms in the synthesis of proteins. J. Mol. Biol. 1961;3:318–356. doi: 10.1016/S0022-2836(61)80072-7. - DOI - PubMed
    1. Monod J, Changeux JP, Jacob F. Allosteric proteins and cellular control systems. J. Mol. Biol. 1963;6:306–329. doi: 10.1016/S0022-2836(63)80091-1. - DOI - PubMed
    1. Wegner A, Meiser J, Weindl D, Hiller K. How metabolites modulate metabolic flux. Curr. Opin. Biotechnol. 2015;34:16–22. doi: 10.1016/j.copbio.2014.11.008. - DOI - PubMed
    1. Pardee AB. Regulatory molecular biology. Cell Cycle. 2006;5:846–852. doi: 10.4161/cc.5.8.2634. - DOI - PubMed
    1. Iommarini L, Ghelli A, Gasparre G, Porcelli AM. Mitochondrial metabolism and energy sensing in tumor progression. Biochim. Biophys. Acta. Bioenerg. 2017;1858:582–590. doi: 10.1016/j.bbabio.2017.02.006. - DOI - PubMed

Publication types

MeSH terms