

Pharmacokinetic-pharmacodynamic modelling of the hypoglycaemic effect of pulsatile administration of human insulin in rats
- PMID: 33139788
- PMCID: PMC7608663
- DOI: 10.1038/s41598-020-76007-3
Pharmacokinetic-pharmacodynamic modelling of the hypoglycaemic effect of pulsatile administration of human insulin in rats
Abstract
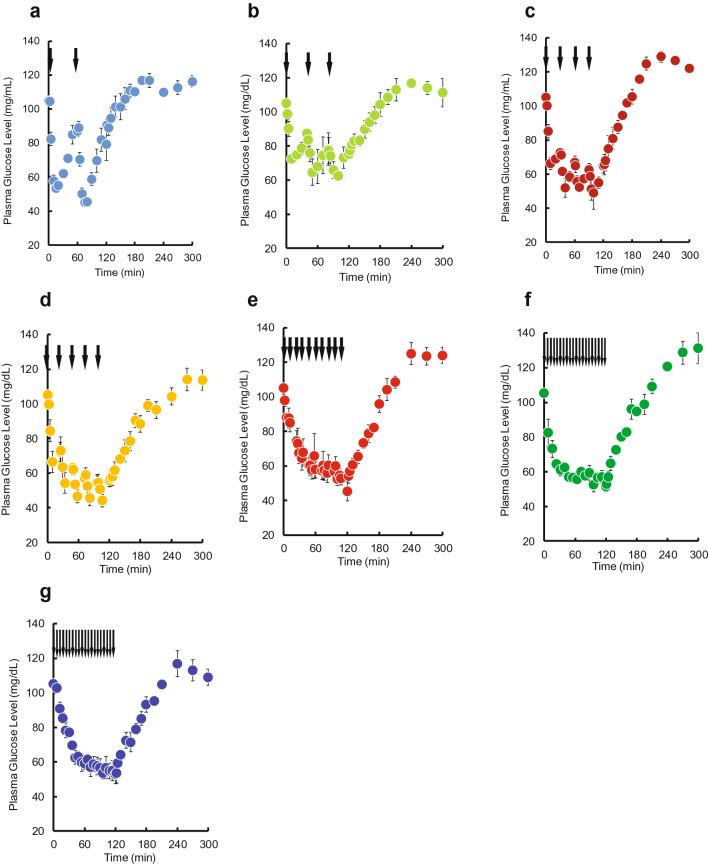
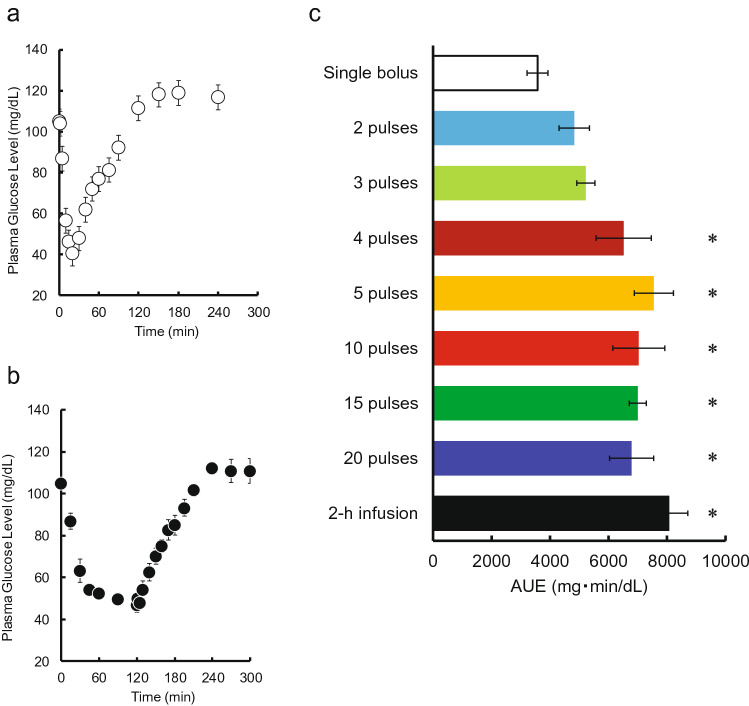
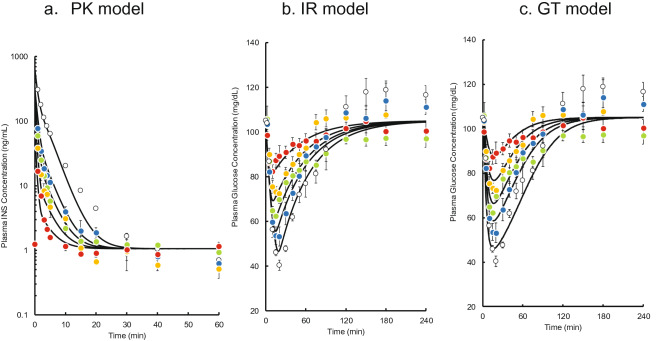
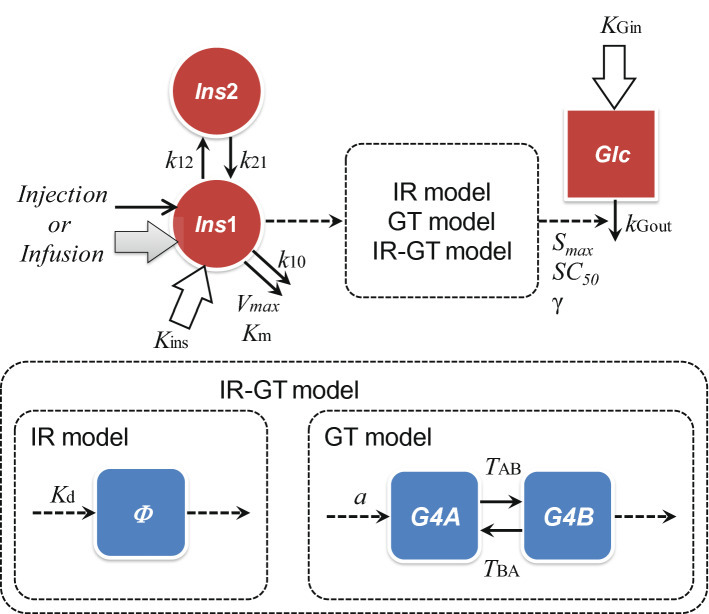
The relationship between the plasma insulin (INS) concentration-time course and plasma glucose concentration-time course during and after pulsatile INS administration to rats was characterized using a pharmacokinetic-pharmacodynamic (PK-PD) model. A total INS dose of 0.5 IU/kg was intravenously injected in 2 to 20 pulses over a 2-h period. Compared with the single bolus administration, the area under the effect-time curve (AUE) increased depending on the number of pulses, and the AUEs for more than four pulses plateaued at a significantly larger value, which was similar to that after the infusion of a total of 0.5 IU/kg of INS over 2 h. No increase in plasma INS concentration occurred after pulsatile administration. Two indirect response models primarily reflecting the receptor-binding process (IR model) or glucose transporter 4 (GLUT4) translocation (GT model) were applied to describe the PK-PD relationship after single intravenous bolus administration of INS. These models could not explain the observed data after pulsatile administration. However, the IR-GT model, which was a combination of the IR and GT models, successfully explained the effects of pulsatile administration and intravenous infusion. These results indicate that the receptor-binding process and GLUT4 translocation are responsible for the change in AUE after pulsatile administration.
Conflict of interest statement
The authors declare no competing interests.
Figures


Similar articles
-
Pharmacokinetic-pharmacodynamic modelling of insulin: comparison of indirect pharmacodynamic response with effect-compartment link models.J Pharm Pharmacol. 2002 Jun;54(6):791-800. doi: 10.1211/0022357021779131. J Pharm Pharmacol. 2002. PMID: 12078995
-
Pharmacokinetic-pharmacodynamic modelling of human insulin: validity of pharmacological availability as a substitute for extent of bioavailability.J Pharm Pharmacol. 2001 Sep;53(9):1235-46. doi: 10.1211/0022357011776685. J Pharm Pharmacol. 2001. PMID: 11578106
-
Pharmacokinetic and pharmacodynamic modelling of the effects of glimepiride on insulin secretion and glucose lowering in healthy humans.J Clin Pharm Ther. 2006 Oct;31(5):469-76. doi: 10.1111/j.1365-2710.2006.00766.x. J Clin Pharm Ther. 2006. PMID: 16958825 Clinical Trial.
-
Variability of glucose-lowering effect as a limiting factor in optimizing basal insulin therapy: a review.Diabetes Obes Metab. 2013 Aug;15(8):701-12. doi: 10.1111/dom.12087. Epub 2013 Mar 24. Diabetes Obes Metab. 2013. PMID: 23451796 Review.
-
Clinical pharmacokinetics and pharmacodynamics of insulin aspart.Clin Pharmacokinet. 2001;40(9):641-59. doi: 10.2165/00003088-200140090-00002. Clin Pharmacokinet. 2001. PMID: 11605714 Review.
Cited by
-
Study on bioequivalence and influence of obesity-related indicators on pharmacokinetics and pharmacodynamics for insulin degludec in healthy subjects.Sci Rep. 2024 Oct 21;14(1):24687. doi: 10.1038/s41598-024-75554-3. Sci Rep. 2024. PMID: 39433930 Free PMC article. Clinical Trial.
-
Polyester Nanoparticles with Controlled Topography for Peroral Drug Delivery Using Insulin as a Model Protein.ACS Nano. 2024 May 7;18(18):11863-11875. doi: 10.1021/acsnano.4c01027. Epub 2024 Apr 15. ACS Nano. 2024. PMID: 38622996 Free PMC article.
-
Fabrication and evaluation of nanoemulsion based insulin loaded microneedles for transdermal drug delivery.Ther Deliv. 2024;15(8):605-617. doi: 10.1080/20415990.2024.2377065. Epub 2024 Jul 29. Ther Deliv. 2024. PMID: 39072401 Free PMC article.
References
Publication types
MeSH terms
Substances
LinkOut - more resources
Full Text Sources
Medical
Miscellaneous
