. 2021 Mar;14(2):443-454.
doi: 10.1038/s41385-020-00349-4. Epub 2020 Nov 2.

Self and microbiota-derived epitopes induce CD4+ T cell anergy and conversion into CD4+Foxp3+ regulatory cells

Affiliations

Self and microbiota-derived epitopes induce CD4+ T cell anergy and conversion into CD4+Foxp3+ regulatory cells

Michal P Kuczma et al. Mucosal Immunol. 2021 Mar.

Abstract

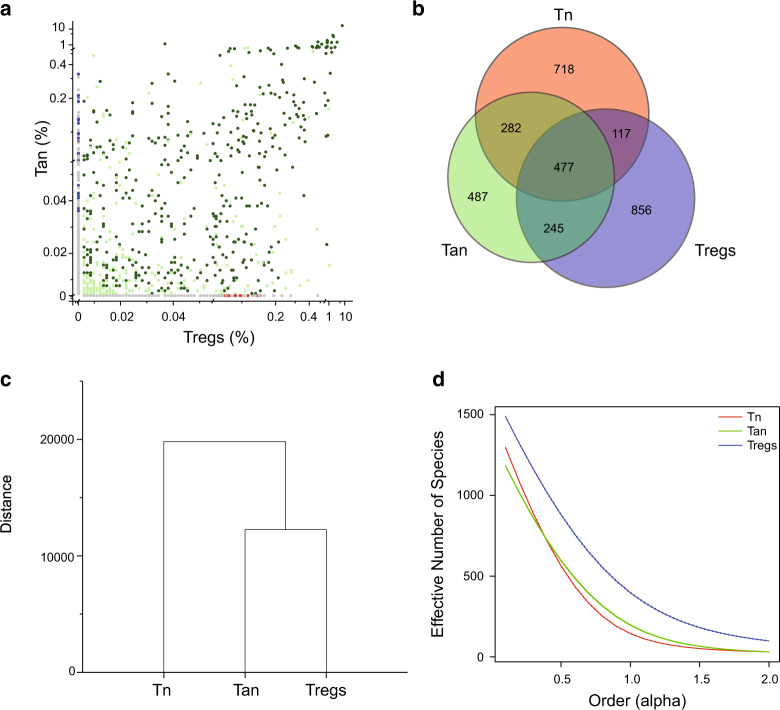
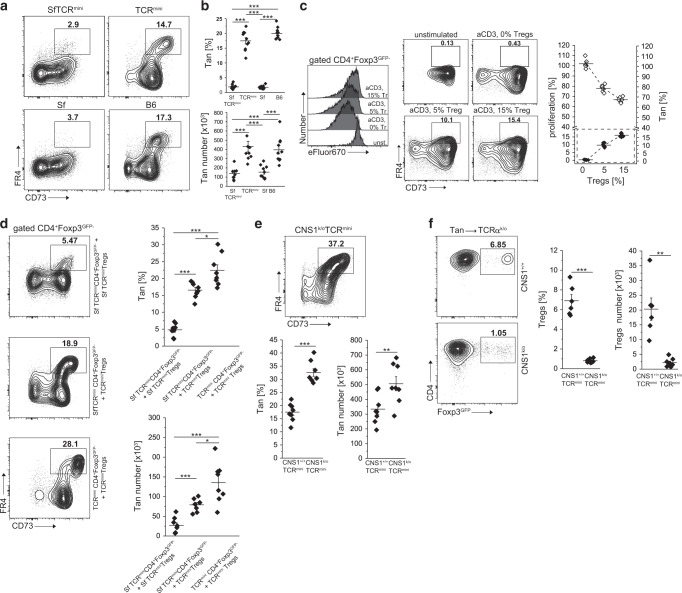
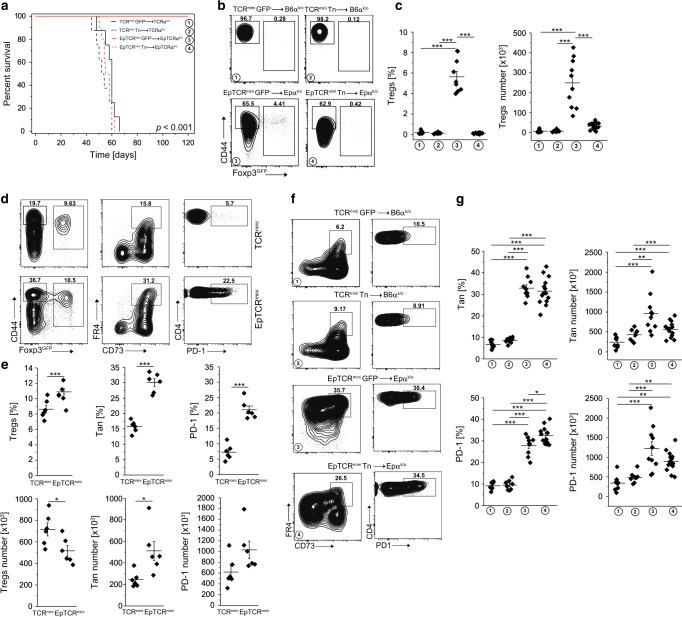
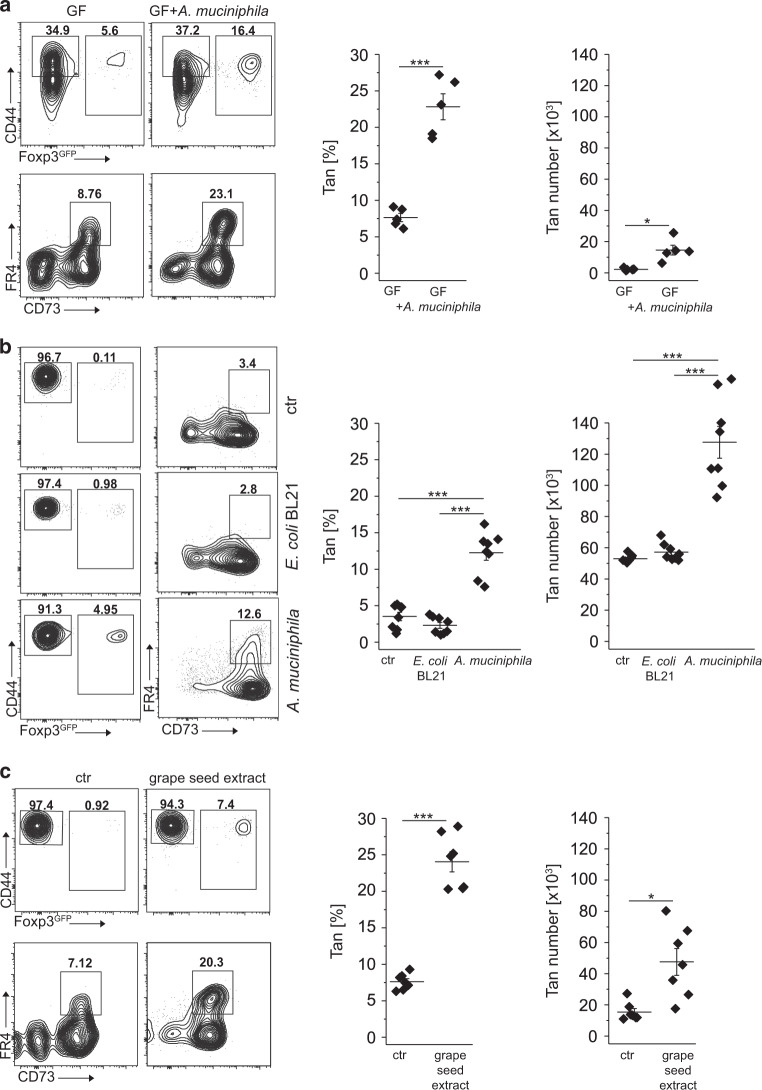
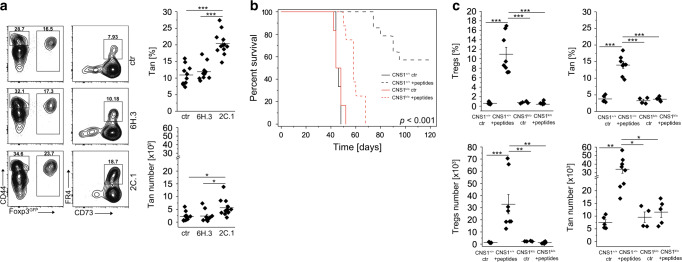
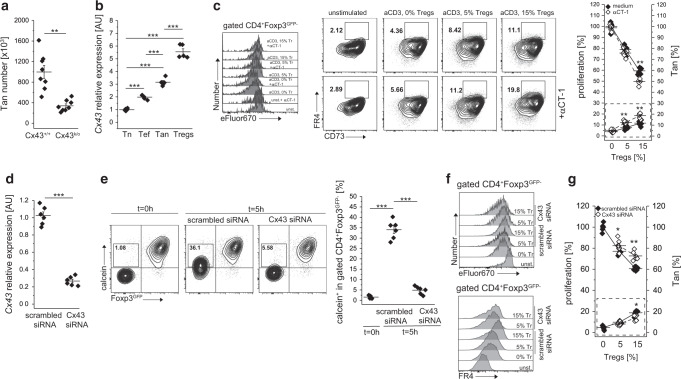
The physiological role of T cell anergy induction as a key mechanism supporting self-tolerance remains undefined, and natural antigens that induce anergy are largely unknown. In this report, we used TCR sequencing to show that the recruitment of CD4+CD44+Foxp3-CD73+FR4+ anergic (Tan) cells expands the CD4+Foxp3+ (Tregs) repertoire. Next, we report that blockade in peripherally-induced Tregs (pTregs) formation due to mutation in CNS1 region of Foxp3 or chronic exposure to a selecting self-peptide result in an accumulation of Tan cells. Finally, we show that microbial antigens from Akkermansia muciniphila commensal bacteria can induce anergy and drive conversion of naive CD4+CD44-Foxp3- T (Tn) cells to the Treg lineage. Overall, data presented here suggest that Tan induction helps the Treg repertoire to become optimally balanced to provide tolerance toward ubiquitous and microbiome-derived epitopes, improving host ability to avert systemic autoimmunity and intestinal inflammation.


Conflict of interest statement

The authors declare that they have no competing interests.

Figures

Fig. 1
Fig. 1. The overlap between the TCRs expressed on Tan, Tn, and Tregs subsets.
a Frequencies of the TCRs expressed on CD4+ Tan and Treg cells from mesenteric lymph nodes of TCRminiFoxp3GFP mice and their representation in Tn population from the same organ. Dark green dots mark TCRs shared by all three subpopulations, light green dots depict TCRs shared by Tan and Tregs, and red dots identify TCRs shared by Tregs and Tn subsets. Gray dots on both axes mark TCRs found only on Tregs or Tan cells, whereas blue dots label TCRs shared by Tan and Tn subset. b Overlap between all TCRs sequenced from indicated subset of CD4+ T cells. Numbers represent quantity of different sequences in indicated populations. c Dendrogram showing MII similarity index (overlap) for CDR3α regions of the TCRs expressed by the mLN CD4+ Tn, Tan, and Treg cells from TCRminiFoxp3GFP mice. d Relative diversity index quantified using the effective number of species (ENS) and presented in the form of diversity profiles. Three individual mice were sequenced (23–44 × 103 total sequences per group) and for analysis only sequences present 5× or more were taken under consideration. Results show combined sequences (80–120 × 103 total sequences per group).
Fig. 2
Fig. 2. CD4+Foxp3+ tTregs induce anergy in CD4+Foxp3 T cells.
a, b Foxp3-deficient scurfy mice have reduced frequency and number of CD4+CD44Foxp3GFP−FR4+CD73+ anergic T cells (Tan). a Expression of FR4 and CD73 on splenic CD4+ cells from healthy C57BL/6 (B6) and scurfy SfC57BL/6 mice that express unmanipulated or restricted (TCRmini, SfTCRmini) repertoire of αβTCRs. b Percentage and a total number of anergic CD4+T cells in the spleens from indicated strains (each dot represents an individual animal, n = 10 for each type). c Ex vivo Tregs induce anergy in naïve CD4+ cells. CD4+ Tn cells loaded with a proliferation dye eFluor670 were co-cultured with DCs and increasing numbers of Tregs. Typical dilution of eFluor670 on day 4 is shown on a histogram (Tregs abbreviated to “Tr”). Dot plots show the frequencies of FR4+CD73+ Tan cells within CD4+Foxp3GFP− population for each condition. The graph shows the summarized proliferation inhibition and change in Tan frequency (dotted box). One experiment of two is shown. d Functional Tregs induce anergy in co-transferred CD4+Foxp3GFP− or Sf CD4+Foxp3GFP− cells. CD4+Foxp3GFP− cells from Foxp3-deficient SfTCRmini or TCRmini mice were adoptively transferred to TCRαk/o mice alone or with Tregs from TCRmini or SfTCRmini mice. Dot plots show proportions of CD4+CD44+Foxp3GFP−FR4+CD73+ cells in each recipient (each symbol on graphs show frequency or the number of Tan in individual animals (n = 8 of each type). Presented FACS data are representative of three experiments. e CNS1k/o mice with a defect in pTregs formation have increased numbers of Tan cells. Expression of FR4+CD73+ on CD4+CD44+Foxp3GFP- cells in indicated strains (n = 8 mice of each type; see also a and b for comparison). f TCRαk/o recipients that received the transfer of Tan from CNS1+/+ (n = 6) have far more induced pTregs than the same recipients that received Tan cells from CNS1-/- donors (n = 8). Dot plots depict typical FR4+CD73+ Tan frequencies which are summarized on a graph. Statistical significance was calculated with ANOVA with Bonferroni correction (b, d) or paired Student t test (e, f). *p < 0.05, **p < 0.01, ***p < 0.001.
Fig. 3
Fig. 3. Conversion of Tan cells to pTregs saves lymphopenic recipients from lethal cachexia.
a Survival of lymphopenic TCRαk/o or EpTCRαk/o mice after transfer of CD4+Foxp3GFP− or naïve CD4+CD44Foxp3GFP− cells from indicated donors (for CD4+CD44Foxp3GFP− and CD4+Foxp3GFP− TCRmini donors n = 8, for CD4+CD44Foxp3GFP− cells from EpTCRmini n = 10 and for CD4+Foxp3GFP− cells n = 14). b Expression of Foxp3 and CD44+ on transferred cells. c Proportions and the total number of Tregs in each recipient. Each symbol represents an individual mouse. d Representative analysis of TCRmini and EpTCRmini mice. Frequencies of Tregs (left plots), Tan (middle plots) and PD-1 (right plots) splenic CD4+ cells are shown and are summarized in e (each symbol shows individual mouse, n = 6 of each type). f FACS plots show data generated in a and b. Frequencies of Tan (left) and PD-1 (right) of CD4+Foxp3GFP− cells are shown. g Summary of data from f. Each symbol depicts an individual mouse. Statistical significance was calculated with ANOVA with Bonferroni correction (c, g) or paired Student t test (e). *p < 0.05, **p < 0.01, ***p < 0.001.
Fig. 4
Fig. 4. Original selecting peptide suffices to sustains conversion of Tan to pTregs.
a Survival of indicated host TCRmini, EpTCRmini or 63KTCRmini mice receiving adoptive transfer of naïve or anergic CD4+ cells from indicated donors (n = 6 EpTCRmini Tn->EpTCRαk/o, n = 7 EpTCRmini Tn->63KTCRαk/o, n = 10 EpTCRmini Tn->TCRαk/o, n = 9 EpTCRmini Tan->EpTCRαk/o, n = 6 EpTCRmini Tan->63KTCRαk/o, n = 6 EpTCRmini Tan->TCRαk/o). Representative FACS analysis of mice from a. A typical expression of Foxp3, FR4/CD73, and PD-1 is shown for each host mouse type. b represents naïve and c Tan cell transfer. Data are summarized in d for Tn and e for Tan transfers, with each symbol indicating individual animal. Mice expressing symptoms of wasting disease were analyzed when they lost <15% of original starting weight. Statistical significance was calculated by ANOVA with Bonferroni correction. For survival (a), the log-rank test was applied. *p < 0.05, **p < 0.01, ***p < 0.001.
Fig. 5
Fig. 5. Colonization of GF mice with A. muciniphila supports colonic Tan cells.
a Colonic Tan cells in 12 weeks old germ-free (GF) mice unmanipulated and mono-colonized with Akkermansia muciniphila. Graphs show the frequency and the total number of relevant CD4+ cells (each symbol represents an individual mouse, n = 5 of each type). b Colonization of TCRαk/o with A. muciniphila but not with E. coli BL21 supports colonic Tan cells and Tregs. Dot plots show representative staining of colonic CD4+ cells in TCRαk/o mice first pretreated with antibiotics, then gavaged with PBS (ctr) or indicated bacteria and finally injected with CD4+ Tn cells. Expression of CD44, Foxp3, and FR4/CD73 on gated CD4+ and CD4+Foxp3GFP−CD44+ cells were examined 8 weeks after adoptive transfer. Symbols on summarizing graphs depict individual animals (n = 8 mice in each group). c Feeding of TCRαk/o mice with grape seed extract that expands residual A. muciniphila increases the number of colonic Tregs and Tan originating from transferred Tn cells. Dot plots show typical Treg and Tan frequencies in PBS-fed control (left) and grape-seed fed mice (right). Graphs show Tan cell frequency and total numbers from individual mice (n = 7 mice in each cohort). Plots show representative data of one of three experiments. Statistical significance was calculated by ANOVA with Bonferroni correction. *p < 0.05, **p < 0.01, ***p < 0.001.
Fig. 6
Fig. 6. Specific A. muciniphila-derived antigenic peptides induce Tan cells.
a A. muciniphila-derived 2C.1 (n = 12 mice) but not control 6H.3 (n = 10 mice) peptide induces Tregs and Tan cells. TCRmini mice were gavaged with indicated peptide mixed with cholera toxin or toxin alone (ctr; n = 10 mice), boosted i.p. one week later and analyzed on day 14. Plots show representative staining of Tan and Tregs and graphs show data from individual mice. b Lymphopenic mice injected with a pool of A. muciniphila-derived peptides (2C.1, 2C.9, 6H3, 8H.1) resist wasting disease caused by an adoptive transfer of Tn cells. TCRαk/o mice received pooled peptides with cholera toxin (CT) or CT alone and next day animals were injected with FACS-sorted CD4+ Tn cells from CNS1+/+ (n = 6 ctr and n = 14 peptides) or CNS1k/o (n = 6 ctr and n = 8 peptides). Mice were then gavaged three times with a pool of peptides mixed with CT or CT alone every other day. Then all recipients were i.p. immunized with a pool of peptides adsorbed on an alum every other day for 4 weeks. Ctr-mice received toxin followed by alum only (no peptides). Survival curves for each condition are shown. c Summary of Tregs and Tan cells induction for each group of mice. Each symbol in a and c represents an individual mouse. An experiment was repeated twice. Statistical significance was calculated with ANOVA with Bonferroni correction (c) . For survival (b), the log-rank test was applied. *p < 0.05, **p < 0.01, ***p < 0.001.
Fig. 7
Fig. 7. Anergy induction by Tregs involves formation of gap junctions.
a The expression of connexin 43 (Cx43) impacts the number of anergic CD4+ cells in the spleen. Each animal is depicted by an individual symbol (n = 8 of each type). b Relative levels of Cx43 transcription in naïve (Tn, CD44Foxp3GFP−), activated/effector (Te, CD44+Foxp3GFP−), anergic (Tan, CD44+Foxp3GFP−FR4+CD73+), and Treg (Foxp3GFP+) CD4+ cells examined by real time PCR analysis. Each cell type was analyzed in triplicate. Data from one of two experiments are shown. c Ex vivo induction of Cx43 expression by αCT-1 peptide improves Treg-mediated suppression (left y-axis) and increases the number of Tan cells (dotted box and right y-axis). Representative dot plots and graph of one of two experiments is shown. d Relative expression of Cx43 by Tregs transfected with Cx43-targeting or scrambled control siRNA. e Implemented Cx43 silencing reduces the transfer of a calcein violet between Tregs and suppressed Tn cells via gap junctions. Box within dot plots show frequencies of Tn cells receiving a calcein. The graph shows data from individual samples. f Ex vivo CD4+ Tn cells proliferation and FR4 expression upon inhibition by Tregs transfected with Cx43-specific or control siRNA. Tregs abbreviated to “Tr”. The graph on right (g) summarizes these data (dotted box shows increase in Tan in response to Tregs). eg One experiment of two is shown. Statistical significance was calculated with paired Student t test (a, c, d, g) or ANOVA with Bonferroni correction (b, e). *p < 0.05, **p < 0.01, ***p < 0.001.

Comment in

Similar articles

Cited by

References

    1. Schwartz RH. T cell clonal anergy. Curr. Opin. Immunol. 1997;9:351–357. - PubMed
    1. Ermann J, et al. CD4+CD25+ T cells facilitate the induction of T cell anergy. J. Immunol. 2001;167:4271–4275. - PubMed
    1. Crespo J, Sun H, Welling TH, Tian Z, Zou W. T cell anergy, exhaustion, senescence, and stemness in the tumor microenvironment. Curr. Opin. Immunol. 2013;25:214–221. - PMC - PubMed
    1. Silva Morales M, Mueller D. Anergy into T regulatory cells: an integration of metabolic cues and epigenetic changes at the Foxp3 conserved non-coding sequence 2. F1000Research. 2018;7:1–10. - PMC - PubMed
    1. Kalekar LA, et al. CD4(+) T cell anergy prevents autoimmunity and generates regulatory T cell precursors. Nat. Immunol. 2016;17:304–314. - PMC - PubMed

Publication types