. 2021 Mar;29(3):512-523.
doi: 10.1038/s41431-020-00747-z. Epub 2020 Nov 2.

Subdividing Y-chromosome haplogroup R1a1 reveals Norse Viking dispersal lineages in Britain

Affiliations

Subdividing Y-chromosome haplogroup R1a1 reveals Norse Viking dispersal lineages in Britain

Gurdeep Matharu Lall et al. Eur J Hum Genet. 2021 Mar.

Abstract

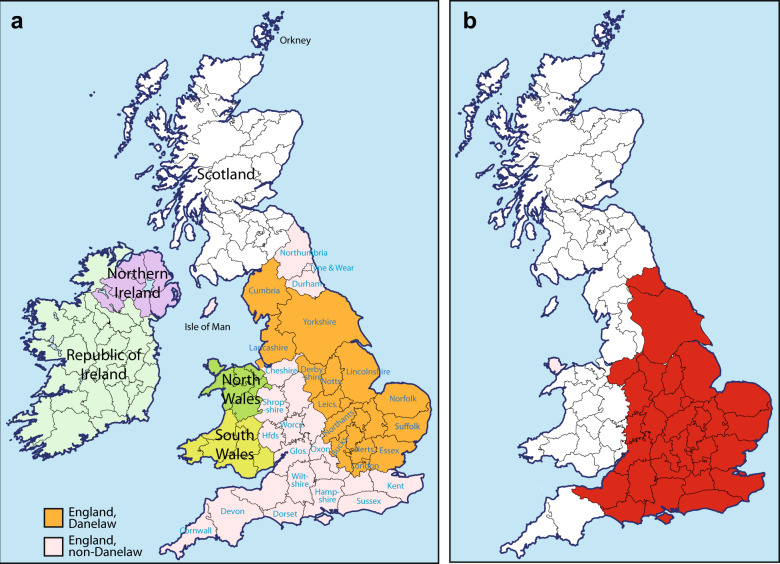
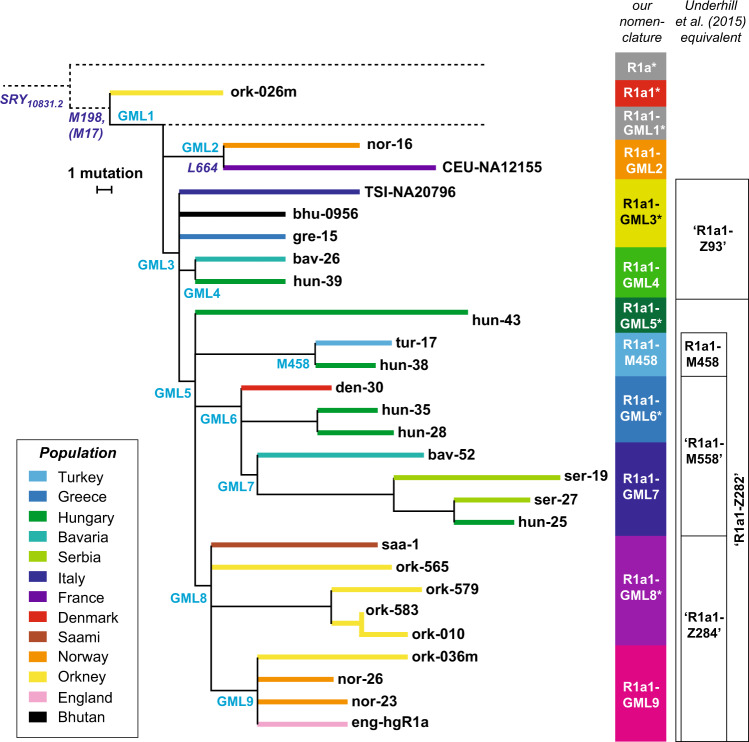
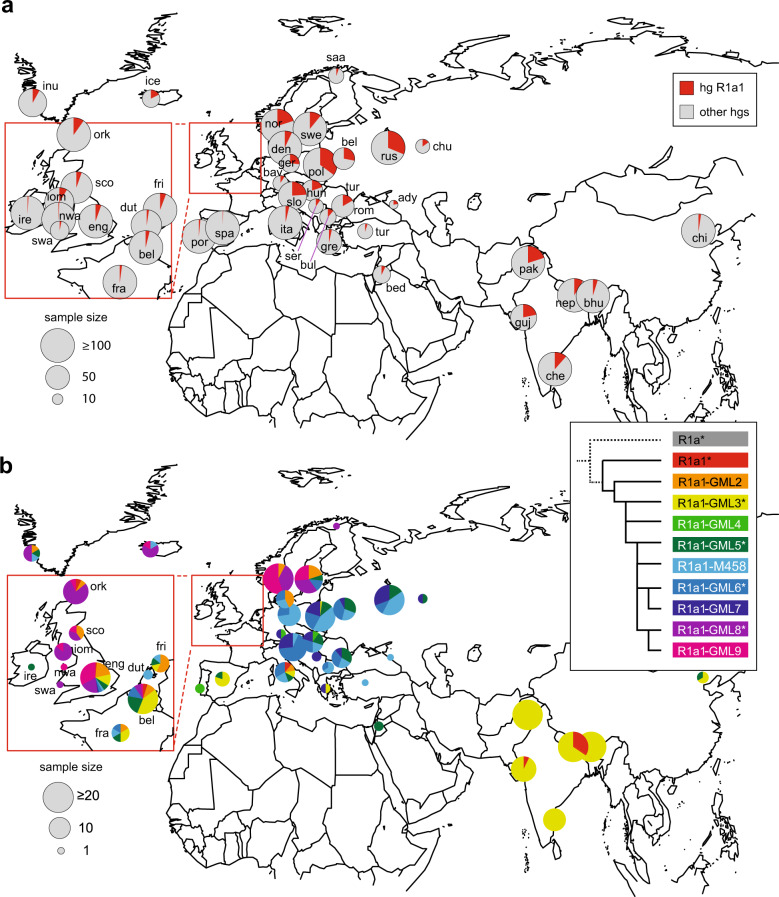
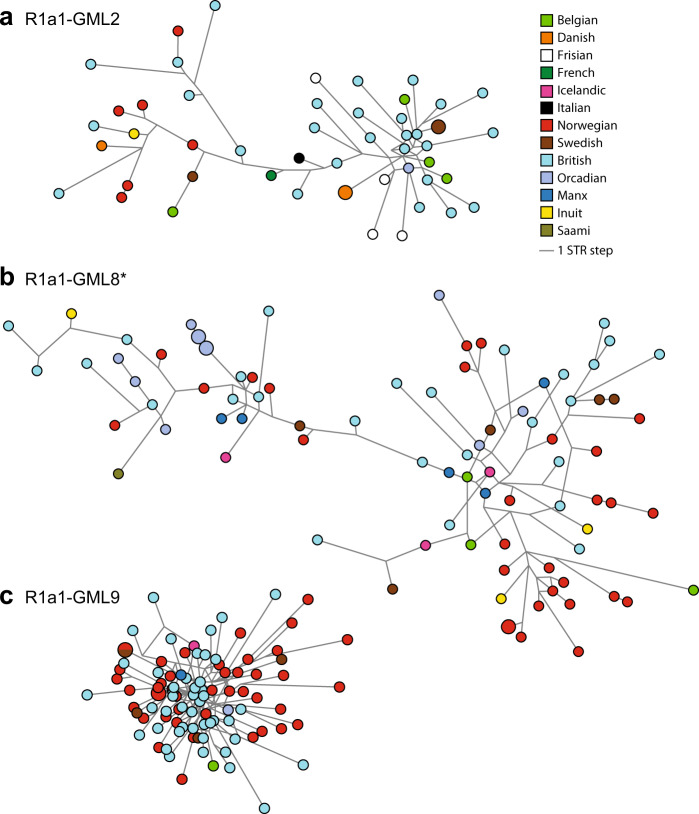
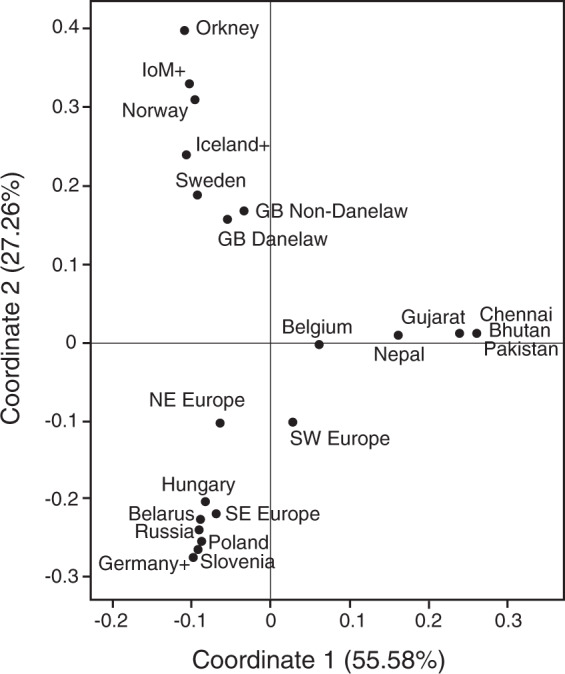
The influence of Viking-Age migrants to the British Isles is obvious in archaeological and place-names evidence, but their demographic impact has been unclear. Autosomal genetic analyses support Norse Viking contributions to parts of Britain, but show no signal corresponding to the Danelaw, the region under Scandinavian administrative control from the ninth to eleventh centuries. Y-chromosome haplogroup R1a1 has been considered as a possible marker for Viking migrations because of its high frequency in peninsular Scandinavia (Norway and Sweden). Here we select ten Y-SNPs to discriminate informatively among hg R1a1 sub-haplogroups in Europe, analyse these in 619 hg R1a1 Y chromosomes including 163 from the British Isles, and also type 23 short-tandem repeats (Y-STRs) to assess internal diversity. We find three specifically Western-European sub-haplogroups, two of which predominate in Norway and Sweden, and are also found in Britain; star-like features in the STR networks of these lineages indicate histories of expansion. We ask whether geographical distributions of hg R1a1 overall, and of the two sub-lineages in particular, correlate with regions of Scandinavian influence within Britain. Neither shows any frequency difference between regions that have higher (≥10%) or lower autosomal contributions from Norway and Sweden, but both are significantly overrepresented in the region corresponding to the Danelaw. These differences between autosomal and Y-chromosomal histories suggest either male-specific contribution, or the influence of patrilocality. Comparison of modern DNA with recently available ancient DNA data supports the interpretation that two sub-lineages of hg R1a1 spread with the Vikings from peninsular Scandinavia.


Conflict of interest statement

The authors declare that they have no conflict of interest.

Figures

Fig. 1
Fig. 1. Map of Britain and Ireland showing the Danelaw, the regions sampled, and the predominant PoBI autosomal cluster.
a English counties (named in blue font) and regions studied here, and the extent of the Danelaw, the region under Scandinavian control from the late ninth to the late eleventh century; b Extent (in red) of the predominant cluster revealed by FineSTRUCTURE analysis in the Leslie et al. study [8] of autosomal SNP data in the PoBI samples (referred to there as ‘Central/South England’). Bucks. Buckinghamshire; Glos. Gloucestershire; Herts. Hertfordshire; Hfds. Herefordshire; Leics. Leicestershire; Northants. Northamptonshire; Notts. Nottinghamshire; Oxon Oxfordshire. Map images modified from an original work by Wikishire, CC BY-SA 4.0, https://commons.wikimedia.org/w/index.php?curid=36830415.
Fig. 2
Fig. 2. Subdivision of haplogroup R1a1 based on sequencing data.
Phylogeny [25] including 27 different MSY sequences, with branch lengths proportional to the number of single-nucleotide mutations. Terminal branches are coloured by population, as shown in the key, and sample names are given at the tips of branches. SNPs chosen for typing in this study are indicated on relevant branches in plain text. Other mutations (e.g., L664) are in italics, and were not typed in all samples. To the right is indicated the approximate equivalence to lineages previously identified [23, 34], and verified in this study. Nomenclature of R1a and R1a1 here is according to ref. [50]. Unobserved lineages, including the deep-rooting paragroup R1a1-GML1*, are indicated by dotted lines.
Fig. 3
Fig. 3. Geographical distributions of haplogroup R1a1 and its sub-haplogroups.
a Distribution of haplogroup R1a1 in the analysed samples. Pie-charts indicate populations, with area proportional to sample size up to 100, as indicated in the key, and the red sector showing the proportion of hg R1a1. b Distribution of sub-haplogroups of R1a1. Populations are represented by pie-charts with area proportional to hg R1a1 sample size up to 20, as indicated in the key, and sectors indicating sub-haplogroup frequencies within R1a1, according to the colour-coded phylogeny top right. Populations in the British Isles and surroundings are labelled as follows: ork Orcadian; sco Scottish mainland; eng English; ire Irish; iom Isle of Man; nwa North Wales; swa South Wales; fre French; bel Belgian; dut Dutch; fra French; fri Frisian; other populations are: ady Adygei; bav Bavarian; bed Bedouin; bel Belarusian; bhu Bhutanese; bul Bulgarian; che Chennai; chi Chinese; chu Chuvash; den Danish; ger German; gre Greek; guj Gujarati; hun Hungarian; ice Icelandic; inu Inuit; nep Nepalese; nor Norwegian; pak Pakistani; pol Polish; por Portuguese; rom Romanian; rus Russian; saa Saami; ser Serbian; slo Slovenian; spa Spanish; swe Swedish; tur Turkish. Additional information about the frequency distributions of sub-haplogroups can be found in Tables S1 and S5.
Fig. 4
Fig. 4. Median-joining networks for three sub-haplogroups of haplogroup R1a1.
Networks (all at the same scale) based on 21 Y-STRs for (a) R1a1-GML2; (b) paragroup R1a1-GML8*; (c) R1a1-GML9. Circles represent haplotypes, with areas proportional to frequency, and coloured to represent populations as shown in the key. Lines between haplotypes (links) represent STR mutational steps.
Fig. 5
Fig. 5. Principal coordinates analysis of populations based on hg R1a1 sub-haplogroup frequencies.
The minimum population size is 10, and pooling was necessary to achieve this in some cases, as follows: IoM+ = Isle of Man, Scotland and Ireland; Germany+ = Germany and Bavaria; Iceland+ = Iceland and Inuit; SW Europe = France, Spain, Portugal and Italy; SE Europe = Bulgaria, Greece, Turkey, Romania and Serbia; NW Europe = Frisia, Netherlands and Denmark. The two ‘GB’ populations omit the Scottish samples. For some populations, sample size was too small for inclusion and reasonable pooling was not possible.

References

    1. Carroll J, Harrison SH, Williams G. The Vikings in Britain and Ireland. London: British Museum Press; 2014.
    1. Abrams L, Parsons DN. Place-names and the history of Scandinavian settlement in England. In: Hines J, Lane A, Redknap M, editors. Land, sea and home: settlement in the Viking period. Leeds: Maney; 2004. p. 379–431.
    1. Kershaw J. Viking identities: Scandinavian jewellery in England. Oxford: Oxford University Press; 2013.
    1. Kershaw J, Røyrvik EC. The ‘People of the British Isles’ project and Viking settlement in England. Antiquity. 2016;90:1670–80. doi: 10.15184/aqy.2016.193. - DOI
    1. Carroll J. Identifying migrants in medieval England: the possibilities and limitations of place-name evidence. In: Ormrod WM, Tyler EM, Story J, editors. Migrants in Medieval England, c. 500–1500; proceedings of the British Academy, 219. Oxford: Oxford University Press; 2020. p. 90–119.

Publication types