. 2021 Jan;22(1):41-52.
doi: 10.1038/s41590-020-00810-3. Epub 2020 Nov 2.

Intravenous nanoparticle vaccination generates stem-like TCF1+ neoantigen-specific CD8+ T cells

Affiliations

Intravenous nanoparticle vaccination generates stem-like TCF1+ neoantigen-specific CD8+ T cells

Faezzah Baharom et al. Nat Immunol. 2021 Jan.

Abstract

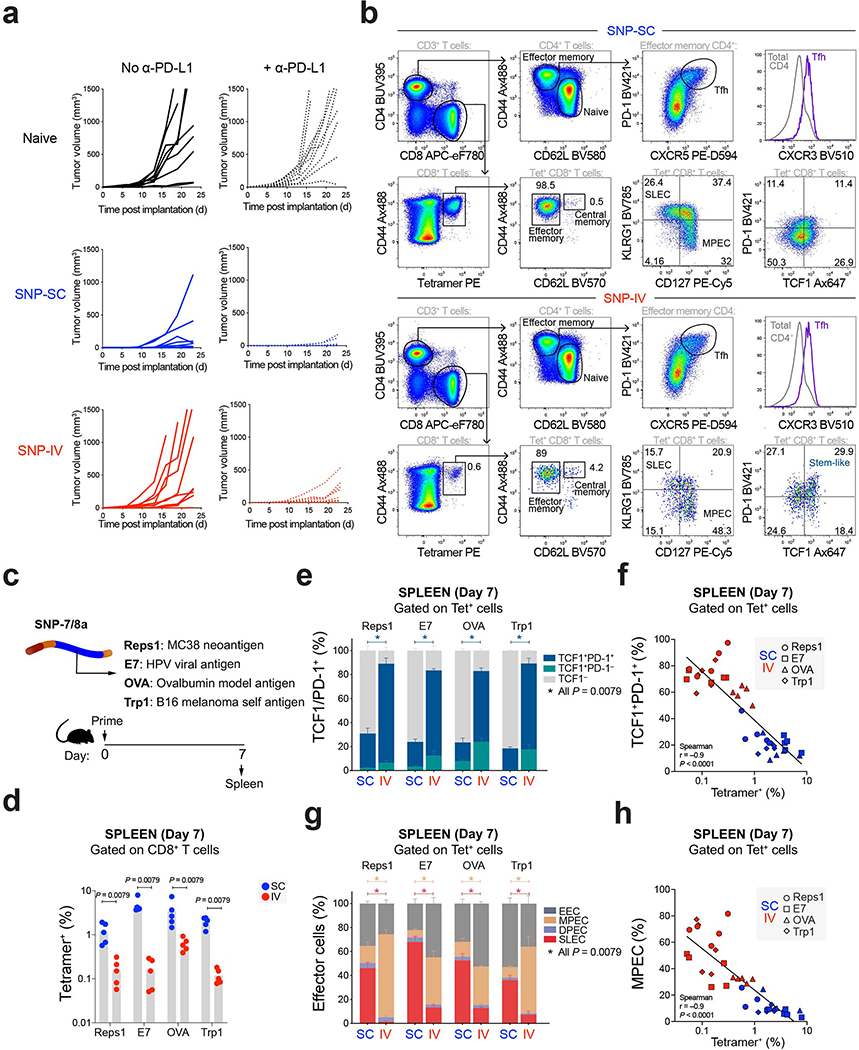
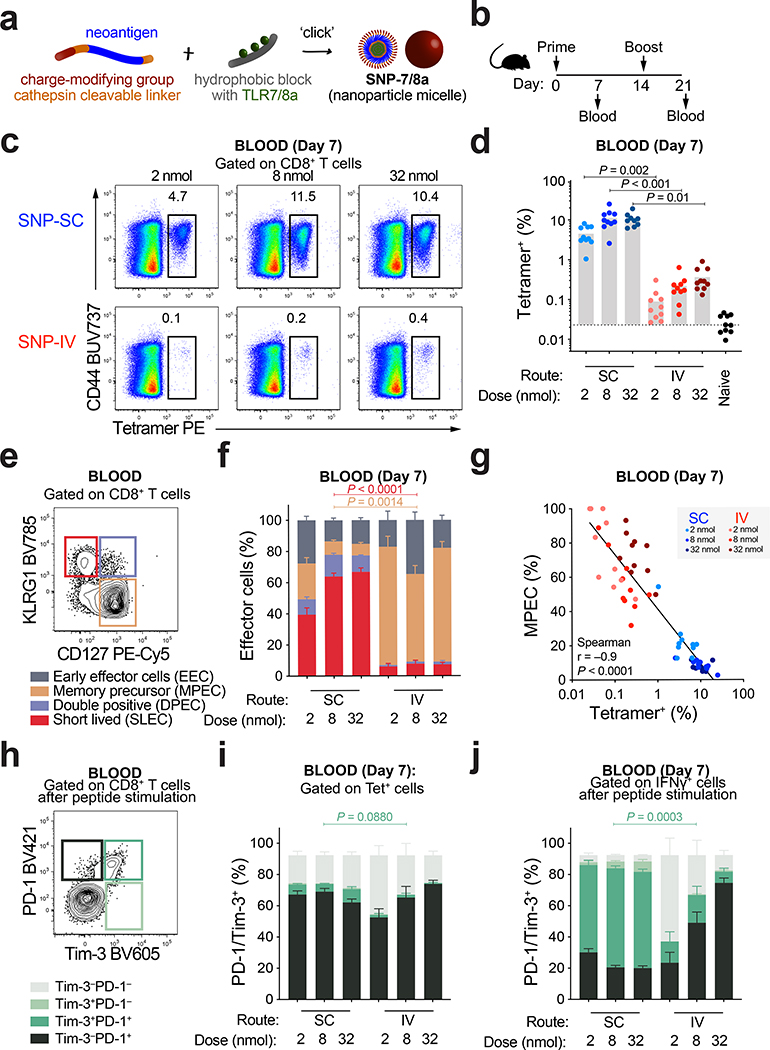
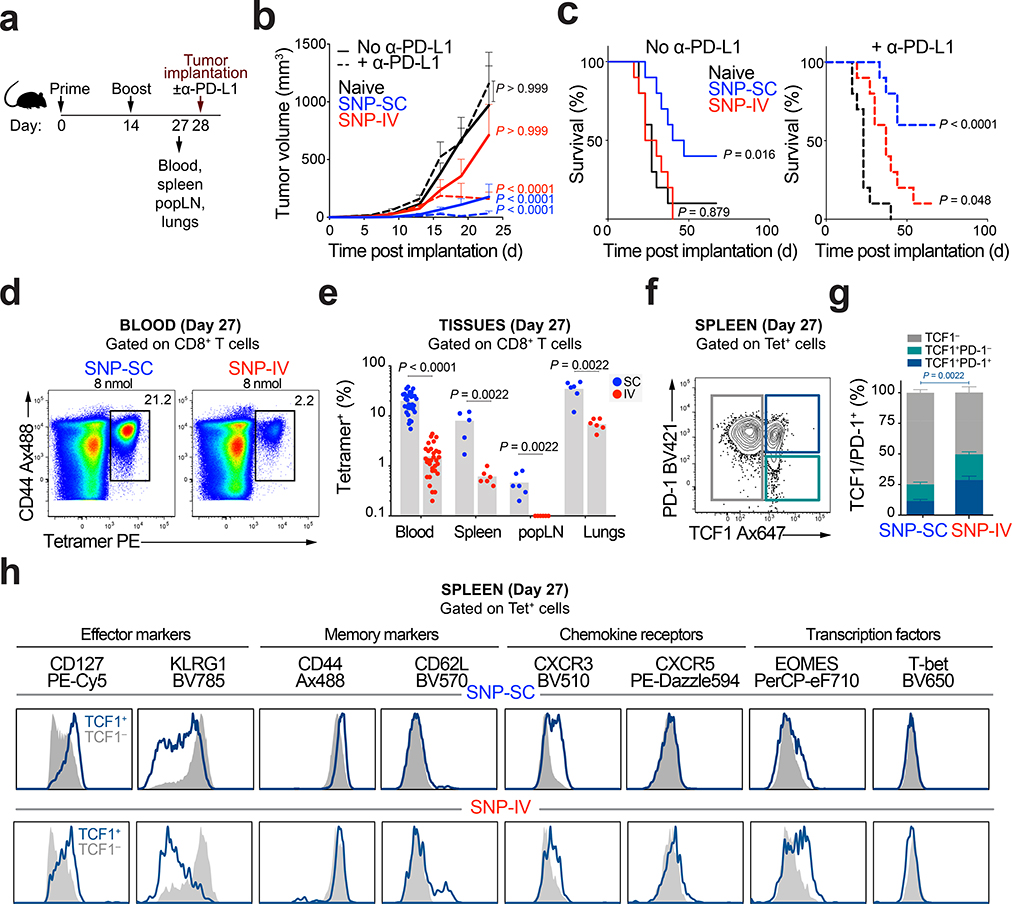
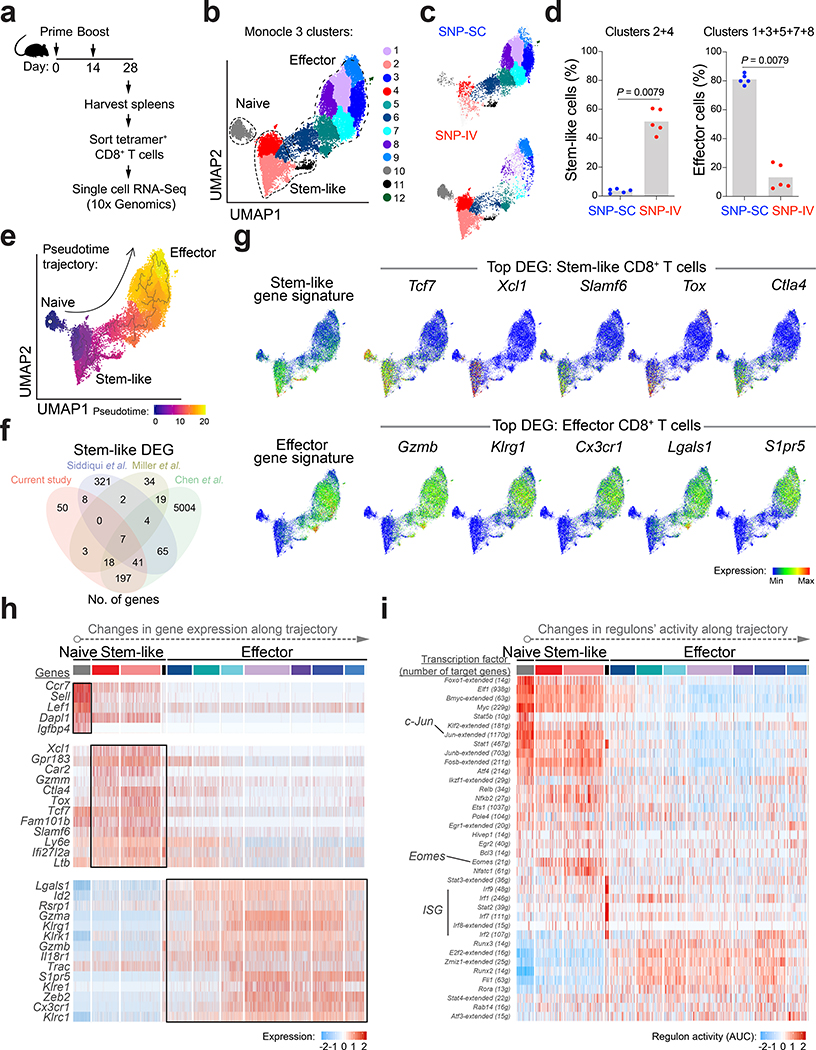
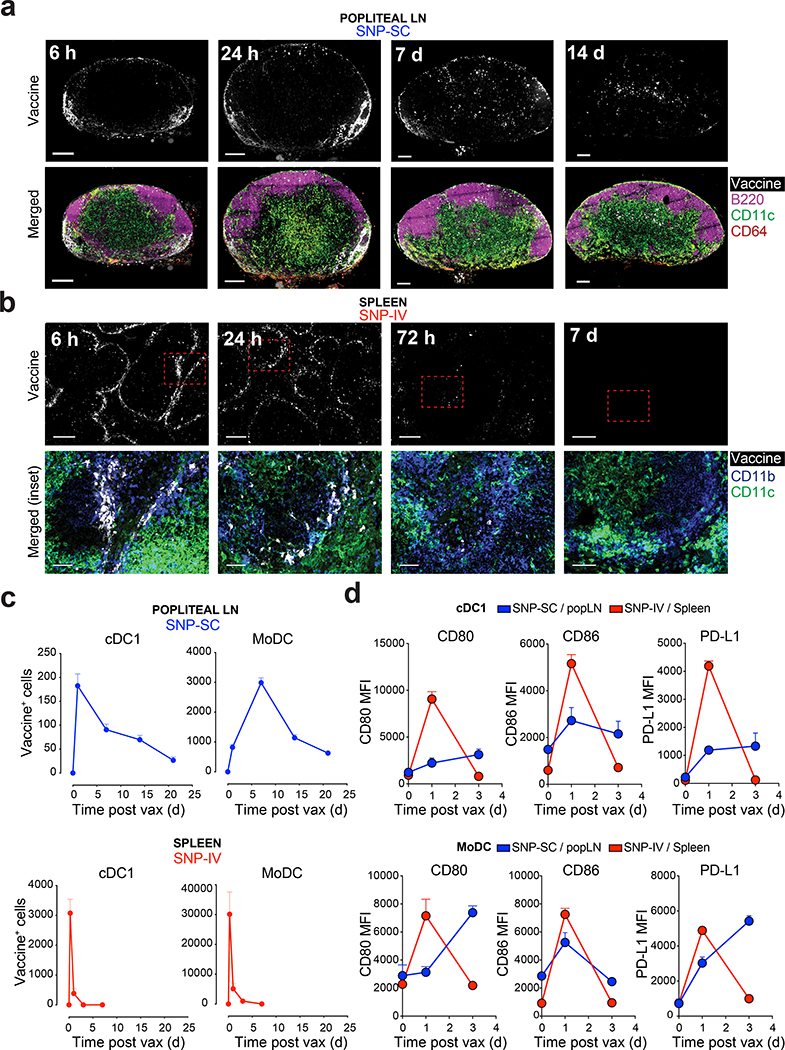
Personalized cancer vaccines are a promising approach for inducing T cell immunity to tumor neoantigens. Using a self-assembling nanoparticle vaccine that links neoantigen peptides to a Toll-like receptor 7/8 agonist (SNP-7/8a), we show how the route and dose alter the magnitude and quality of neoantigen-specific CD8+ T cells. Intravenous vaccination (SNP-IV) induced a higher proportion of TCF1+PD-1+CD8+ T cells as compared to subcutaneous immunization (SNP-SC). Single-cell RNA sequencing showed that SNP-IV induced stem-like genes (Tcf7, Slamf6, Xcl1) whereas SNP-SC enriched for effector genes (Gzmb, Klrg1, Cx3cr1). Stem-like cells generated by SNP-IV proliferated and differentiated into effector cells upon checkpoint blockade, leading to superior antitumor response as compared to SNP-SC in a therapeutic model. The duration of antigen presentation by dendritic cells controlled the magnitude and quality of CD8+ T cells. These data demonstrate how to optimize antitumor immunity by modulating vaccine parameters for specific generation of effector or stem-like CD8+ T cells.


Figures

Extended Data Fig. 1 |
Extended Data Fig. 1 |. Route and dose of SNP-7/8a immunization controls the magnitude and phenotype of antigen-specific CD8 T cells.
a, Whole blood was collected on day 21 to measure the frequency of tetramer+ CD8 T cells post boost. Bar graphs summarize the frequency of tetramer+ CD8 T cells from blood (n = 10). b, Bar graphs summarize the frequency of IFNγ+ CD8 T cells from blood (n = 10) on day 21. c, Bar graphs summarize the frequency of IFNγ+ CD4 T cells from blood (n = 10). d, Bar graphs show proportions of MPEC/SLEC subpopulations in the blood (n = 10). e, Frequency of MPECs is negatively correlated to frequency of tetramer+ CD8 T cells. f,g, Bar graphs show proportions of PD-1/Tim-3 subpopulations in the blood (n = 10) of tetramer+ cells (f) or IFNγ+ cells (g). Data are representative of two independent experiments. The bars represent the median. Statistics were assessed by Kruskal-Wallis with Dunn’s correction for multiple comparisons (a,b,d,f,g) and Spearman correlation (e).
Extended Data Fig. 2 |
Extended Data Fig. 2 |. Intravenous administration of SNP-7/8a generates TCF1+ CD8 T cells with anti-tumor capacity upon anti-PD-L1 treatment.
a, Tumor growth curves of mice unvaccinated (black) or vaccinated with SNP-SC (blue) or SNP-IV (red) with (dotted line) or without α-PD-L1 (solid line) (n = 10). b, Flow cytometric analysis of single cells from spleen (concatenated, n = 6) after SNP-SC (top panel) or SNP-IV (bottom panel). Cells were stained with Reps1 tetramer and other antibodies. Numbers indicate percentage of cell population within the gate. c, Mice were vaccinated with SNP-7/8a containing Reps1, E7, OVA or Trp1 antigens (n = 5). Spleens were collected 7 days post prime. d, Splenocytes were stained with tetramers specific for the respective antigens. Bar graph summarizes the frequencies of antigen-specific CD8 T cells following SNP-SC (blue) or SNP-IV (red). e, Bar graph summarizes the frequencies of TCF1 subpopulations in the spleen (n = 5) after SNP-SC or SNP-IV. f, Frequency of TCF1+PD-1+ cells is negatively correlated to frequency of tetramer+ CD8 T cells. g, Bar graph summarizes the frequencies of early effector cells (EEC, gray), memory precursor effector cells (MPEC, tan), double positive effector cells (DPEC, lilac) and short lived effector cells (SLEC, crimson) in the spleen (n = 5) after SNP-SC or SNP-IV. h, Frequency of MPEC is negatively correlated to frequency of tetramer+ CD8 T cells. Statistics were assessed by Mann Whitney test (d,e,g,) and Spearman correlation (f,h).
Extended Data Fig. 3 |
Extended Data Fig. 3 |. Single-cell analysis of neoAg+ CD8 T cells by RNA sequencing identifies stem-like gene signature in SNP-IV and effector gene signature in SNP-SC cells.
a, C57BL/6 mice (n = 5) were vaccinated subcutaneously or intravenously at 8 nmol on day 0 and day 14 with SNP-7/8a containing Reps1. Spleens were collected on day 28 and tetramer+ CD8 T cells were sorted by flow cytometry. Flow plots show gating strategy for cell sorting. b, Mice were individually labeled with distinct hashtag oligo-tagged antibodies and pooled for 10x and RNA sequencing. Individual UMAPs show gene expression of each mouse vaccinated SC (left panel) or IV (right panel). c, Bar graph summarizes the frequency of the twelve Monocle 3 clusters that are represented by each vaccination route. d, Density plots to identify stability states corresponding to higher density areas on UMAP, based on 2D kernel density estimation. e, Expression of top differentially expressed genes (DEG) of naïve cells are presented in meaning plots. f, Heatmap summarizes the number of cells that share a clonotype based on paired alpha and beta complementarity-determining region 3 (CDR3) sequences in each individual animal. g, Bar graph shows numbers of stem-like cells (clusters 2 and 4) and effector cells (clusters 1, 3, 5, 7 and 8) in each clonotype from SC or IV vaccinated mice. Only clonotypes expressed by more than 100 cells are represented in the graphs. h, Heatmap of DEG expressed in each cluster organized along the pseudotime trajectory.
Extended Data Fig. 4 |
Extended Data Fig. 4 |. Therapeutic vaccination with SNP-IV generates neoAg-specific CD8 T cells with superior anti-tumor capacity.
a, Tumor growth of mice treated with SNP-7/8a with (red) or without agonist (gray) (n = 10). b, Average tumor growth of SNP-IV (red), SNP-SC given twice (blue), once on day 7 (dotted blue) or twice at a lower dose (light blue) (n = 10). c, Total numbers of CD8 T cells, CD4 T cells and NK cells and d, frequency of tetramer+ CD8 T cells from blood in mice treated with isotype control antibody (red) or blocking antibodies against CD8β (black), CD4 (blue) or NK1.1 (purple) as assessed by flow cytometry (n = 10). Spleens and tumors were harvested on day 14 (n = 10) and day 21 (n = 3–5). e, Stem-like cells (TCF1+PD-1+; dark blue), f, effector cells (Granzyme B+TCF1; orange) or g, exhausted cells (PD-1+Tim-3+) of tetramer+ cells were identified by flow cytometry. Bar graphs summarize the frequency of cells in the spleen on day 14 (filled bar) or day 21 (checked bar) (n = 3–10). h, Bar graphs summarize the frequency of Ki-67+ cells in different tissues on day 14 (red bar) or day 21 (checked bar) post SNP-IV (n = 3–10). Data are representative of four independent experiments. The bars represent the median. Statistics were assessed by two-way ANOVA with Bonferroni correction (a,b) and Mann Whitney test (e,f,g,h).
Extended Data Fig. 5 |
Extended Data Fig. 5 |. Transient vaccine distribution to spleen and activation of migratory cDC1 and moDC in after SNP-IV.
a, Whole body images of mice following SNP-SC or SNP-IV with labeled vaccines. b, Confocal images of LN or spleen sections of an unvaccinated mouse. c, Confocal image of popliteal LN section post SNP-SC. Detailed overlay of additional markers. White, vaccine; red, ERTR7 (stroma); orange, CD11b (monocytes, macrophages or cDC2); CD11c (moDC or cDC). Scale bar, 200 μm or 50 μm (inset). Arrows show co-localization of vaccine and CD11b+CD11c+ cells. d, Gating strategy to identify various populations from popliteal LN and spleen after SNP-SC and SNP-IV: MoDC (red), monocytes (pink), subcapsular sinus macrophages, SCS (gray), red pulp macrophages, RPM (dark gray), cDC1 (maroon), cDC2 (coral). Kinetics of MNPs that are vaccine+ in e, popliteal LNs or f, spleens after SNP-SC or SNP-IV respectively (n = 3). g, Histograms show MFI of CD80, CD86, CCR7 and labeled vaccine in migratory or resident cDC1 or moDC in popliteal LN of naïve (gray) or SNP-SC mice after vaccination (concatenated, n = 3). h,i, Flow cytometric analysis of single cells stained with XCR1 and CD86 after gating on cDC1s in spleens or popliteal LNs of mice post SNP-IV or SNP-SC respectively (n = 3). Data are representative of two independent experiments.
Extended Data Fig. 6 |
Extended Data Fig. 6 |. Prolonged antigen presentation by DC drives CD8 T cell responses after SNP-SC.
a, WT, Batf3−/− or CCR2−/− mice (n = 10) were vaccinated SC or IV at 8 nmol on day 0 and day 14 with SNP-7/8a (Reps1) (n = 3). b, Total number of cDC1s in spleen and popliteal LN, or monocytes in popliteal LN (right panel) of WT, Batf3−/− or CCR2−/− were measured. c, BM chimeras were performed by irradiating WT CD45.1 mice and transferring BM from CCR2DTR or WT CD45.2 mice. After 8 weeks of proper reconstitution, mice were treated with DT (n = 3). d, Total number of monocytes, cDC1 and cDC2 in spleen of CCR2DTR mice 24 h after DT treatment was measured. e, Kinetics of neoAg-specific CD8 T cell responses in blood of CCR2DTR vaccinated IV without DT treatment, or WT CD45.2 BM chimera vaccinated IV with or without prior DT treatment showed similar responses (n = 8–10). f, Sera were collected after SNP-SC (blue) or SNP-IV (red). IL-12 (left panel) or IFN-α (right panel) were measured by ELISA (n = 3). g, Total number of monocytes and cDC1 in popliteal LN of WT, IFNAR−/− or TLR−/− were measured by flow cytometry. h, Histograms of EOMES gated on tetramer+ cells post SNP-SC in WT or IL-12−/− mice (n = 4). Data are representative of two independent experiments. Statistics were assessed by Mann Whitney test (d) or Kruskal-Wallis with Dunn’s correction for multiple comparisons (g).
Figure 1 |
Figure 1 |. Route and dose of SNP-7/8a immunization controls the magnitude and phenotype of antigen-specific CD8 T cells.
a, Schematic of peptide–TLR7/8 agonist vaccines that form self-assembling nanoparticles (SNP-7/8a). b, C57BL/6 mice (n = 10) were vaccinated subcutaneously (SC) or intravenously (IV) at 2, 8 or 32 nmol on day 0 and day 14 with SNP-7/8a containing Reps1, an MC38 neoantigen. Whole blood was collected on day 7 and day 21 to measure the frequency of tetramer+ CD8+ T cells. c, Flow cytometric analysis of single cells stained with Reps1 tetramer and CD44 antibody. Numbers indicate percentage of cell population within the gate. d, Bar graphs summarize the frequency of tetramer+ CD8+ T cells from blood (n = 10) on day 7. e, CD8+ T cells were subdivided into memory precursor effector cells (MPEC, tan gate) or short-lived effector cells (SLEC, crimson gate) based on CD127 and KLRG1 expression. f, Bar graphs show proportions of MPEC/SLEC subpopulations in the blood on day 7 (n = 10). g, Frequency of MPEC is negatively correlated to frequency of tetramer+ CD8+ T cells. h, Tetramer+ cells can be subdivided into PD-1+ (black), Tim-3+ (light green) or PD-1+Tim-3+ (dark green) cells. Bar graphs show proportions of PD-1/Tim-3 subpopulations on day 7 (n = 10) of i, tetramer+ cells or j, IFNγ+ cells. Data are representative of two independent experiments. The bars represent the median. Statistics were assessed by Kruskal-Wallis with Dunn’s correction for multiple comparisons (d,f,i,j) and Spearman correlation (g).
Figure 2 |
Figure 2 |. Intravenous administration of SNP-7/8a generates TCF1+ CD8+ T cells with anti-tumor capacity upon anti-PD-L1 treatment.
a, Mice (n = 16) were vaccinated SC or IV with SNP-7/8a (Reps1). Whole blood, spleens, popliteal lymph nodes (LN) and lungs were collected prior to tumor implantation on day 28. b, Tumor growth curves and c, Kaplan-Meier survival curves of mice unvaccinated (black) or vaccinated with SNP-SC (blue) or SNP-IV (red) with (dotted line) or without α-PD-L1 (solid line) (n = 13). d, Flow cytometric analysis of single cells stained with Reps1 tetramer and CD44 antibody. Numbers indicate percentage of cell population within the gate. e, Frequency of tetramer+ CD8+ T cells from blood (n = 32), spleen, popliteal LN and lungs (n = 6) on day 27 post vaccination. f, Effector CD8+ T cells in the spleen were subdivided into TCF1 (grey), TCF1+PD-1 (teal) or TCF1+PD-1+ (dark blue) populations. g, Bar graphs summarize the frequencies of TCF1 subpopulations in the spleen (n = 6) after SNP-SC or SNP-IV. h, Histograms show differential expression of phenotypic markers expressed by TCF1+ (dark blue) or TCF1 (grey) populations after SNP-SC (top panel) or SNP-IV (bottom panel) as assessed by flow cytometry (concatenated, n = 6). Data are representative of four independent experiments. Mean ± s.e.m. (b,e,g). Statistics were assessed by two-way ANOVA with Bonferroni correction (b), Log-rank test (c) and Mann Whitney test (e,g).
Figure 3 |
Figure 3 |. Single-cell analysis of neoAg+ CD8+ T cells by RNA sequencing identifies stem-like gene signature in SNP-IV and effector gene signature in SNP-SC cells.
a, Mice (n = 5) were vaccinated SC or IV with SNP-7/8a (Reps1). Spleens were collected on day 28 and tetramer+ CD8+ T cells were sorted by flow cytometry. Single cell RNA sequencing was performed by 10X Genomics. b, UMAP of sorted neoAg+ CD8+ T cells from spleen. Twelve clusters were generated by Monocle 3 (k = 12) analysis of gene expression. c, Single cells from SNP-IV (Top panel) or SNP-SC (bottom panel) cluster in distinct regions of the UMAP space. d, Bar graphs summarize the frequencies of stem-like cells (clusters 2 and 4, left panel) or effector cells (clusters 1, 3, 5, 7 and 8, right panel) of total tetramer+ CD8+ T cells in the spleen (n = 5). e, Reconstruction of pseudotime trajectory using Monocle 3 algorithm. f, Venn diagram comparing identified differentially expressed genes (DEG) of stem-like cells in this study and three published datasets. g, A list of stem-like or effector gene signatures were overlaid on the UMAP of single cell data. Expression of top DEG of stem-like (top panel) or effector (bottom panel) cells are presented as meaning plots. h, Heatmap of selected DEG expressed in each cluster organized along the pseudotime trajectory. i, Heatmap of significant changes in regulons’ activity as inferred by SCENIC analysis. Statistics were assessed by Mann Whitney test (d).
Figure 4 |
Figure 4 |. Therapeutic vaccination with SNP-IV generates neoAg-specific CD8+ T cells with superior anti-tumor capacity.
a, Mice (n = 10) were implanted with MC38, vaccinated with SNP-7/8a (Reps1) and treated with CPI. b,c, Flow analysis of blood stained with tetramer and CD44 antibody (n = 10). d, Tumor growth of SNP-SC or SNP-IV mice (n = 10). e, Average tumor growth and f, survival of Reps1 IV (red), irrelevant IV (maroon), Reps1 SC (blue) and unvaccinated (black) mice. g, Average tumor growth and h, survival of SNP-IV mice treated with isotype (red) or blocking antibodies against CD8+ (black), CD4+ (blue) and NK cells (purple) (n = 10). i, Average tumor growth and j, survival of mice vaccinated with SNP-IV once (blue), vaccinated once and given CPI (green), vaccinated twice (orange), vaccinated twice and given CPI (red) or untreated (black) (n = 10). k, Flow cytometric analysis of spleens stained with tetramer and CD44 antibody. l, Frequency and m, total number of tetramer+ CD8+ T cells on day 21 (n = 3). n, Flow cytometric analysis of spleens stained with TCF1 and Granzyme B. Total number of o, stem-like cells (TCF1+Granzyme B) and p, effector cells (TCF1 Granzyme B+) on day 21 (n = 3) (unpaired t-test). Data are representative of four independent experiments. The bars represent the median (c) or mean (l,m). Mean ± s.e.m. (e,g,i,o,p). Statistics were assessed by two-way ANOVA (e,g,i), Log-rank test (f,h,j), Mann Whitney test (c) and two-tailed unpaired t-test (l,m,o,p).
Figure 5 |
Figure 5 |. Transient vaccine distribution to spleen and activation of migratory cDC1 and moDC in after SNP-IV.
a, Mice (n = 3) were vaccinated with SNP-7/8a labeled with Alexa Fluor 647. Popliteal LNs and spleens were harvested from mice at specified time points. Confocal images of sections from popliteal LNs collected 0 h, 6 h, 24 h, 7 d and 14 d after SC injection with labeled SNP-7/8a. Left panel, vaccine; Right panel, merged. White, vaccine; magenta, B220 (B cells); green, CD11c (moDC or cDC); red, CD64 (monocytes or macrophages). Scale bars, 200 μm. b, Confocal images of sections from spleens collected 0 h, 6 h, 24 h, 3 d and 7 d after IV injection with labeled SNP-7/8a. Left panel, vaccine; Right panel, merged of inset. White, vaccine; blue, CD11b (monocytes, macrophages or cDC2), CD11c (moDC or cDC). Scale bars, 200 μm or 50 μm (inset). c, Popliteal LNs and spleens were harvested, and single cell suspensions were assessed by flow cytometry for detailed identification of DC subsets. Kinetics of vaccine+ cDC1 (XCR1+MHCII+CD11c+; top panels) and moDC (F4/80+CD64+MHCII+CD11c+; bottom panels) in popliteal LN (left panels) or spleen (right panels) after injection with labeled vaccines via SC or IV respectively (n = 3). d, Graphs summarize the mean fluorescence intensity (MFI) of CD80 (left panel), CD86 (middle panel) and PD-L1 (right panel) expressed on cDC1 and moDC in popliteal LN after SNP-SC (blue lines) or in spleen after SNP-IV (red lines) (n = 3). Mean ± s.e.m. (c,d). Data are representative of two independent experiments.
Figure 6 |
Figure 6 |. Prolonged antigen presentation by DC drives CD8+ T cell responses after SNP-SC.
Kinetics of neoAg-specific CD8+ T cells following a, SNP-SC or b, SNP-IV in Batf3−/− (triangle), Ccr2−/− (square), Ccr2DTR treated with DT (half square) compared to WT mice (circle) (n = 10). c, IL-12 (left panel) and IFN-α (right panel) were measured by ELISA in supernatants of cultured spleens or popliteal LN following SNP-IV or SNP-SC respectively (n = 3). d, Bar graphs summarize neoAg-specific CD8+ T cells following SNP-SC in WT mice (circle) (n = 8), IL12b−/− (open triangle) (n = 4), Ifnar−/− (open square) (n = 5), Tlr7−/− (open circle) (n = 5). e,f, Flow analysis of splenocytes stained with tetramer and CD44 antibody following SNP-SC in WT (n = 8) or Il12b−/− (n = 4) mice. g,h, CD8+ T cells in the spleen after SNP-SC were subdivided into TCF1 (grey), TCF1+PD-1 (teal) or TCF1+PD-1+ (dark blue). Bar graphs summarize the frequencies of TCF1 subpopulations (n = 4). i, CD45.1 mice (n = 3) were vaccinated with SNP-7/8a (SIINFEKL). 1-, 3- or 7-days post vaccination, naive CD8+ T cells from CD45.2 OT-I mice were labeled and transferred into CD45.1 mice. Four days post transfer, spleens were assessed for cell proliferation. j, Graphs summarize the number of CPDlo cells after SNP-SC (left panel) or SNP-IV (right panel) (n = 3). Data are representative of two independent experiments. The bars represent the median (d) or mean (h). Mean ± s.e.m. (a,b,c,j). Statistics were assessed by Mann Whitney test (a,b,j) or Kruskal-Wallis test with Dunn’s correction for multiple comparisons (d).

References

    1. Rosenberg SA & Restifo NP Adoptive cell transfer as personalized immunotherapy for human cancer. Science 348, 62–68 (2015). - PMC - PubMed
    1. Schumacher TN & Schreiber RD Neoantigens in cancer immunotherapy. Science 348, 69–74 (2015). - PubMed
    1. Tumeh PC, et al. PD-1 blockade induces responses by inhibiting adaptive immune resistance. Nature 515, 568–571 (2014). - PMC - PubMed
    1. Versluis JM, Long GV & Blank CU Learning from clinical trials of neoadjuvant checkpoint blockade. Nat Med 26, 475–484 (2020). - PubMed
    1. Kreiter S, et al. Mutant MHC class II epitopes drive therapeutic immune responses to cancer. Nature 520, 692–696 (2015). - PMC - PubMed

Publication types