. 2021 Mar;31(3):312-325.
doi: 10.1038/s41422-020-00433-1. Epub 2020 Nov 2.

Gephyrin-mediated formation of inhibitory postsynaptic density sheet via phase separation

Affiliations

Gephyrin-mediated formation of inhibitory postsynaptic density sheet via phase separation

Guanhua Bai et al. Cell Res. 2021 Mar.

Abstract

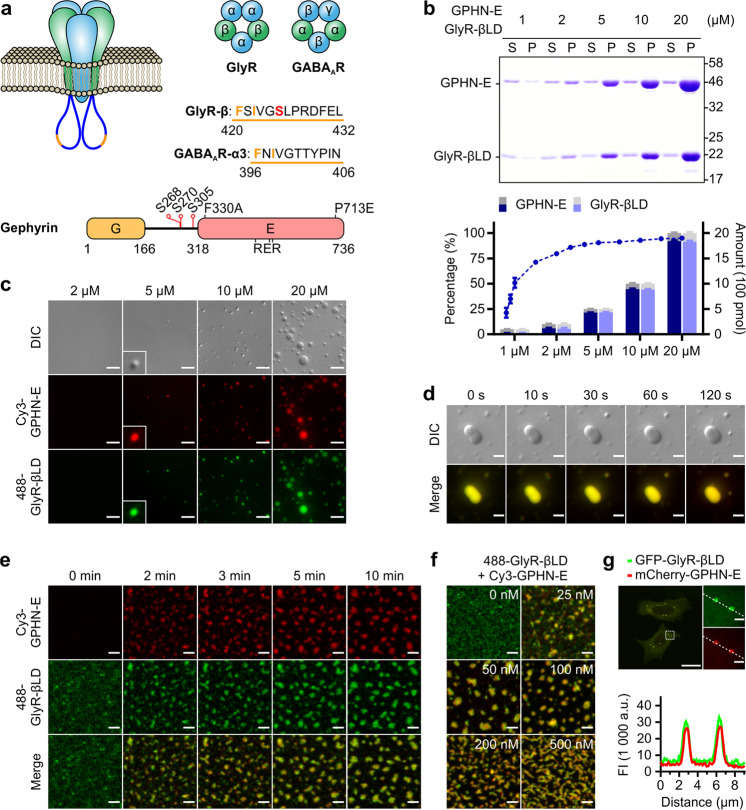
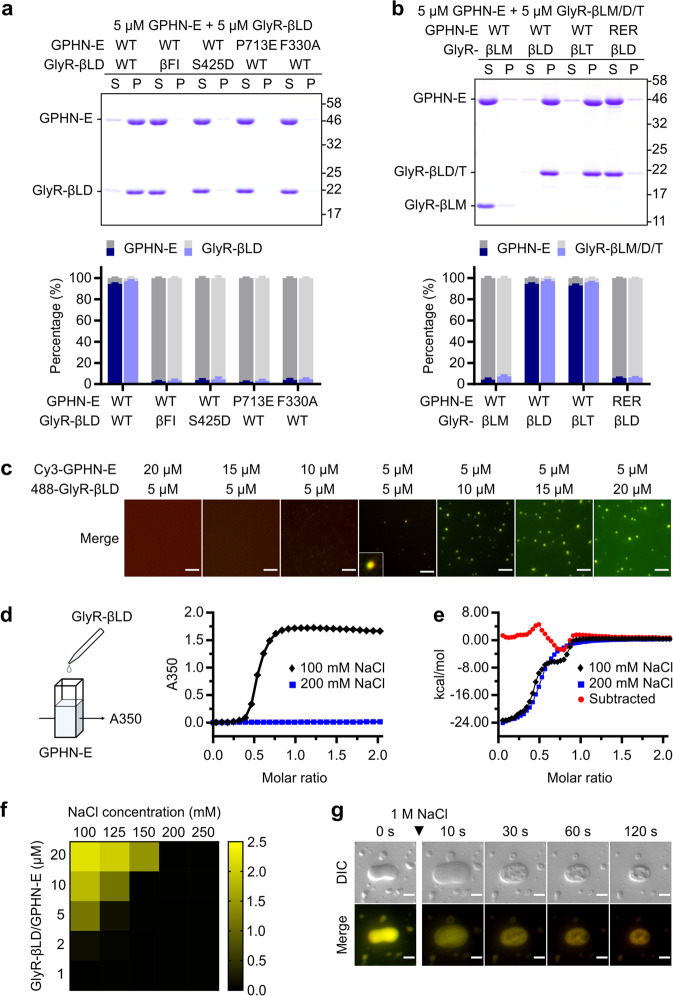
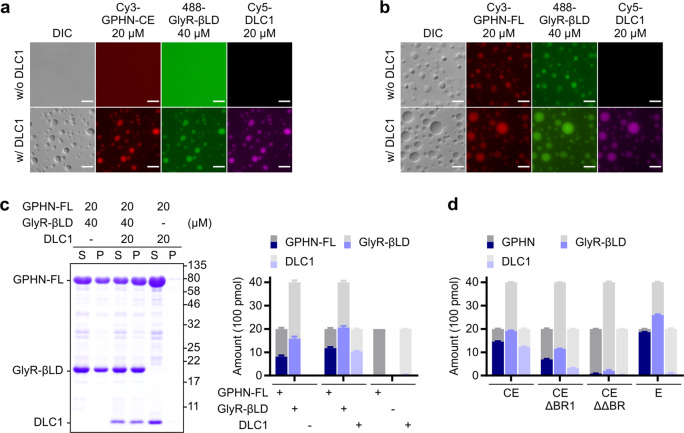
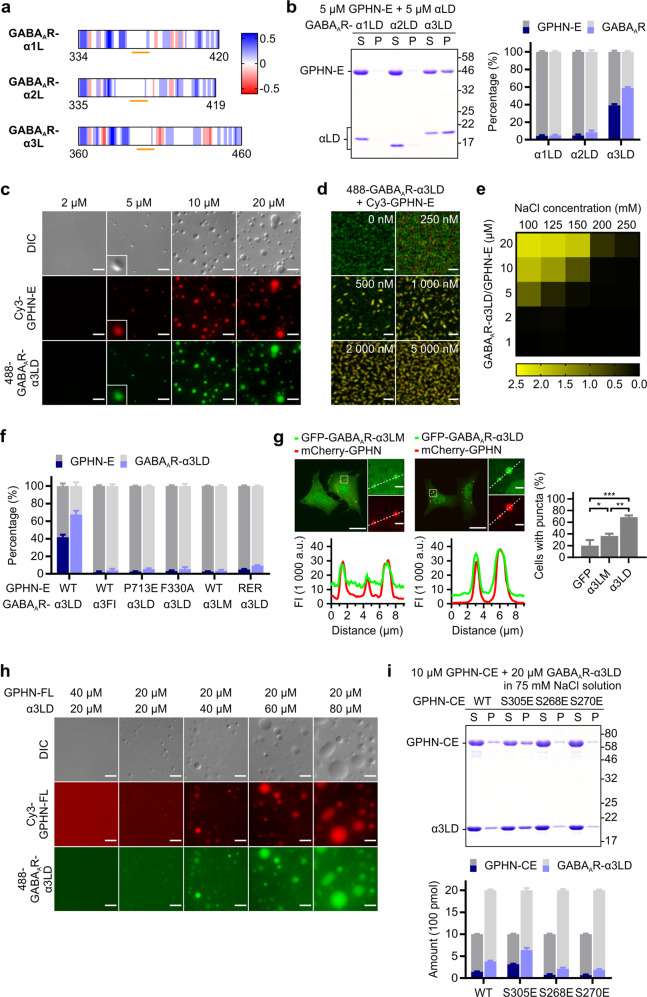
Inhibitory synapses are also known as symmetric synapses due to their lack of prominent postsynaptic densities (PSDs) under a conventional electron microscope (EM). Recent cryo-EM tomography studies indicated that inhibitory synapses also contain PSDs, albeit with a rather thin sheet-like structure. It is not known how such inhibitory PSD (iPSD) sheet might form. Here, we demonstrate that the key inhibitory synapse scaffold protein gephyrin, when in complex with either glycine or GABAA receptors, spontaneously forms highly condensed molecular assemblies via phase separation both in solution and on supported membrane bilayers. Multivalent and specific interactions between the dimeric E-domain of gephyrin and the glycine/GABAA receptor multimer are essential for the iPSD condensate formation. Gephyrin alone does not form condensates. The linker between the G- and E-domains of gephyrin inhibits the iPSD condensate formation via autoinhibition. Phosphorylation of specific residues in the linker or binding of target proteins such as dynein light chain to the linker domain regulates gephyrin-mediated glycine/GABAA receptor clustering. Thus, analogous to excitatory PSDs, iPSDs are also formed by phase separation-mediated condensation of scaffold protein/neurotransmitter receptor complexes.


Conflict of interest statement

The authors declare no competing interests.

Figures

Fig. 1
Fig. 1. Phase separation of the GPHN-E/GlyR-βLD complex.
a Schematic diagrams showing the pentameric subunit assembly of GlyR or GABAAR. The gephyrin binding core sequences in the cytoplasmic TM3–4 loops of the receptors are highlighted by an orange line and the amino acid sequences are shown. The figure also shows the domain organization of gephyrin. The positions of mutations introduced into the recombinant receptor loops and gephyrin proteins, as well as three potential phosphorylation sites in the gephyrin C-domain are indicated. b Representative SDS-PAGE of sedimentation experiments (upper panel) and quantification of relative (line graph, left y-axis) and absolute (bar graph, right y-axis) amount of proteins recovered in the supernatant (S, gray columns) and pellet (P, blue columns) (lower panel) in the assay. Proteins were mixed at the indicated concentrations. Data from three different batches of experiments were presented as means ± SD. c DIC and fluorescence images showing that mixtures of Cy3-GPHN-E and 488-GlyR-βLD at the 1:1 molar ratio and indicated concentrations formed phase-separated droplets. The boxes show a 5× zoom-in analysis of a droplet at the 5 μM of the protein concentration. Scale bars, 10 μm. d Time-lapse imaging showing the fusion of two small droplets into a larger one. The concentration of the protein mixture was 20 μM. Scale bars, 5 μm. e Time-lapse imaging showing that membrane-tethered 488-GlyR-βLD gradually formed clusters on lipid bilayers upon the addition of 100 nM Cy3-GPHN-E. Scale bars, 2 μm. f Fluorescence images showing that the clustering patterns of membrane-tethered 488-GlyR-βLD on lipid bilayers depended on the concentration of Cy3-GPHN-E. Cy3-GPHN-E was added at the indicated concentrations. Scale bars, 2 μm. g Top panel: representative fluorescence images showing that co-expression of mCherry-GPHN-E with GFP-GlyR-βLD in HeLa cells led to the formation of many puncta with the two proteins colocalized together in each punctum. These puncta are not enriched with membranes (Fig. S4a). The dashed box is magnified and shown at right. Scale bars, 20 μm. Scale bars for the zoomed-in images are 2 μm. Bottom panel: fluorescence intensity line-scanning plots showing that both proteins were concentrated and colocalized together in the two bright puncta shown in the zoomed-in images.
Fig. 2
Fig. 2. Multivalent interactions between GlyR-βL and GPHN-E are required for the phase separation of the complex.
a Representative SDS-PAGE of sedimentation experiments (upper panel) and quantification of protein distributions in the supernatant (S, gray columns) and pellet (P, blue columns) (lower panel) showing the phase separation capacities of different mutant proteins. Data from three different batches of experiments were presented as means ± SD. b Representative SDS-PAGE of sedimentation experiments (upper panel) and quantification of protein distributions in the supernatant (S, gray columns) and pellet (P, blue columns) (lower panel) showing the phase separation capacities of proteins with different oligomerization states. Data from three different batches of experiments were presented as means ± SD. c Fluorescence images showing the phase separation of the Cy3-GPHN-E/488-GlyR-βLD mixtures at the indicated protein concentrations/ratios. Scale bars, 10 μm. d Turbidity assay of the phase separation of the GPHN-E/GlyR-βLD complex. GlyR-βLD (100 μM) was titrated into a 10 μM GPHN-E solution in a 1 cm cuvette with 100 mM NaCl (black) or 200 mM NaCl (blue) in the assay buffer solution, the absorbance at 350 nm at each titration point was measured. e Representative high-resolution ITC titration isotherms showing the titrations of 100 μM GlyR-βLD into the reaction cell containing 10 μM GPHN-E with 100 mM NaCl (black) or with 200 mM NaCl (blue) in the binding buffer. The red curve is derived by subtracting the blue isotherms from the black isotherms and represents the enthalpy changes resulted from the phase separation of the GPHN-E/GlyR-βLD complex during the titration. f Phase diagram showing the phase separation of the GPHN-E/GlyR-βLD complex as functions of buffer NaCl concentration and protein concentrations. The degree of phase separation at each data point was derived from the turbidity assay as described in d. g Time-lapse DIC and fluorescence imaging showing the dispersion of the GPHN-E/GlyR-βLD complex droplets by the addition of NaCl to the sample buffer. Proteins were initially mixed at 20 μM at the 1:1 ratio. Scale bars, 5 μm.
Fig. 3
Fig. 3. Charge–charge interactions are critical for the phase separation of the GPHN-E/GlyR-βLD complex.
a Heat maps showing the net charge distributions of the TM3–4 loop of the GlyR β subunit. The schematic diagrams also show the deletion or mutation constructs used in the study. In the diagram, “−ve4S” is short for replacing 4 Glu and Asp with Ser; “+ve6S” stands for substituting 6 Arg and Lys residues with Ser. Mutations of GlyR-βL that led to failed phase separation with GPHN-E are indicated by (−), and the mutations that retained the ability to phase separate with GPHN-E are indicated by (+). See also Supplementary information, Fig. S6a. b DIC and fluorescence images showing the enhanced phase separation of the Cy3-GPHN-E/488-GlyR-βLD_“−ve4S” complex at 5 μM and abolished phase separation of the Cy3-GPHN-E/488-GlyR-βLD_“+ve6S” complex at 20 μM compared to the WT protein complex in solution (Fig. 1c). Scale bars, 10 μm. c Fluorescence images showing the enhanced clustering of membrane-tethered 488-GlyR-βLD_“−ve4S” and weakened clustering of 488-GlyR-βLD_“+ve6S” induced by Cy3-GPHN-E on lipid bilayers (compared with Fig. 1f). Cy3-GPHN-E was added at the indicated concentrations. Scale bars, 2 μm. d Surface charge potential map of the GPHN-E dimer (PDB: 5ERQ) in complex with GlyR-βL (shown in the yellow ribbon and tube model). The highly negatively charged surface of the GPHN-E subdomain II is highlighted with a red circle and enlarged to show the clustering of 6 negatively charged residues and the position of G375 in the domain. The corresponding amino acid sequences are shown at the bottom. The physical dimensions of GPHN-E dimer are indicated at the upper right corner. e DIC and fluorescence images showing the weakened phase separation of the Cy3-GPHN-E_ED6S/488-GlyR-βLD complex at 20 μM compared to the WT protein complex (Fig. 1c). Scale bars, 10 μm. f Fluorescence images showing that membrane-tethered 488-GlyR-βLD could not be clustered by Cy3-GPHN-E_ED6S on lipid bilayers. Cy3-GPHN-E_ED6S was added at the indicated concentrations. Scale bars, 2 μm. g Quantification of protein amounts recovered in the supernatant (S, gray columns) and pellet (P, blue columns) showing that GPHN-E_ED6S and GPHN-E_G375D showed decreased capacities in forming condensates with GlyR-βLD. GPHN-E or its mutant was mixed with GlyR-βLD at the indicated concentrations. Data from three different batches of experiments were presented as means ± SD.
Fig. 4
Fig. 4. The C-domain inhibits the E-domain-mediated phase separation of gephyrin with GlyR-βLD.
a Top: representative fluorescence images showing the co-expression of GFP-tagged monomeric or dimeric GlyR-βL with gephyrin in HeLa cells. The region shown with the dashed box in each image is magnified and shown at right. Scale bars, 20 μm. Scale bars for the zoomed-in images, 2 μm. Bottom: fluorescence intensity line-scanning plots of the dashed lines in the magnified images showing that an increase of the GlyR-βL valence led to enhanced co-clustering of GFP-GlyR-βL with mCherry-GPHN. b Quantification of the number of puncta with two proteins colocalized in puncta-positive cells and the percentage of cells containing such puncta over the total co-transfected cells. Data from three batches of cultures were presented as means ± SD. ns, not significant; ****P < 0.0001. c DIC and fluorescence images showing the phase separation of the Cy3-GPHN-FL/488-GlyR-βLD mixture at different molar ratios. Proteins were mixed at indicated concentrations in 50 mM NaCl solution. Scale bars, 10 μm. d Time-lapse imaging showing the fusion of small droplets of the Cy3-GPHN-FL/488-GlyR-βLD complex into larger ones. Proteins were mixed at indicated concentrations in 50 mM NaCl solution. Scale bars, 5 μm. e Representative SDS-PAGE of sedimentation experiments (upper panel) and quantification of protein amounts in the supernatant (S, gray columns) and pellet (P, blue columns) (lower panel) showing that the gephyrin C-domain plays an inhibitory role in the phase separation of the gephyrin/GlyR-βLD complex. 20 μM gephyrin or its variants were mixed with 40 μM GlyR-βLD. Data from three different batches of experiments were presented as means ± SD. f Schematic diagrams showing the regions of the gephyrin C-domain responsible for inhibiting E-domain-mediated phase separation with GlyR-βLD. The C-domain is separated into three segments (CI, CII, and CIII). Two phase separation inhibitory regions (“Inhibitory Region 1” and “Inhibitory Region 2”) are marked. The locations and sequences of two DLC1 binding regions (“DLC1 BR1” and “DLC1 BR2”) are also indicated. The three previously identified phosphorylation sites (S268, S270, S305) are highlighted in red. See also Supplementary information, Fig. S8.
Fig. 5
Fig. 5. DLC1 promotes phase separation of the gephyrin/GlyR-βLD complex.
a, b DIC and fluorescence images showing that DLC1 was enriched in and promoted the phase separation of the Cy3-GPHN-CE/488-GlyR-βLD complex (a) and the Cy3-GPHN-FL/488-GlyR-βLD complex (b) at the indicated protein concentrations. Scale bars, 10 μm. c Representative SDS-PAGE of sedimentation experiments (left panel) and quantification of protein amounts in the supernatant (S, gray columns) and pellet (P, blue columns) (right panel) showing that DLC1 co-sedimented and increased the condensate formation of the GPHN-FL/GlyR-βLD complex. Proteins were mixed at indicated concentrations. Data from three different batches of experiments were presented as means ± SD. d Quantification of protein amounts in the supernatant (S, gray columns) and pellet (P, blue columns) in sedimentation experiments showing that deleting “DLC1 binding region 1” or “DLC1 binding regions 1 & 2” weakened or even abolished DLC1-mediated enhancement of the phase separation of the GPHN-CE/GlyR-βLD complex. See also Supplementary information, Fig. S9.
Fig. 6
Fig. 6. Phase separation of the gephyrin/GABAAR-α3LD complex.
a Charge distributions of the cytoplasmic TM3–4 loops in the GABAAR α subunits. The positions of the core binding sequences for gephyrin are highlighted by orange lines. b Representative SDS-PAGE of sedimentation experiments (left panel) and quantification of protein distributions in the supernatant (S, gray columns) and pellet (P, blue columns) (right panel) showing the phase separation capacities of different GABAAR α subunit TM3–4 loops. Data from three batches of experiments were presented as means ± SD. c DIC and fluorescence images showing that mixtures of Cy3-GPHN-E and 488-GABAAR-α3LD at the 1:1 molar ratio formed droplets at the indicated concentrations. The boxes show a 5× zoom-in analysis of a droplet at the 5 μM of the protein concentration. Scale bars, 10 μm. d Fluorescence images showing that the clustering patterns of membrane-tethered 488-GABAAR-α3LD on lipid bilayers depended on the concentration of Cy3-GPHN-E added. Scale bars, 2 μm. e Phase diagram showing the phase separation of the GPHN-E/GABAAR-α3LD complex as functions of buffer NaCl concentration and protein concentrations. The degree of phase separation at each data point was derived from the turbidity assay as described in Fig. 2d. f Quantification of protein distributions in the supernatant (S, gray columns) and pellet (P, blue columns) showing the phase separation capacities of different GPHN-E mutants or GABAAR-α3L in different oligomerization states. Proteins were mixed at 5 μM at the 1:1 ratio. Data from three different batches of experiments were presented as means ± SD. g Left and middle panels: representative fluorescence images showing the co-expression of mCherry-GPHN with GFP-GABAAR-α3LM or with GFP-GABAAR-α3LD in HeLa cells. The region highlighted with a dashed box in each image is zoomed-in at right. Fluorescence intensity line-scanning plots showing the distribution profile of GFP-GABAAR-α3LM or GFP-GABAAR-α3LD with that of mCherry-GPHN as indicated by the dashed lines in each zoomed-in image. Scale bars, 20 μm. Scale bars for the zoomed-in images, 2 μm. Right panel: quantification of the percentage of cells with two proteins colocalized puncta over the total co-transfected cells. Data from three batches of cultures were presented as means ± SD. *P < 0.05; **P < 0.01; ***P < 0.001. h DIC and fluorescence images showing the phase separation of the Cy3-GPHN-FL/488-GABAAR-α3LD mixtures at indicated molar ratios. Proteins were mixed at indicated concentrations in the imaging buffer containing 50 mM NaCl. Scale bars, 10 μm. i Representative SDS-PAGE of sedimentation experiments (upper panel) and quantification of protein amounts in the supernatant (S, gray columns) and pellet (P, blue columns) (lower panel) showing that the phosphorylation of different sites in the gephyrin C-domain had different effects on the phase separation of the GPHN-CE/GABAAR-α3LD complex. 10 μM GPHN-CE and 20 μM GABAAR-α3LD were mixed in the assay buffer containing 75 mM NaCl. Data from three different batches of experiments were presented as means ± SD.
Fig. 7
Fig. 7. A schematic model showing GABAAR/GlyR binding-induced iPSD formation by gephyrin.
a Clustering of GABAAR/GlyR on the synaptic plasma membrane and formation of the gephyrin sheet beneath the synaptic membrane via receptor binding-induced phase separation. Note that the width of the gephyrin E-domain dimer is ~11 nm, and the distance between the two GABAAR receptors in iPSD is also ~11 nm. b A top-down view from the extracellular side of the synaptic membranes showing the phase separation-mediated GABAAR/GlyR clustering and organization by the gephyrin condensates. c A schematic diagram showing progressive steps of zoomed-in views of an inhibitory synapse to show the formation of the iPSD sheet via phase separation.

Comment in

Similar articles

Cited by

References

    1. Biederer T, Kaeser PS, Blanpied TA. Transcellular nanoalignment of synaptic function. Neuron. 2017;96:680–696. doi: 10.1016/j.neuron.2017.10.006. - DOI - PMC - PubMed
    1. Sudhof TC. Towards an understanding of synapse formation. Neuron. 2018;100:276–293. doi: 10.1016/j.neuron.2018.09.040. - DOI - PMC - PubMed
    1. Chen X, Wu X, Wu H, Zhang M. Phase separation at the synapse. Nat. Neurosci. 2020;23:301–310. doi: 10.1038/s41593-019-0579-9. - DOI - PubMed
    1. Zeng M, et al. Phase transition in postsynaptic densities underlies formation of synaptic complexes and synaptic plasticity. Cell. 2016;166:1163–1175. doi: 10.1016/j.cell.2016.07.008. - DOI - PMC - PubMed
    1. Zeng M, et al. Reconstituted postsynaptic density as a molecular platform for understanding synapse formation and plasticity. Cell. 2018;174:1172–1187. doi: 10.1016/j.cell.2018.06.047. - DOI - PubMed

Publication types

MeSH terms