. 2020 Nov;22(11):1357-1370.
doi: 10.1038/s41556-020-00596-4. Epub 2020 Nov 2.

Phosphatidylinositol-3-OH kinase signalling is spatially organized at endosomal compartments by microtubule-associated protein 4

Affiliations

Phosphatidylinositol-3-OH kinase signalling is spatially organized at endosomal compartments by microtubule-associated protein 4

Narendra Thapa et al. Nat Cell Biol. 2020 Nov.

Abstract

The canonical model of agonist-stimulated phosphatidylinositol-3-OH kinase (PI3K)-Akt signalling proposes that PI3K is activated at the plasma membrane, where receptors are activated and phosphatidylinositol-4,5-bisphosphate is concentrated. Here we show that phosphatidylinositol-3,4,5-trisphosphate generation and activated Akt are instead largely confined to intracellular membranes upon receptor tyrosine kinase activation. Microtubule-associated protein 4 (MAP4) interacts with and controls localization of membrane vesicle-associated PI3Kα to microtubules. The microtubule-binding domain of MAP4 binds directly to the C2 domain of the p110α catalytic subunit. MAP4 controls the interaction of PI3Kα with activated receptors at endosomal compartments along microtubules. Loss of MAP4 results in the loss of PI3Kα targeting and loss of PI3K-Akt signalling downstream of multiple agonists. The MAP4-PI3Kα assembly defines a mechanism for spatial control of agonist-stimulated PI3K-Akt signalling at internal membrane compartments linked to the microtubule network.


Conflict of interest statement

CONFLICT OF INTEREST

The authors declare no competing interests

Figures
Extended Data Fig. 1
Extended Data Fig. 1. Co-localization of Activated Akt and PI3,4,5P3 with Endosomal Compartments
a, Spatial localization of activated Akt with endosomal vesicles. MDA-MB-231 cells stimulated with EGF were immunostained with antibodies for pAkt and clathrin (CHC) or early endosome antigen 1 (EEA1) or transferrin receptor (TFR). The co-localization of pAkt with CHC/EEA1/TFR was quantified in unstimulated vs EGF stimulated cells by Pearson’s correlation coefficient (Pearson’s r). Scale bar, 5 μm; Error bars denote mean±SD; n=30 cells from representative experiments b, c Abrogation of EGF stimulated Akt activation and PI3,4,5P3 generation by PI3K inhibitors. MDA-MB-231 cells were treated with wortmannin or LY294002 compound before EGF stimulation. Cells were harvested and processed for immunoblotting or immunostaining using antibodies specific for activated Akt or PI3,4,5P3. Activated Akt and PI3,4,5P3 levels were quantified. Scale bar, 5 μm; Error bars denote mean±SD; n=4 independent experiments (b), n=30 cells from representative experiments (c)

d, e, f, Examination of the activation level of GFP-tagged full-length Akt1 and their localization upon EGF stimulation. Cos-7 cells transiently transfected with GFP-tagged full-length Akt1 were pre-treated with PI3K inhibitors before EGF stimulation. Localization of GFP-tagged full-length Akt1 with different endosomal vesicles were quantified. Scale bar, 5 μm; Error bars denote mean±SD; n=30 cells from representative experiments

g, Detection of PI3,4,5P3 in EGF stimulated cells by three different antibodies specific to PI3,4,5P3. Scale bar: 5 μm; Error bars denote mean±SD; n=30 cells from representative experiments Unprocessed_Western_Blots_Extended_Data_Fig1; Statistical_Source_Data_Extended_Data_Fig1
Extended Data Fig. 2
Extended Data Fig. 2. Detection of PI3,4,5P3 by PH domain GFP Reporter; Localization of activated EGFR upon EGF stimulation; Effect of Endocytosis Inhibitor in Co-localization of Activated Akt and PI3,4,5P3 with Clathrin Vesicles
a, b, Spatial localization of GFP-tagged PH domain of Akt1 in EGF stimulated cells. Hs578T cells stably expressing GFP-tagged PH domain of Akt1 were stimulated with EGF for 5-minutes and co-localization of GFP signal with CHC/EEA1/TFR was quantified in unstimulated vs stimulated cells by Pearson’s r. Scale bar, 5 μm; Error bars denote mean±SD; n=30 cells from representative experiments c, d, Spatial localization of activated EGFR in EGF stimulated cells. MDA-MB-231 cells were stimulated with EGF and localization of activated EGFR at different time points was examined by immunostaining with an antibody specific for phospho-EGFR and tubulin. Scale bar, 5 μm; Error bars denote mean±SD; n=30 cells from representative experiments

e, f, g, Effect of endocytosis inhibitor Dynasore in EGF stimulated activation level of Akt and PI3,4,5P3. The activation level of Akt in MDA-MB-231 cells pretreated with the Dynasore inhibitor before EGF stimulation was quantified by western blotting. Activated Akt and PI3,4,5P3 were also examined by immunostaining and quantified. The image shown is the representative images of multiple reproducible experiments. Scale bar, 5 μm; Error bars denote mean±SD; n=3 independent experiments (e), n=30 cells from representative experiments (g) Unprocessed_Western_Blots_Extended_Data_Fig2; Statistical_Source_Data_Extended_Data_Fig2
Extended Data Fig. 3
Extended Data Fig. 3. PI3Kα Vesicle Distribution in PI3Kα Mutant Expressing Cells; Specificity of PI3Kα Antibody Used and Distribution of Ectopically Expressed p110α
a, Immunostaining of mutant PI3Kα expressing Cal51 and T47D cells with p85α or p110α specific antibodies. PI3Kα were distributed in small vesicle-like structures and its co-localization with microtubules was quantified by Pearson’s r. Scale bar, 5 μm; Error bars denote mean±SD; n=30 cells from representative experiments b, c, Specificity of PI3Kα antibody used. MDA-MB-231 cells transfected with siRNA for knockdown of p85α or p110α were used to demonstrate the loss of signals in knockdown cells by immunoblotting and immunofluorescence study. The immunoblot is the representative of reproducible experiments. Scale bar, 5 μm; Error bars denote mean±SD; n=30 cells from representative experiments

d, Localization of stably expressed HA-tagged p110α WT or mutant forms in MDA-MB-231 cells. Wild type or mutant forms of p110α cloned into pWPT lentiviral vector were stably expressed into MAD-MB-231 cells by retroviral infection. Cells were processed for immunofluorescence study to examine the localization of ectopically expressed p110α using rabbit anti-HA and rat anti-tubulin antibodies. The image shown is the representative images of multiple reproducible experiments. Scale bar: 5 μm

e, Effect of microtubule depolymerization in the distribution of PI3Kα. HeLa cells were either treated with DMSO or nocodazole (1 uM) for 3 hours before fixing the cells with paraformaldehyde. Cells were immunostained with anti-tubulin and anti-p85α or antip110α antibodies to examine the distribution of PI3Kα vesicles along microtubules. The image shown is the representative images of multiple reproducible experiments. Scale bar: 5 μm Unprocessed_Western_Blots_Extended_Data_Fig3; Statistical_Source_Data_Extended_Data_Fig3
Extended Data Fig. 4
Extended Data Fig. 4. PI3Kα is Responsible for Agonist-timulated Akt Activation and PI3,4,5P3 Generation in Internal Membrane Vesicles
a, Effect of PI3Kα knockdown in EGF stimulated Akt activation. MDA-MB-231 cells were individually transfected with three different siRNAs specific for p110α. 48–72 hours post-transfection, cells were stimulated with EGF and activated Akt was examined by immunoblotting. Error bars denote mean±SD; n=3 independent experiments

b, c, d, Expression of HA-tagged p110α rescue the effect on endogenous p110α knockdown in EGF stimulated Akt activation. The siRNAs specific to 3’ UTR (sip110α III) wereused to knockdown p110α in mock or HA-p110α expressing cells. 48–72 hours post-transfection, cells were stimulated with EGF to examine the activation level of Akt by immunoblotting or immunofluorescence microscopy. Scale bar, 5 μm; Error bars denote mean±SD; n=4 independent experiments (b), n=30 cells from representative experiments (c) e, f, g, Effect of PI3Kα inhibitor in EGF stimulated activation level of Akt and PI3,4,5P3. MDA-MB-231 cells were pretreated with PI3K inhibitors (BKM120 or BYL719) before EGF stimulation. The activated Akt level was examined by immunoblotting. Similarly, activated Akt and PI3,4,5P3 co-localized with clathrin vesicles were examined by immunofluorescence microscopy and quantified. The image shown is the representative images of multiple reproducible experiments. Scale bar, 5 μm; Error bars denote mean±SD. n=3 independent experiments (e), n=30 cells from representative experiments (g)

h, EGF stimulation promotes PI3Kα association with PIP5Kα and PIP5Kγ. PI3Kα was immunoprecipitated from MDA-MB-231 cells stimulated with EGF for 5 minutes and co-immunoprecipitation of PIP5Kα and PIP5Kγ was examined by immunoblotting using specific antibodies. The data shown is the representative of multiple reproducible experiments. The immunoblot shown is the representative of reproducible experiments.

i, j, k Knockdown of PIP5Kα or PIP5Kγ affects EGF stimulated PI3,4,5P3 generation and activation level of Akt. MDA-MB-231 cells were transfected with siRNAs for PIP5Kα or PIP5Kγ. 48–72 hours post-transfection, cells were stimulated with EGF and the activation level of Akt was examined by immunoblotting. Activated Akt and PI3,4,5P3 co-localized with clathrin vesicles (CHC) in control vs PIP5Kα or PIP5Kγ knockdown cells were examined by immunofluorescence microscopy by Pearson’s r. The image and immunoblot shown is the representatives of multiple reproducible experiments. Scale bar, 5 μm; Error bars denote mean±SD. n=30 cells from representative experiments. Unprocessed_Western_Blots_Extended_Data_Fig4; Statistical_Source_Data_Extended_Data_Fig4
Extended Data Fig. 5
Extended Data Fig. 5. Co-localization of MAP4 and PI3Kα in different cell types.
a, b, Coomassie staining of proteins co-immunoprecipitated with PI3Kα antibody (anti-p85α and anti-p110α antibodies used together) showed a distinct band above 170 kDa. Mass-spectrometry analysis of the isolated protein band revealed it as microtubule-associated protein 4 (MAP4). The image shown is the representative images of reproducible experiments. Arrow in image indicates the band of interest for mass spectrometry analysis.

c, PI3Kα in small vesicles distribute along MAP4 that mimics microtubules in different cell types. Immunofluorescence study was performed in different cell types using mouse anti-MAP4 and rabbit anti-p110α or p85α antibodies. The image shown is the representative images of reproducible experiments. Scale bar, 5 μm

d, Amino acid alignment of MAP4 MTBD along with that of Tau and MAP2. All four MTBD repeats of MAP4 (MTBD I- MTBD IV) and that of Tau and MAP2 (other microtubule-associated proteins expressed in neuronal cells) show highly similar amino acid order and microtubule-binding motif.

e, Representative MST binding affinity graphs for interaction between His-PI3Kα and GST-MAP4 proteins. Unprocessed_Gel_Image_Extended_Data_Fig5
Extended Data Fig. 6
Extended Data Fig. 6. Co-localization of MAP4/IQGAP1 with EGFR, Effect of MAP4 Knockdown in Distribution of PI3Kα Vesicles along Microtubules in cells expressing WT MAP4 and MTBD Deletion Mutant
a, b, PLA shows induced association of MAP4 and IQGAP1 and that they are localized with EGFR. MDA-MB-231 cells were stimulated with EGF and processed for MAP4-IQGAP1 PLA followed by immunostaining with EGFR. The image shown is the representative images of multiple reproducible experiments. Scale bar, 5 μm; Error bars denote mean±SD; n=30 cells from representative experiments

c, d, e, MAP4 knockdown demonstrated by immunofluorescence study and immunoblotting. Three different siRNAs were used individually to knockdown MAP4 in MDA-MB-231 cells. 48–72 hours after siRNA transfection, cells were processed for immunofluorescence study using an antibody specific to MAP4 and tubulin. MAP4 knockdown was also shown by immunoblotting. The image and blot shown is the representative of reproducible experiments. Scale bar, 5 μm; Error bars denote mean±SD; n=30 cells from representative experiments

f, g, Localization of PI3Kα vesicles along microtubules in WT and MTBD deletion mutant of MAP4 expressing cells after knocking down endogenous MAP4. As described above, siRNAs targeting 3’ UTR region of MAP4 were used to knockdown endogenous MAP4. Cells were processed for immunofluorescence study using antibodies specific for p110α and tubulin. Distribution of PI3Kα vesicles along microtubules was quantified. n=30 cells from representative experiments h, i, Localization of ectopically expressed WT and MTBD deletion mutant of MAP4 after knockdown of endogenous MAP4. The siRNAs targeting the 3’ UTR region of MAP4 (siMAP4#3) were used to knockdown endogenous MAP4 in MDA-MB-231 cells expressing MAP4 WT or MTBD deletion mutant of MAP4. 48–72 hours post-transfection, cells were examined via immunofluorescence study using antibodies specific to MAP4 and tubulin. The colocalization of ectopically expressed MAP4 with tubulin was quantified by Pearson’s r. Scale bar, 5 μm; Error bars denote mean±SD; n=30 cells from representative experiments Unprocessed_Western_Blots_Extended_Data_Fig6; Statistical_Source_Data_Extended_Data_Fig6
Extended Data Fig. 7
Extended Data Fig. 7. Effect of MAP4 Loss in Phosphorylation Level of EGFR and its Distribution in Endosomes
a, b, Effect of MAP4 knockdown in endosomal localization of PI3Kα vesicles. siRNAs targeting the 3’ UTR region of MAP4 (siMAP4#3) were used to knockdown endogenous MAP4 in MDA-MB-231 cells expressing WT or the MTBD deletion mutant of MAP4. 48–72 hours post-transfection, cells were processed for immunofluorescence study using antibodies specific for endogenous p110α and clathrin or TFR. The quantification of the colocalization of p110α and CHC/TFR by Pearson’s r was shown in Figure 5c. The images shown are the representative images of multiple reproducible experiments. Scale bar, 5 μm c, d, The phosphorylation level of EGFR in MAP4 knockdown cells. 48–72 hours post siRNA transfection, cells were stimulated with EGF before examining the phosphorylation level of EGFR by immunoblotting and immunofluorescence microscopy. The immunoblot shown is the representative images of multiple reproducible experiments. Scale bar, 5 μm; Error bars denote mean±SD; n=30 cells from representative experiments

e, Localization of activated EGFR in endosomes in MAP4 knockdown cells. 48–72 hours post siRNA transfection for MAP4 knockdown, cells were stimulated with EGF and processed for immunofluorescence study to examine the co- localization of activated EGFR with endosomes (EEA1 and TFR) by Pearson’s r. Scale bar, 5 μm; Error bars denote mean±SD; n=30 cells from representative experiments Unprocessed_Western_Blots_Extended_Data_Fig7; Statistical_Source_Data_Extended_Data_Fig7
Extended Data Fig. 8
Extended Data Fig. 8. Effect of MAP4 Knockdown in Akt activation, Cell Proliferation, and Cell Invasion.
a, MAP4 loss impairs activation of Akt downstream of EGFR. Three different siRNAs were used individually to knockdown MAP4 in MDA-MB-231 cells. EGF induced Akt activation was analyzed by immunofluorescence microscopy. Scale bar, 5 μm; Error bars denote mean±SD; n=30 cells from representative experiments.

b, c, MAP4 loss impairs Akt activation downstream of integrin receptors. MDA-MB-231 cells were detached from culture plates 72-hours post-siRNA transfection for MAP4 knockdown (siMAP4#1) and resuspended in serum-free medium. Cells were seeded into culture plates-coated with type I collagen before harvesting at different time points followed by immunoblotting or immunofluorescence microscopy using an antibody specific for activated Akt and tubulin. Scale bar: 5 μm. Error bars denote mean±SD; n=4 independent experiments (b), n=30 cells from representative experiments (c)

d, MAP4 overexpression promotes Akt signaling. MDA-MB-231 cells ectopically overexpressing MAP4 or Mock were serumstarved overnight before stimulating with EGF. Cells were harvested at different time points and activation levels of Akt were examined by immunoblotting using activated Akt specific antibody. Error bars denote mean±SD; n=3 independent experiments

e, Effect of MAP4 knockdown in cell proliferation. MDA-MB- 468 and Cal51, both showing higher activation levels of Akt were transfected with siRNA for MAP4 knockdown. 72–96 hours postsiRNA transfection, cell numbers were manually quantified. Scale bar, 100 μm; Error bars denote mean±SD; n=3 independent experiments

f. g, h, Effect of MAP4 knockdown in cell invasion and cell migration. 48–72 hours post-siRNA transfection for MAP4 knockdown, cell invasion and scratch-wound healing for cell migration were performed. The image shown is the representative images of multiple reproducible experiments. Scale bar, 100 μm; Error bars denote mean±SD; n=9 fields from representative experiments (g), n=15 fields from representative experiments (h) Unprocessed_Western_Blots_Extended_Data_Fig8; Statistical_Source_Data_Extended_Data_Fig8
FIGURE 1:
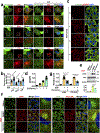
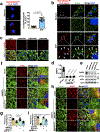
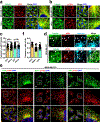
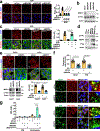
FIGURE 1:. Agonist-stimulated Akt Activation and PI3,4,5P3 Generation at Internal Membranes
a, b, c, Activation of Akt upon agonist stimulation. The activation of Akt in MDA-MB-231 cells at different time points following EGF or insulin or FBS stimulation were examined by immunoblotting using phospho-Akt antibody. Error bars denote mean±SD; n=4 independent experiments d, Spatial localization of activated Akt and PI3,4,5P3 upon EGF stimulation. MDA-MB-231 cells were fixed at different time points following EGF stimulation. Localization of activated Akt and PI3,4,5P3 along microtubules was examined by immunostaining with antibodies specific to phospho-Akt and PI3,4,5P3 respectively. The immunofluorescence signals of activated Akt and PI3,4,5P3 at different time points were quantified. Similarly, the co-localization of activated Akt and PI3,4,5P3 with tubulin were quantified by Pearson’s r. Scale bar, 5 μm; Error bars denote mean±SD; n=30 cells from representative experiments e, f Super-resolution microscopy revealing spatial localization of PI3,4,5P3. MDA-MB-231 cells upon EGF stimulation were immuno-stained for PI3,4,5P3 and tubulin and processed by STED microscopy. PI3,4,5P3 signal was quantified in control vs. EGF stimulated cells. The relative level of PI3,4,5P3 signal and co-localization with tubulin quantified. Scale bar, 1 μm; Error bars denote mean±SD; n=10 cells from representative experiments. g, Quantification of activated Akt and PI3,4,5P3 in plasma membrane and endosomes. MDA-MB-231 cells after EGF stimulation were harvested for subcellular fractionation. The activated Akt and PI3,4,5P3 were quantified in the plasma membrane and endosomal fractions by immunoblotting and ELISA, respectively, as described in “Methods”. Error bars denote mean±SD; n=3 independent experiments Unprocessed_Western_Blots_Fig1; Statistical_Source_Data_Fig1
FIGURE 2:
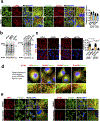
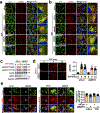
FIGURE 2:. PI3K〈 Localizes in Endosomal Vesicles along Microtubules
a, b, c, Immunostaining of MDA-MB-231 and HeLa with p85α or p110α specific antibodies show the PI3Kα enzyme in small vesicle-like structures distributed along the microtubules. Cells growing on glass coverslips were fixed and processed for immunofluorescence study using either an anti-p85α or anti-p110α antibody as described in “Methods”. The co-localization of PI3Kα vesicles with tubulin was quantified by Pearson’s r. Scale bar, 5 μm; Error bars denote mean±SD; n=30 cells from representative experiments d, Vesicles positive for p85α and p110α co-localize with membrane dye. Cells were labelled with membrane labeling lipophilic dye before seeding onto glass coverslips as described in “Methods”. Cells were processed for immunofluorescence staining for p85α or p110α as described above. Scale bar, 1 μm; The image shown is from representative experiments. e, f, Vesicles positive for p110α staining co-stain with endosomal vesicle markers. MDA-MB-231 Cells were fixed and processed for immunofluorescence study using anti-p110α and CHC/EEA1/TFR antibodies as described in “Methods”. The co-localization of p110α vesicles with CHC/EEA1/TFR was quantified by Pearson’s r. Scale bar, 5 μm; Error bars denote mean±SD; n=30 cells from representative experiments Statistical_Source_Data_Fig2
FIGURE 3:
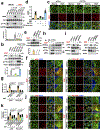
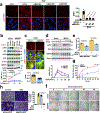
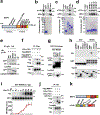
FIGURE 3:. Microtubule-associated Protein 4 (MAP4) is an Interacting Partner of PI3Kα.
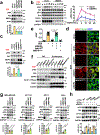
a, Schematic diagram of MAP4 protein showing N-terminal projection domain and C-terminal part that contains proline-rich (PR) region, MTBD and C-tail. b, in vitro binding between MAP4 and PI3Kα. The in vitro binding assay by incubating purified GST-fusion protein of MAP4 with purified PI3Kα protein. PI3Kα protein associated with GST-fusion protein was detected by immunoblotting. The immunoblot shown is from representative experiments. c, MTBD of MAP4 binds with PI3Kα. The in vitro binding of purified PI3Kα protein with GST-fusion protein of either PR, MTBD or C-tail binding was examined by immunoblotting. The immunoblot shown is from representative experiments. d, Individual repeats of the MTBD of MAP4 participate in PI3Kα binding. The in vitro of purified PI3Kα protein with individual MTBD repeats was examined by immunoblotting. The immunoblot shown is the representative of multiple experiments. e, GFP-tagged MTBD of MAP4 is co-immunoprecipitated with p110α. HEK293 cells were co-transfected with HA-tagged p110α and GFP-tagged PR or MTBD or C-tail of MAP4 and co-immunoprecipitated GFP-MTBD with immunoprecipitated p110α was examined by immunoblotting. The immunoblot shown is the representative of multiple experiments. f, Loss of MTBD impairs MAP4 association with PI3Kα. HEK293 cells were co-transfected with Flag-tagged WT MAP4 or MTBD deletion mutant MAP4 along with HA-tagged p110α and co-immunoprecipitated HA-p110α with immunoprecipitated WT MAP4 or MTBD deletion mutant of MAP4 was examined by immunoblotting. The immunoblot shown is the representative of multiple experiments. g, GST-pulldown assay demonstrates pulldown of p110α catalytic subunit by MTBD of MAP4. The GST or GST-fusion protein of MTBD of MAP4 was incubated with cell lysates prepared from HEK293 cells transfected with either Flag-tagged p85α or p110α and their pulldown by GST MTBD protein examined by immunoblotting. The immunoblot shown is the representative of multiple experiments. h, C2 domain of p110α interacts with MTBD of MAP4 in vitro. The in vitro binding of different domains of p110α (p85BD, RBD, C2, helical, and catalytic) with GST MTBD was examined by immunoblotting. The immunoblot shown is the representative of reproducible experiments. i, C2 domain and MTBD show saturation of binding. GST MTBD protein incubated with increasing concentration of His-tagged C2 domain with MTBD was examined by immunoblotting. Error bars denote mean±SD; n=3 independent experiments j, Loss of C2 domain impairs p110α association with MAP4. HEK293 cells were co-transfected with HA-tagged WT p110α or C2 deletion mutant along with Flag-tagged MAP4 and co-immunoprecipitated MAP4 with immunoprecipitated p110α was examined by immunoblotting. The immunoblot shown is the representative of multiple experiments. k, Schematic diagram demonstrating MTBD and C2 domain as interaction sites between MAP4 and PI3Kα. Unprocessed_Western_Blots_Gel_Images_Fig3; Statistical_Source_Data_Fig3
FIGURE 4:
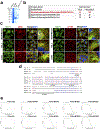
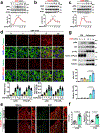
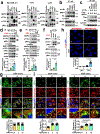
FIGURE 4:. Agonists Stimulated in vivo Association of MAP4 and PI3Kα
a, in vivo association of PI3Kα with MAP4. Antibodies specific to p110α or p110β or p85α were used to immunoprecipitate wild type (MDA-MB-231) or mutant forms of PI3Kα (T47D and Cal51) and co-immunoprecipitated MAP4 examined by immunoblotting. The immunoblot shown is the representative of multiple experiments. b, Wild type or mutant forms of p110α equally co-immunoprecipitate MAP4. Stably expressed HA-p110α was immunoprecipitated using an anti-HA antibody followed by the examination of co-immunoprecipitated endogenous MAP4 by immunoblotting. The immunoblot shown is the representative of reproducible experiments. c, Association between the ectopically expressed p110α and MAP4. HA-tagged p110α and Flag-tagged MAP4 were transiently co-expressed into HEK293 cells. Co-immunoprecipitated Flag-tagged MAP4 was examined by immunoblotting. The immunoblot shown is the representative of reproducible experiments. d, e, Association between PI3Kα and MAP4 upon FBS or EGF stimulation. PI3Kα were immunoprecipitated using a p110α specific antibody and co-immunoprecipitated MAP4 examined by immunoblotting. Error bars denote mean±SD; n=3 (d), n=4 (e) independent experiments f, Association between PI3Kα and MAP4 upon adhesion to Col.I. MDA-MB-231 cells suspended in serum-free medium were seeded into culture plates coated with type I collagen (Col.I). After harvesting the cells, PI3Kα were immunoprecipitated followed by examination of co-immunoprecipitated MAP4 by immunoblotting. Error bars denote mean±SD; n=4 independent experiments g, PI3Kα distribution and co-localization with MAP4 upon EGF stimulation. MDA-MB-231 cells stably expressing HA-p110α were either serum-starved or stimulated with EGF before immunostaining with an anti-HA and MAP4 antibodies. The co-localization of MAP4 and HA-p110α were examined and quantified by Pearson’s r. Scale bar, 5 μm; Error bars denote mean±SD; n=30 cells from representative experiments h, PLA demonstrates an increased association between PI3Kα and MAP4 upon EGF stimulation. EGF stimulated MDA-MB-231 cells were co-immunostained with antibodies specific to MAP4 and p85α or p110α and processed for PLA as described in “Methods”. Scale bar, 5 μm; Error bars denote mean±SD; n=30 cells from representative experiments i, EGF stimulation promotes a subtle increase in PI3Kα localization in endosomes. MDA-MB-231 cells stably expressing HA-p110α were stimulated with EGF. Cells were fixed at different time points and immunostained using anti-HA and EEA1 or TFR antibodies. The co-localization of EEA1/TFR and HA-p110α was quantified by Pearson’s r. Scale bar, 5 μm; Error bars denote mean±SD; n=30 cells from representative experiments Unprocessed_Western_Blots_Fig4; Statistical_Source_Data_Fig4
FIGURE 5:
FIGURE 5:. MAP4 is Required for PI3Kα Vesicle Distribution along Microtubules and its Association with Activated Receptors
a, MAP4 loss affects PI3Kα vesicle distribution along microtubules. Three different individual siRNAs were used for MAP4 knockdown in MDA-MB-231 cells followed by immunofluorescence staining. The co-localization of p110α vesicles and tubulin were quantified by Pearson’s r. Scale bar, 5 μm; Error bars denote mean±SD; n=30 cells from representative experiments b, c, MAP4 is required for the endosomal localization of PI3Kα vesicles. The siRNAs targeting the 3’ UTR region of MAP4 (siMAP4#3) were used to knockdown endogenous MAP4 in MDA-MB-231 cells expressing WT or MTBD deletion mutant of MAP4. 48–72 hrs post-transfection, cells were stimulated with EGF and processed for immunofluorescence study using antibodies specific for endogenous p110α and endosomal markers (EEA1). Co-localization with CHC and TFR is shown in Figure S7a-b. The co-localization of p110α and EEA1/CHC/TFR was quantified by Pearson’s r. Scale bar, 5 μm; Error bars denote mean±SD, n=30 cells from representative experiments d, e, f, MAP4 knockdown impairs the association of PI3Kα with activated EGFR. siRNAs targeting the 3’ UTR region of MAP4 were used to knockdown endogenous MAP4 in MDA-MB-231 cells expressing WT or the MTBD deletion mutant of MAP4. 48–72 hrs post-transfection, cells were stimulated with EGF and processed for immunofluorescence study using antibodies specific for endogenous p110α and activated EGFR. The co-localization between p110α and pEGFR was quantified by Pearson’s r. Similarly, the effect of MAP4 knockdown in the association of PI3Kα with EGFR was analyzed by co-immunoprecipitation assay and proximity ligation assay. Scale bar, 5 μm; Error bars denote mean±SD; n=30 cells from representative experiments (d and f), n=4 independent experiments (e) Unprocessed_Western_Blots_Fig5; Statistical_Source_Data_Fig5
Figure 6:
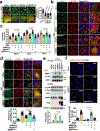
Figure 6:. MAP4 is Required for PI3,4,5P3 Generation
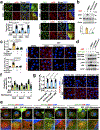
a, b, MAP4 knockdown impairs EGF stimulated PI3,4,5P3 generation. Three different siRNAs were used individually to knockdown MAP4 in MDA-MB-231 cells. EGF induced PI3,4,5P3 was analyzed by immunofluorescence microscopy and MAP4 knockdown by immunoblotting. Scale bar, 5 μm; Error bars denote mean±SD; n=30 cells from representative experiments c, d, Rescue of EGF induced PI3,4,5P3 generation. siMAP4#3 was used to knockdown endogenous MAP4 in MDA-MB-231 cells expressing WT or the MTBD deletion mutant of MAP4. 48–72 hrs post-transfection, cells were stimulated with EGF and induced PI3,4,5P3 was analyzed by immunofluorescence microscopy. The knockdown of endogenous MAP4 and expression of ectopically expressed wild type or mutant form of MAP4 were analyzed by immunoblotting. Scale bar; 5 μm; Error bars denote mean±SD; n=30 cells from representative experiments e, Effect of MAP4 knockdown in PI3Kα mutant expressing cells (Cal51) and EGFR overexpressing cells (A431). siRNA was used to knockdown endogenous MAP4 (siMAP4#1) and the effect on PI3,4,5P3 was analyzed by immunofluorescence microscopy. The knockdown of MAP4 was examined by immunoblotting. Scale bar, 5 μm; Error bars denote mean±SD, n=30 cells from representative experiments f, Effect of MAP4 knockdown in PI3,4,5P3 generation in endosomes. 48–72 hrs post-transfection with siRNA for MAP4 knockdown, cells were lifted and allowed to adhere to coverslips coated with Col.I for 30 minutes. Then, cells were immunostained with antibodies specific for PI3,4,5P3 and endosomal markers (EEA1 and TFR). PI3,4,5P3 co-localized with endosomes were analyzed by immunofluorescence microscopy. Scale bar, 5 μm; Error bars denote mean±SD; n=30 cells from representative experiments g, Analysis of EGF induced PI3,4,5P3 generation in MAP4 knockdown cells by subcellular fractionation. siMAP4#3 was used to knockdown endogenous MAP4 in MDA-MB-231 cells or its transfectants expressing WT or MTBD deletion mutant of MAP4. 48–72 hrs post-transfection, cells were stimulated with EGF for 5 minutes and harvested for subcellular fractionation. The PI3,4,5P3 generated in plasma membrane vs. endosomal fractions were analyzed by an ELISA assay as indicated in “Method”. Error bars denote mean±SD; n=3 independent experiments Unprocessed_Western_Blots_Fig6; Statistical_Source_Data_Fig6
FIGURE 7:
FIGURE 7:. MAP4 is Required for PI3K/Akt Signaling
a, MAP4 loss impairs activation of Akt downstream of EGFR. Three different siRNAs individually used to knockdown MAP4 in MDA-MB-231 cells followed by examination of EGF induced Akt activation by immunoblotting. Error bars denote mean±SD; n=3 independent experiments b, The activation level of Akt in MAP4 knockdown cells at different time points. 48–72 hrs post-siMAP4#1 transfection, the activation level of Akt were examined after EGF stimulation at different time points. Error bars denote mean±SD; n=5 independent experiments c, d, e, Rescue of EGF induced Akt activation in MAP4 knockdown cells. siMAP4#3 was used to knockdown endogenous MAP4 in MDA-MB-231 cells expressing WT or the MTBD deletion mutant of MAP4. 48–72 hrs post-transfection, cells were stimulated with EGF for 5 minutes and activation level of Akt examined by immunoblotting or immunofluorescence microscopy. The image shown is the representative of multiple reproducible experiments. Scale bar, μm; Error bars denote mean±SD; n=4 independent experiments (c), n=30 cells from representative experiments (e) f, Analysis of EGF induced Akt activation in MAP4 knockdown cells by subcellular fractionation. siMAP4#3 was used to knockdown endogenous MAP4 in MDA-MB-231 cells expressing WT or the MTBD deletion mutant of MAP4. 48–72 hrs post-transfection, cells were stimulated with EGF and harvested for subcellular fractions followed by examination of activated Akt in plasma membrane vs. endosomal fractions by immunoblotting. The data shown is the representative of multiple experiments. g, MAP4 knockdown impairs the activation level of Akt in different cell types. MDA-MB-468, HCT116, SCC-1, and HeLa cells were transfected with siMAP4#1 or siMAP4#2. The cells were harvested 72 hrs-post siRNA transfection and activation level of Akt examined by immunoblotting. Error bars denote mean±SD; n=5 independent experiments h, MAP4 knockdown impairs the activation level of Akt in MDA-MB-231 cells ectopically expressing the wild type or mutant form of p110α. The cells were transfected with siMAP4#1 and harvested 72 hrs-post transfection to examine the activation level of Akt by immunoblotting. Error bars denote mean±SD; n=4 independent experiments Unprocessed_Western_Blots_Fig7; Statistical_Source_Data_Fig7
Figure 8:
Figure 8:. Integrity of MAP4 and PI3Kα Interaction Required for PI3K/Akt signaling
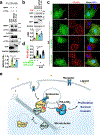
a, Overexpression of MTBD impairs MAP4 association with PI3Kα. MAP4 and HA-tagged p110α were co-transfected along with empty GFP vector or GFP-MTBD or GFP-C-tail into Cos-7 cells. 24–48 hrs post-transfection, p110α were immunoprecipitated and co-immunoprecipitated MAP4 examined by immunoblotting. Error bars denote mean±SD; n=4 independent experiments b, c, d, Overexpression of MTBD impairs EGF stimulated Akt activation and PI3,4,5P3 generation. Cos-7 cells transfected with the empty GFP vector or GFP-MTBD or GFP-C-tail were stimulated with EGF 24–48 hrs post-transfection. Then, the activation level of Akt was examined by immunoblotting. PI3,4,5P3 generated were examined by immunofluorescence staining and PI3,4,5P3 signals were quantified in GFP expressing cells. The image shown is the representative of multiple reproducible experiments. Scale bar, 5 μm; Error bars denote mean±SD; n=4 independent experiments (b), n=30 cells from representative experiments (d) e, Schematic diagram depicting MAP4 regulation of endosomal PI3K/Akt signaling. PI3Kα is distributed in small vesicles along microtubule tracts and a subfraction of PI3K〈 vesicles also remain associated with endosomal vesicles. The direct interaction of PI3Kα with MAP4 facilitates PI3Kα distribution along microtubule tracts to and from the plasma membrane encountering agonist activated receptor tyrosine kinases that are also in route to the endosomal pathways, and this enables PI3Kα activation in endosomal compartments. The loss of MAP4 perturbs PI3Kα recruitment along microtubule tracts and endosomes, and its association with activated receptor complexes, all contributing to impaired PI3Kα activation, PI3,4,5P3 generation and PI3K/Akt signaling predominantly at endosomal compartments. Unprocessed_Western_Blots_Fig8; Statistical_Source_Data_Fig8

Comment in

  • A MAP for PI3K activation on endosomes.
    Batrouni AG, Baskin JM. Batrouni AG, et al. Nat Cell Biol. 2020 Nov;22(11):1292-1294. doi: 10.1038/s41556-020-00597-3. Nat Cell Biol. 2020. PMID: 33139938 No abstract available.

Similar articles

Cited by

References

    1. Zhang Y. et al. A Pan-Cancer Proteogenomic Atlas of PI3K/AKT/mTOR Pathway Alterations. Cancer Cell 31, 820–832 e823 (2017). - PMC - PubMed
    1. Fruman DA et al. The PI3K Pathway in Human Disease. Cell 170, 605–635 (2017). - PMC - PubMed
    1. Fruman DA & Rommel C. PI3K and cancer: lessons, challenges and opportunities. Nat Rev Drug Discov 13, 140–156 (2014). - PMC - PubMed
    1. LoRusso PM Inhibition of the PI3K/AKT/mTOR Pathway in Solid Tumors. J Clin Oncol 34, 3803–3815 - PMC - PubMed
    1. Balla T. Phosphoinositides: tiny lipids with giant impact on cell regulation. Physiol Rev 93, 1019–1137 (2013). - PMC - PubMed

Publication types

MeSH terms