. 2020 Oct 28;6(10):1722-1734.
doi: 10.1021/acscentsci.0c01056. Epub 2020 Sep 23.

Beyond Shielding: The Roles of Glycans in the SARS-CoV-2 Spike Protein

Affiliations

Beyond Shielding: The Roles of Glycans in the SARS-CoV-2 Spike Protein

Lorenzo Casalino et al. ACS Cent Sci. .

Abstract

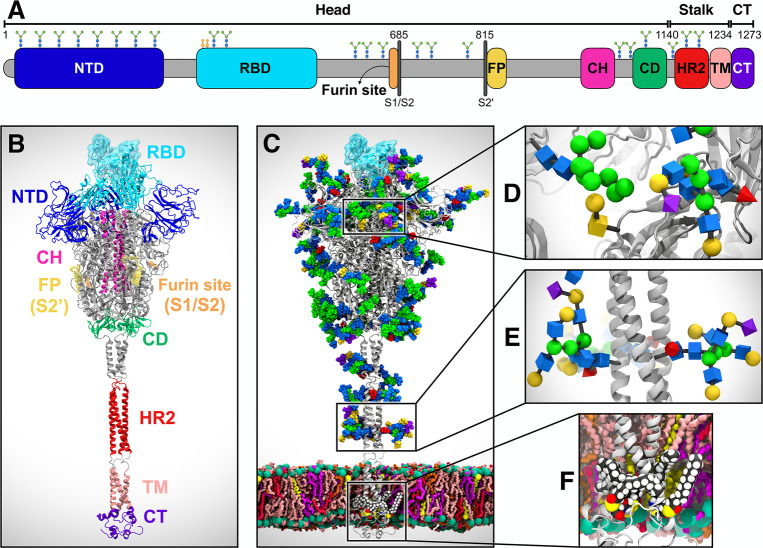
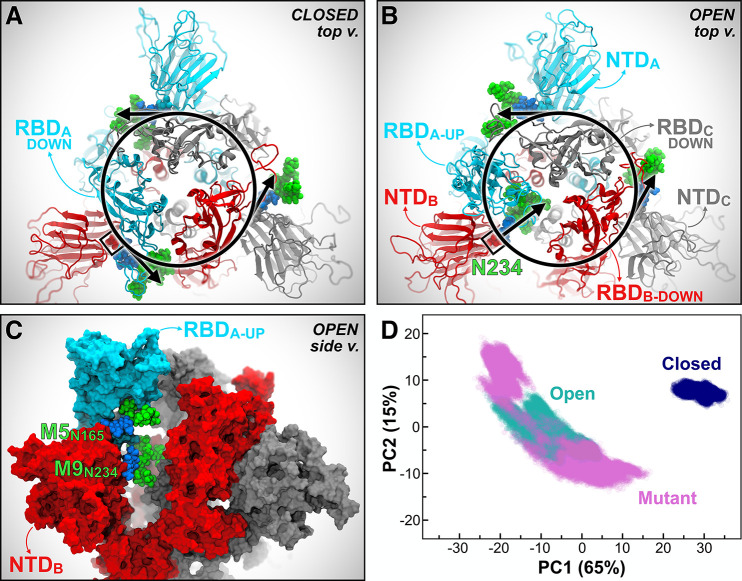
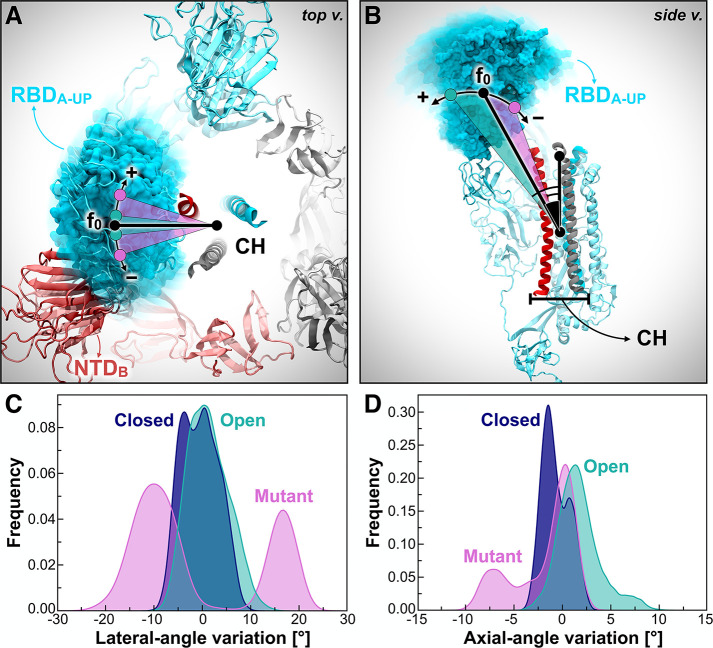
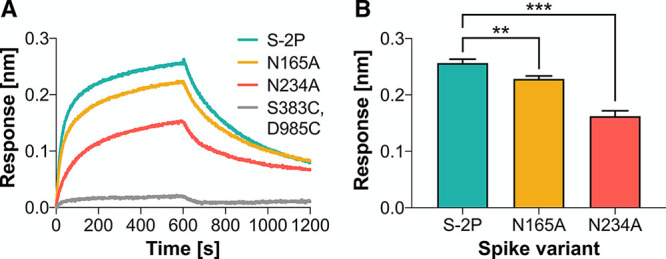
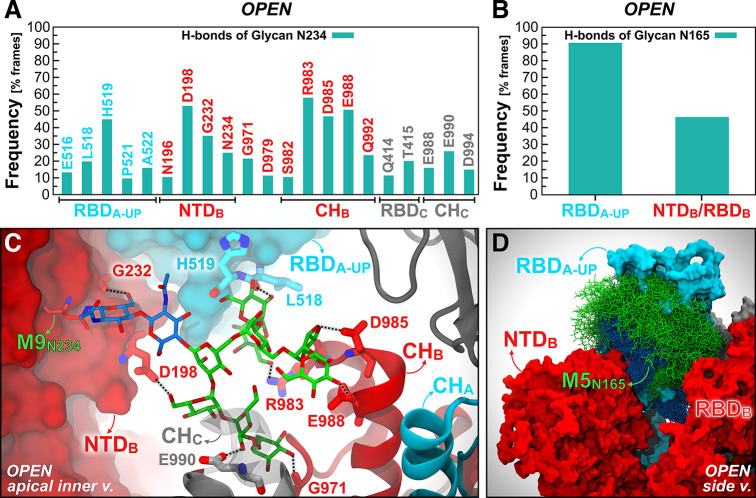
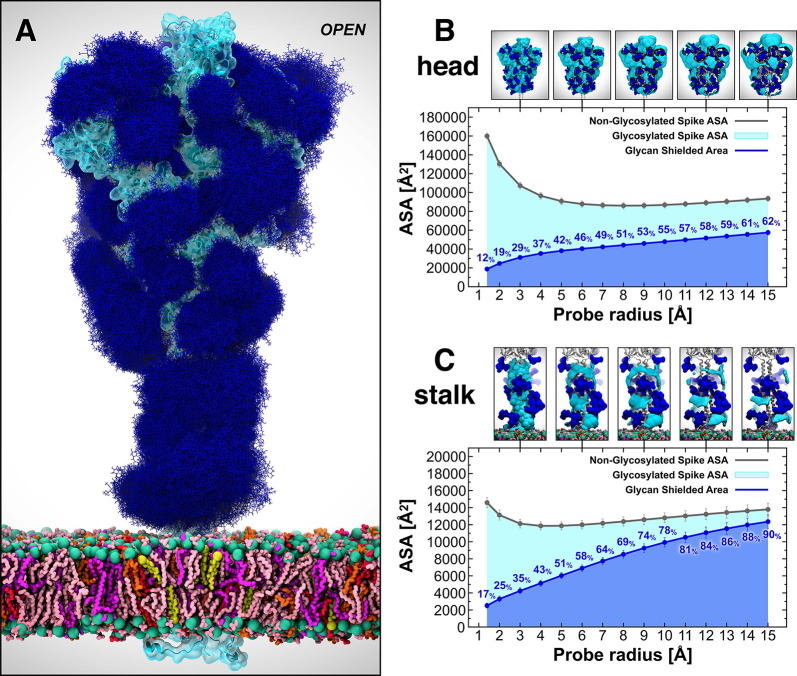
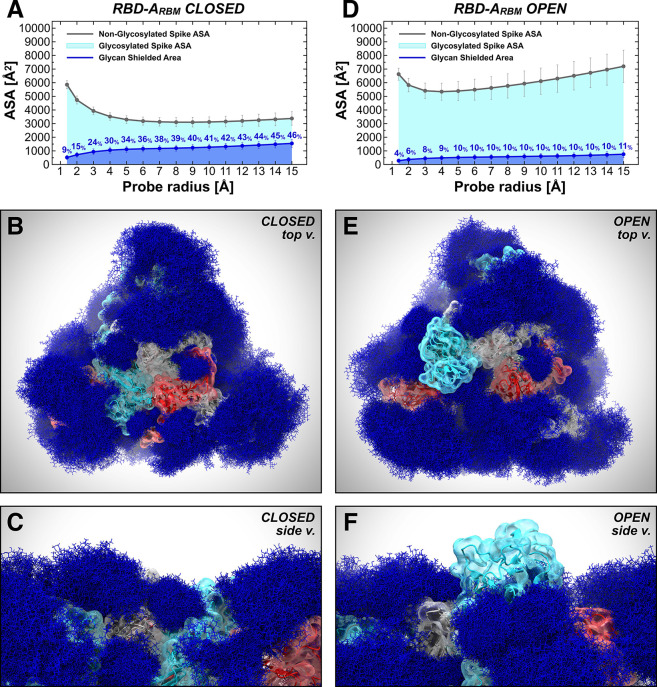
The ongoing COVID-19 pandemic caused by severe acute respiratory syndrome coronavirus 2 (SARS-CoV-2) has resulted in more than 28,000,000 infections and 900,000 deaths worldwide to date. Antibody development efforts mainly revolve around the extensively glycosylated SARS-CoV-2 spike (S) protein, which mediates host cell entry by binding to the angiotensin-converting enzyme 2 (ACE2). Similar to many other viral fusion proteins, the SARS-CoV-2 spike utilizes a glycan shield to thwart the host immune response. Here, we built a full-length model of the glycosylated SARS-CoV-2 S protein, both in the open and closed states, augmenting the available structural and biological data. Multiple microsecond-long, all-atom molecular dynamics simulations were used to provide an atomistic perspective on the roles of glycans and on the protein structure and dynamics. We reveal an essential structural role of N-glycans at sites N165 and N234 in modulating the conformational dynamics of the spike's receptor binding domain (RBD), which is responsible for ACE2 recognition. This finding is corroborated by biolayer interferometry experiments, which show that deletion of these glycans through N165A and N234A mutations significantly reduces binding to ACE2 as a result of the RBD conformational shift toward the "down" state. Additionally, end-to-end accessibility analyses outline a complete overview of the vulnerabilities of the glycan shield of the SARS-CoV-2 S protein, which may be exploited in the therapeutic efforts targeting this molecular machine. Overall, this work presents hitherto unseen functional and structural insights into the SARS-CoV-2 S protein and its glycan coat, providing a strategy to control the conformational plasticity of the RBD that could be harnessed for vaccine development.


Conflict of interest statement

The authors declare no competing financial interest.

Figures

Figure 1
Figure 1
System overview. (A) Schematic of the full-length SARS-CoV-2 S protein primary structure colored by domain: N-terminal domain (NTD, 16–291), receptor binding domain (RBD, 330–530), furin cleavage site (S1/S2), fusion peptide (FP, 817–834), central helix (CH, 987–1034), connecting domain (CD, 1080–1135), heptad repeat 2 (HR2, 1163–1210) domain, transmembrane domain (TM, 1214–1234), and cytoplasmic tail (CT, 1235–1273). Representative icons for N-glycans (blue and green) and O-glycan (yellow) are also depicted according to their position in the sequence. (B) Assembly of the head, stalk, and CT domains into the full-length model of the S protein in the open state. (C) Glycosylated and palmitoylated full-length model of the S protein in the open state embedded in a lipid bilayer mimicking the composition of the endoplasmic reticulum-Golgi intermediate compartment. Protein is depicted with gray cartoons, where the RBD in the “up” state is highlighted with a transparent cyan surface. N-/O-glycans are shown in Van der Waals representation, where GlcNAc is colored in blue, mannose in green, fucose in red, galactose in yellow, and sialic acid in purple. Color code used for lipid tails (licorice presentation): POPC (pink), POPE (purple), POPI (orange), POPS (red), cholesterol (yellow). P atoms of the lipid heads are shown with green spheres. Cholesterol’s O3 atoms are shown with yellow spheres. (D) Magnified view of the S protein head glycosylation, where glycans are depicted using the Symbol Nomenclature for Glycans (SNFG). (E) Magnified view of the S protein stalk glycosylation. (F) Magnified view of the S protein S-palmitoylation within CT.
Figure 2
Figure 2
N234A and N165A mutations show increased instability of RBD-A in the “up” state. (A, B) Top view of the S protein as in the Closed (A) and Open (B) systems. Protein is represented with cartoons, colored in cyan, red, and gray for chains A, B, and C, respectively. Oligomannose N-glycans at position N234 from all chains are shown in Van der Waals representation, where GlcNAc and mannose are colored in blue and green, respectively. In Closed (A), all the N-glycans at N234 are tangential to a hypothetical circle going through N234. In Open (B), the N-glycan at N234 of NTD-B moves inward, filling in the vacancy under RBD-A in the “up” conformation. (C) Side view of the S protein (surface representation) in Open, where the RBD of chain A (RBD-A, cyan) is stabilized by N-glycans at N165 and N234 in the “up” conformation. The same color scheme as panels A and B is applied. (D) PCA plot showing PC1 vs PC2 of RBD-A (residues 330–530) in Closed (blue), Open (teal), and Mutant (magenta). The amount (%) of variance accounted by each PC is shown between parentheses.
Figure 3
Figure 3
RBD-A lateral- and axial-angle fluctuations. (A, B) RBD-A lateral-angle (A) and axial-angle (B), where chains A, B, and C of the spike are represented as cartoons colored in cyan, red, and gray, respectively. Positive and negative variations with respect to the initial frame (0) are indicated with the “+” and “–” symbols, respectively. N-/O-Glycans and some structural domains of the spike are omitted for clarity. (C, D) Distributions of RBD-A lateral-angle (C) and axial-angle (D) fluctuations along the trajectories (across all replicas) in Closed (blue), Open (teal), and Mutant (magenta). Angle variations were calculated with respect to their value at frame 0. Frequencies have been normalized within the respective data sets.
Figure 4
Figure 4
N234A and N165A mutations of the spike reduce binding to ACE2. (A) Representative biolayer interferometry sensorgrams showing binding of ACE2 to spike variants. (B) Binding responses for biolayer interferometry measurements of ACE2 binding to spike variants. Data are shown as mean ± standard deviation from three independent experiments for each variant. Asterisks represent statistical significance (Student’s t test; *0.01 < p < 0.05, **0.001 > p > 0.01, ***0.0001 < p < 0.001).
Figure 5
Figure 5
Hydrogen bond interactions of N-glycans at N234 and N165. The main hydrogen bond interactions of N-glycans at N234 (A) and N165 (B) within the Open system are shown as occupancy across all replicas (% frames). (C) A snapshot capturing Man9 glycan at N234 (licorice representation) within NTD-B establishing multiple hydrogen bonds with S protein residues (thicker licorice representation) belonging to RBD-A (cyan surface), NTD-B (red surface), CH-B (red cartoons), and CH-C (gray cartoons). GlcNAc and mannose carbons are colored in blue and green, respectively. (D) Molecular representation of Man5 glycan at N165 within NTD-B interacting with RBD-A. Multiple (1000) equally interspersed configurations (selected across all replicas) of the glycan at N165 from NTD-B are simultaneously shown. The glycan is represented as colored licorices (GlcNAc in blue, mannose in green), whereas RBD-A and NTD-B are represented as cyan and red surfaces, respectively.
Figure 6
Figure 6
Glycan shield of the SARS-CoV-2 S protein. (A) Molecular representation of the Open system. Glycans at several frames (namely, 300 frames, one every 30 ns from one replica) are represented with blue lines, whereas the protein is shown with cartoons and highlighted with a cyan transparent surface. Color code used for lipid tails (licorice representation): POPC (pink), POPE (purple), POPI (orange), POPS (red), cholesterol (yellow). P atoms of the lipid heads are shown with green spheres. Cholesterol’s O3 atoms are shown with yellow spheres. (B, C) Accessible surface area of the head (B) and stalk (C) and the area shielded by glycans at multiple probe radii from 1.4 (water molecule) to 15 Å (antibody-sized molecule). The values have been calculated and averaged across all replicas of Open and are reported with standard deviation. The area shielded by the glycans is presented in blue (rounded % values are reported), whereas the gray line represents the accessible area of the protein in the absence of glycans. Highlighted in cyan is the area that remains accessible in the presence of glycans, which is also graphically depicted on the structure in the panels located above the plots.
Figure 7
Figure 7
Glycan shield of the RBD ACE2-interacting region. The accessible surface area of the RBM-A and the area shielded by neighboring glycans in the Closed (A) and Open (D) systems are plotted at multiple probe radii from 1.4 (water molecule) to 15 Å (antibody-sized molecule). The values have been averaged across replicas and are reported with standard deviation. In blue is the area of the RBM-A covered by the glycans (rounded % values are reported), whereas the gray line is the accessible area in the absence of glycans. Highlighted in cyan is the RBM-A area that remains accessible in the presence of glycans, which is also graphically depicted on the structure in the panels located below the plots. (BF) Molecular representation of Closed and Open systems from top (B and E, respectively) and side (C and F, respectively) views. Glycans (blue lines) are represented at several frames equally interspersed along the trajectories (300 frames along 0.55 ns for Closed and 1.0 μs for Open), while the protein is shown with colored cartoons and a transparent surface (cyan, red, and gray for chains A, B, and C, respectively). Importantly, in panels E and F, RBD within chain A (cyan) is in the “up” conformation and emerges from the glycan shield.

Update of

References

    1. Chan J. F. W.; Yuan S.; Kok K. H.; To K. K. W.; Chu H.; Yang J.; Xing F.; Liu J.; Yip C. C. Y.; Poon R. W. S.; Tsoi H. W.; Lo S. K. F.; Chan K. H.; Poon V. K. M.; Chan W. M.; Ip J. D.; Cai J. P.; Cheng V. C. C.; Chen H.; Hui C. K. M.; Yuen K. Y. A Familial Cluster of Pneumonia Associated with the 2019 Novel Coronavirus Indicating Person-to-Person Transmission: A Study of a Family Cluster. Lancet 2020, 395 (10223), 514–523. 10.1016/S0140-6736(20)30154-9. - DOI - PMC - PubMed
    1. Chan J. F.-W.; Kok K.-H.; Zhu Z.; Chu H.; To K. K.-W.; Yuan S.; Yuen K.-Y. Genomic Characterization of the 2019 Novel Human-Pathogenic Coronavirus Isolated from a Patient with Atypical Pneumonia after Visiting Wuhan. Emerging Microbes Infect. 2020, 9 (1), 221–236. 10.1080/22221751.2020.1719902. - DOI - PMC - PubMed
    1. Cheng V. C. C.; Lau S. K. P.; Woo P. C. Y.; Yuen K. Y. Severe Acute Respiratory Syndrome Coronavirus as an Agent of Emerging and Reemerging Infection. Clin. Microbiol. Rev. 2007, 20 (4), 660–694. 10.1128/CMR.00023-07. - DOI - PMC - PubMed
    1. Cui J.; Li F.; Shi Z. L. Origin and Evolution of Pathogenic Coronaviruses. Nat. Rev. Microbiol. 2019, 17, 181–192. 10.1038/s41579-018-0118-9. - DOI - PMC - PubMed
    1. Remembering the Nearly 100,000 Lives Lost to Coronavirus in America - The New York Times. https://www.nytimes.com/interactive/2020/05/24/us/us-coronavirus-deaths-... (accessed May 25, 2020).