[Preprint]. 2020 Oct 28:rs.3.rs-97042.
doi: 10.21203/rs.3.rs-97042/v1.

Global Absence and Targeting of Protective Immune States in Severe COVID-19

Affiliations

Global Absence and Targeting of Protective Immune States in Severe COVID-19

Alexis J Combes et al. Res Sq. .

Update in

  • Global absence and targeting of protective immune states in severe COVID-19.
    Combes AJ, Courau T, Kuhn NF, Hu KH, Ray A, Chen WS, Chew NW, Cleary SJ, Kushnoor D, Reeder GC, Shen A, Tsui J, Hiam-Galvez KJ, Muñoz-Sandoval P, Zhu WS, Lee DS, Sun Y, You R, Magnen M, Rodriguez L, Im KW, Serwas NK, Leligdowicz A, Zamecnik CR, Loudermilk RP, Wilson MR, Ye CJ, Fragiadakis GK, Looney MR, Chan V, Ward A, Carrillo S; UCSF COMET Consortium; Matthay M, Erle DJ, Woodruff PG, Langelier C, Kangelaris K, Hendrickson CM, Calfee C, Rao AA, Krummel MF. Combes AJ, et al. Nature. 2021 Mar;591(7848):124-130. doi: 10.1038/s41586-021-03234-7. Epub 2021 Jan 25. Nature. 2021. PMID: 33494096 Free PMC article.

Abstract

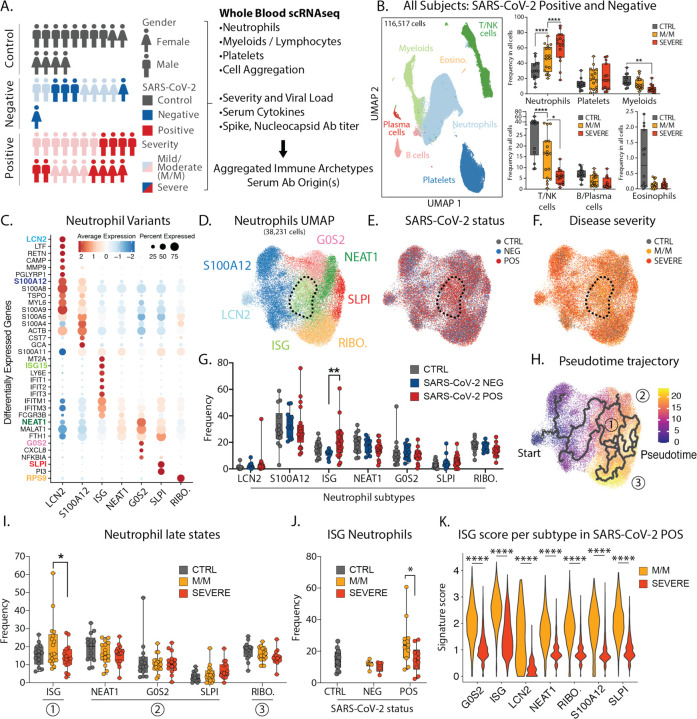
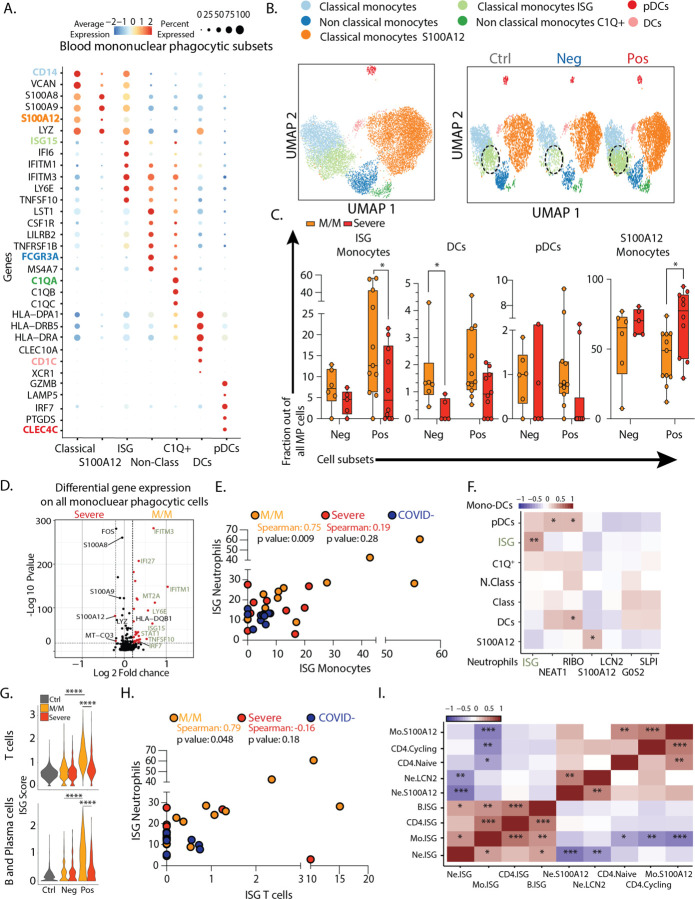
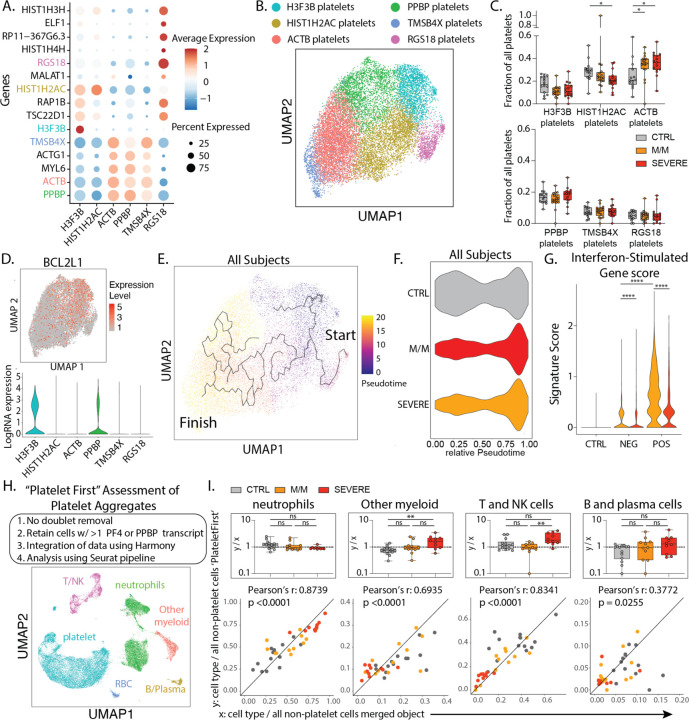
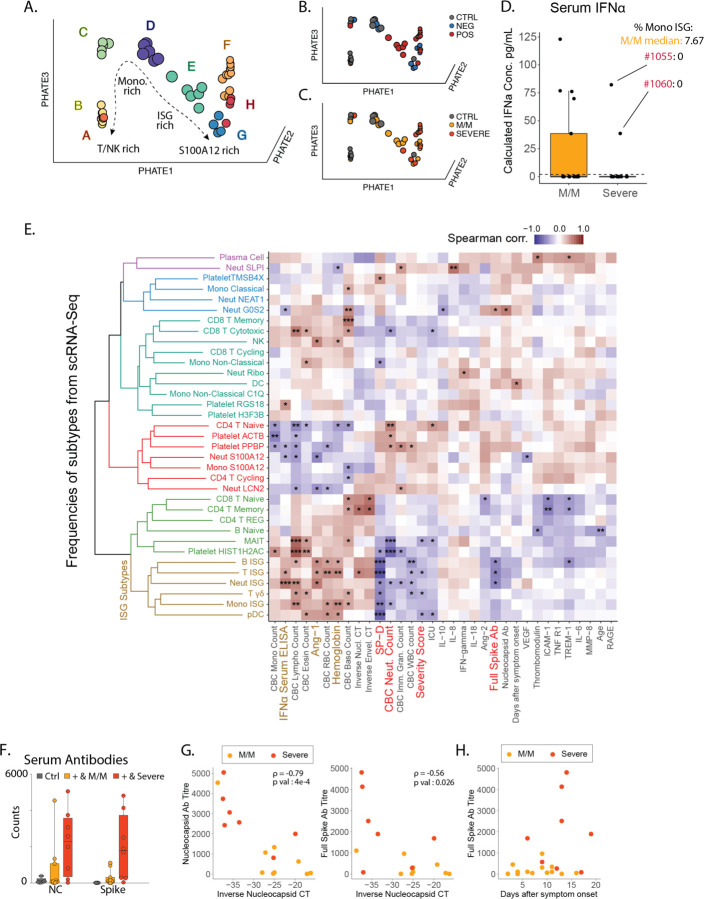
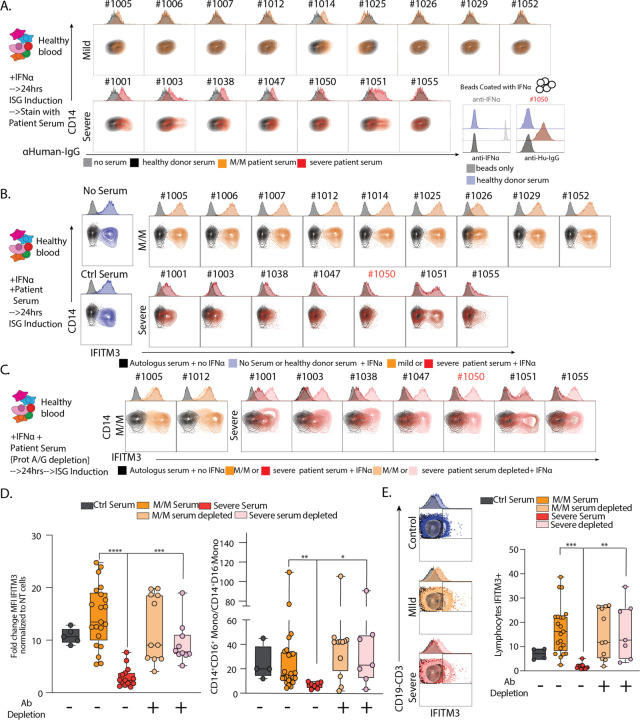
While SARS-CoV-2 infection has pleiotropic and systemic effects in some patients, many others experience milder symptoms. We sought a holistic understanding of the severe/mild distinction in COVID-19 pathology, and its origins. We performed a wholeblood preserving single-cell analysis protocol to integrate contributions from all major cell types including neutrophils, monocytes, platelets, lymphocytes and the contents of serum. Patients with mild COVID-19 disease display a coordinated pattern of interferonstimulated gene (ISG) expression across every cell population and these cells are systemically absent in patients with severe disease. Severe COVID-19 patients also paradoxically produce very high anti-SARS-CoV-2 antibody titers and have lower viral load as compared to mild disease. Examination of the serum from severe patients demonstrates that they uniquely produce antibodies with multiple patterns of specificity against interferon-stimulated cells and that those antibodies functionally block the production of the mild disease-associated ISG-expressing cells. Overzealous and autodirected antibody responses pit the immune system against itself in many COVID-19 patients and this defines targets for immunotherapies to allow immune systems to provide viral defense.


Figures

Figure 1:
Figure 1:. Severe COVID-19 disease is characterized by the lack of IFN-responsive neutrophils.
A. Gender, SARS-CoV-2 status and disease severity in patients and control individuals (left) and description of study design (right). B. UMAP visualization of cells merged from the entire cohort with specific populations overlaid (left), and frequencies of these populations across control, mild/moderate (M/M) and severe individuals (right). C. Dotplot representation of top differentially-expressed-genes (DEG) between neutrophil subsets. D. UMAP visualization of neutrophil subsets. E. and F. Overlay of SARS-CoV-2 status and disease severity, respectively, on the neutrophil UMAP. G. Frequencies of neutrophil subsets among all neutrophils across control, SARS-CoV-2 negative and SARS-CoV-2 positive individuals. H. Pseudotime trajectory of neutrophil subsets. I. Frequencies of the neutrophil subsets among all neutrophils at later stages of pseudotime trajectories across control, mild/moderate and severe individuals. J. Frequency of ISG neutrophils among all neutrophils across SARS-CoV-2 status and disease severity. K. Score of ISG signature across neutrophil subtypes and disease severity in SARS-CoV-2 positive patients. Statistical significance was assessed using a two-way ANOVA test with multiple comparisons for panels B, G, I and J, and using a Wilcoxon test for panel K. * p-value < 0.05; ** p-value < 0.01; *** p-value < 0.001; **** p-value < 0.0001.
Figure 2:
Figure 2:. Severe COVID-19 disease is defined by the lack of a concerted IFN-response across peripheral blood immune cells.
A. Dotplot representation of the top differentially-expressed-genes (DEG) between clusters identified in blood mononuclear phagocytic cell (MPC) subsets. B. UMAP visualization of the 19,289 MPC isolated from the entire dataset (left) and splitted by SARS-CoV-2 status (right). C. Frequencies of MPC subsets among all MPC across control, mild/moderate (M/M) and severe individuals D. Volcano plot showing results of differential gene expression (DGE) analysis performed on all MPC between mild/moderate (right) and severe (left) patients. E. Scatter plot between neutrophil and monocyte ISG positive subsets patient by patient. F. Correlation matrix using Spearman Rank Correlation between the frequency of all neutrophils and monocytes subtypes in all SARS-CoV-2 negative and SARS-CoV-2 positive patients. (n=32) G. Violin plot of ISG signature on all T cells (top) and all B/Plasma cells (bottom) across SARS-CoV-2 status and disease severity. H. Scatter plot between neutrophil and CD4 T cell ISG positive subsets patient by patient. I. Correlation matrix using Spearman Rank Correlation between the most and the least correlated cell subsets to the Neutrophils ISG positive cells (data include all SARS-CoV-2 negative and positive patients). Statistical significance was assessed using Spearman method (n=32) (G.) Kruskal Wallis test with multiple comparisons (C.). * p-value < 0.05; ** p-value < 0.01; *** p-value < 0.001; **** p-value < 0.0001.
Figure 3:
Figure 3:. Platelet subtypes and putative platelet aggregates in COVID-19 disease.
A. Dotplot representation of the top DEG between clusters identified in the platelet subset. B. UMAP visualization of 16,903 platelets isolated from the entire dataset showing various subsets, colored distinctly by their identity. C. Frequencies of the identified clusters among all platelets in healthy donors and all patients with mild/moderate (M/M) and severe disease. D. UMAP visualization of all platelets colored by BCL2L1 (top) and violin plot of BCL2L1 expression level across all identified platelet subsets. E. UMAP visualization of all platelets with overlay of Pseudotime trajectory. F. Violin plot of the relative Pseudotime of all platelets split by healthy donors, mild/moderate and severe patients. G. ISG signature score in all platelets across SARS-CoV-2 status and disease severity. H. Outline of ‘Platelet First’ assessment to identify platelet aggregates in entire whole blood scRNA-seq data set. UMAP visualization of the 52,757 putative platelet aggregates with specific populations overlaid. I. Bottom: Scatter plot of cell type frequency within merged object of entire cohort shown in Figure 1B (x-axis) versus same cell type frequency within ‘Platelet First’ object (y-axis). The identity line x=y is drawn as a reference. Each dot represents a healthy control or SARS-CoV-2 positive patient sample and are color-coded by disease severity. Pearson r correlation coefficient and two-tailed p value are shown for each cell type. Top: Box plots of y/x-ratio for each healthy control or patient sample, separated by disease severity. Differences in C. and I. were calculated using a two-way ANOVA test with multiple comparisons. * p.value < 0.05; ** p.value < 0.01; *** p.value <0.001; **** p.value < 0.0001; ns: non-significant.
Figure 4:
Figure 4:. Integrated view of Blood Composition in COVID-19 Patients.
A-B. 3D PhEMD embedding of all patients, colored by A. de novo patient clusters A-H, B. SARS-CoV-2 status, and C. disease severity. D. Measurement of serum IFNα concentration from SARS-CoV-2 positive and negative patients by ELISA. Patients 1055 and 1060 are highlighted in red and their Monocytes ISG frequency from Fig 2C is noted as well as the median for mild COVID-19 mild/moderate patients. E. Matrix of Spearman correlation coefficients between all subtype frequencies (out of major cell types, e.g. Neut ISG out of all Neutrophils) obtained from scRNA-Seq versus patient metadata, viral load, Ab titers, and serum analyte levels on a patient-by-patient basis excluding healthy controls. Patients for which data were unavailable were excluded from correlation analysis for each comparison. Variables on both axes were ordered via hierarchical clustering with the computed dendrogram displayed for subtype frequencies. This dendrogram was divided into 6 groupings with the one containing ISG+ subtypes highlighted in brown. Clinical variables generally correlated with severity highlighted in red and anti-correlated in brown. (n for correlation comparisons ranged from n=14 to 32) * p<0.05, ** p<0.005, *** p<0.0005. F. Measurement of anti-SARS-CoV-2 antibody levels in serum from patients by Luminex assay (M/M: Mild/Moderate). G. Scatter plots showing viral load versus levels of antibody binding SARS-CoV-2 Nucleocapsid and Full Spike protein for patients in the cohort with severity overlaid. Antibody levels are shown as arbitrary units of MFI from Luminex assay while viral load is represented by an inverse CT number from QRT-PCR with target amplification of the SARS-CoV2 Nucleocapsid sequence. Correlation coefficient and significance calculated using Spearman’s method. Patients for which data was unavailable were excluded. (n=16) H. Scatterplot for SARS-CoV2 Full Spike protein antibody titers relative to days post symptom onset. Patients for which data was unavailable were excluded. (n=22)
Figure 5:
Figure 5:. Neutralization of ISG induction by Antibodies from Severe COVID-19 Patients.
A. Contour plots and histograms of CD14 Monocytes from healthy blood cultured with IFNα to induce expression of ISGs and stained with serum from heathy donor, mild/moderate (M/M) or severe SARS-CoV-2 positive patients with secondary staining with α-human IgG. Bottom right: histogram of beads coated with IFNα and stained with an antibody raised against IFNα or serum from severe SARS-CoV-2 positive patient #1050 or healthy donor. Black histograms represent non coated beads. B-C. Contour plots and histograms of CD14 Monocytes from healthy blood cultured with IFNα and serum from heathy donor, mild/moderate or severe SARS-CoV-2 positive patient quantifying levels of intracellular IFITM3 staining. C. Mild/Moderate (light yellow) or Severe (pink) sera were pre-treated with protein G/A before incubation with PBMC. D. Box plot of IFITM3 induction in CD14 monocytes (left) and intermediate to classical monocytes ratio (right) from 2 different experiment and 2 different healthy donors. E. Left: Contour plots and histograms of pooled CD3+/CD19+ lymphocytes from healthy blood cultured with IFNα and serum from heathy donor, mild/moderate or severe SARS-CoV-2 positive patients. Mild/moderate (light yellow) or Severe (pink) sera were pre-treated with protein G/A before incubation with PBMC to deplete antibodies. Right: Box plot of IFITM3 induction in lymphocytes. Differences in D. and E. were calculated using a two-way ANOVA test with multiple comparisons. * p.value < 0.05; ** p.value < 0.01; *** p.value <0.001; **** p.value < 0.0001; ns: non-significant.

References

    1. Mathew D. et al., Deep immune profiling of COVID-19 patients reveals distinct immunotypes with therapeutic implications. Science 369, (2020). - PMC - PubMed
    1. Schulte-Schrepping J. et al., Severe COVID-19 Is Marked by a Dysregulated Myeloid Cell Compartment. Cell 182, 1419–1440 e1423 (2020). - PMC - PubMed
    1. Hadjadj J. et al., Impaired type I interferon activity and inflammatory responses in severe COVID-19 patients. Science 369, 718–724 (2020). - PMC - PubMed
    1. Zilionis R. et al., Single-Cell Transcriptomics of Human and Mouse Lung Cancers Reveals Conserved Myeloid Populations across Individuals and Species. Immunity 50, 1317–1334 e1310 (2019). - PMC - PubMed
    1. Trapnell C. et al., The dynamics and regulators of cell fate decisions are revealed by pseudotemporal ordering of single cells. Nat Biotechnol 32, 381–386 (2014). - PMC - PubMed

Publication types

LinkOut - more resources