[Preprint]. 2020 Oct 27:2020.10.27.357558.
doi: 10.1101/2020.10.27.357558.

SARS-CoV-2 spike D614G variant confers enhanced replication and transmissibility

Affiliations

SARS-CoV-2 spike D614G variant confers enhanced replication and transmissibility

Bin Zhou et al. bioRxiv. .

Update in

  • SARS-CoV-2 spike D614G change enhances replication and transmission.
    Zhou B, Thao TTN, Hoffmann D, Taddeo A, Ebert N, Labroussaa F, Pohlmann A, King J, Steiner S, Kelly JN, Portmann J, Halwe NJ, Ulrich L, Trüeb BS, Fan X, Hoffmann B, Wang L, Thomann L, Lin X, Stalder H, Pozzi B, de Brot S, Jiang N, Cui D, Hossain J, Wilson MM, Keller MW, Stark TJ, Barnes JR, Dijkman R, Jores J, Benarafa C, Wentworth DE, Thiel V, Beer M. Zhou B, et al. Nature. 2021 Apr;592(7852):122-127. doi: 10.1038/s41586-021-03361-1. Epub 2021 Feb 26. Nature. 2021. PMID: 33636719

Abstract

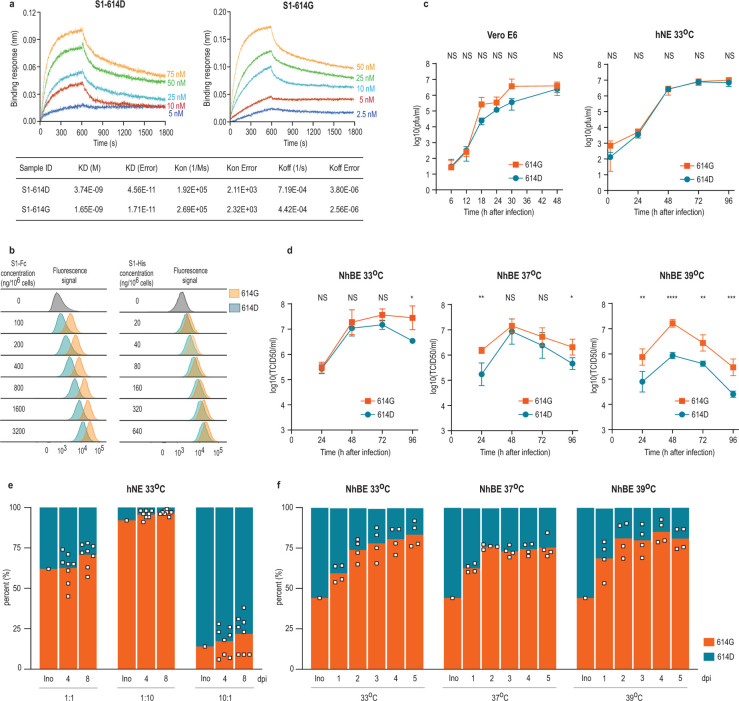
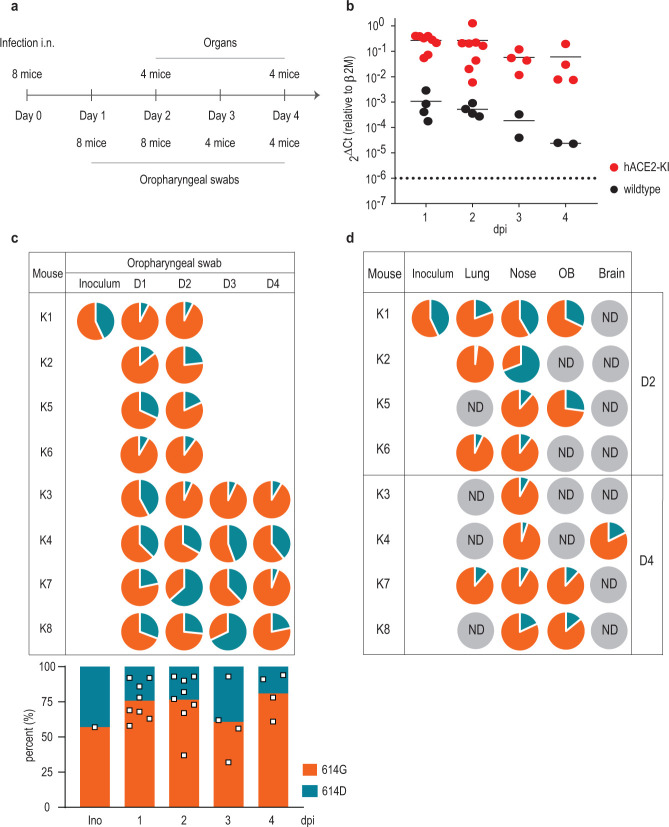
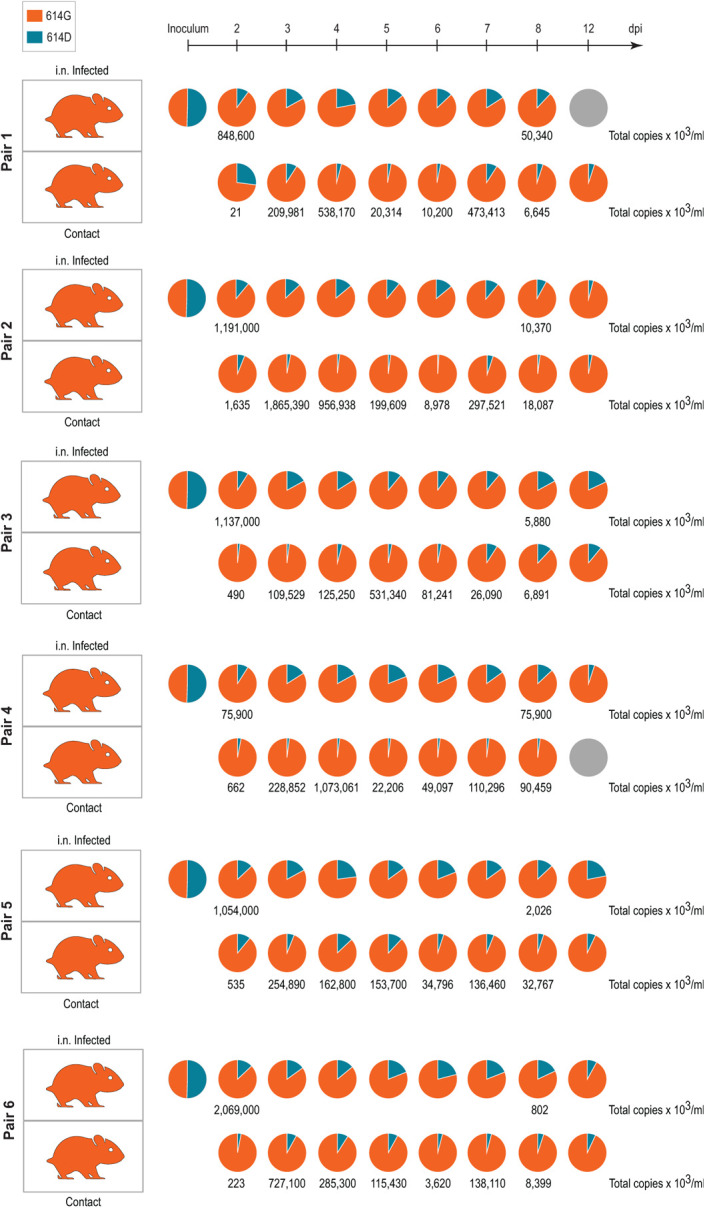
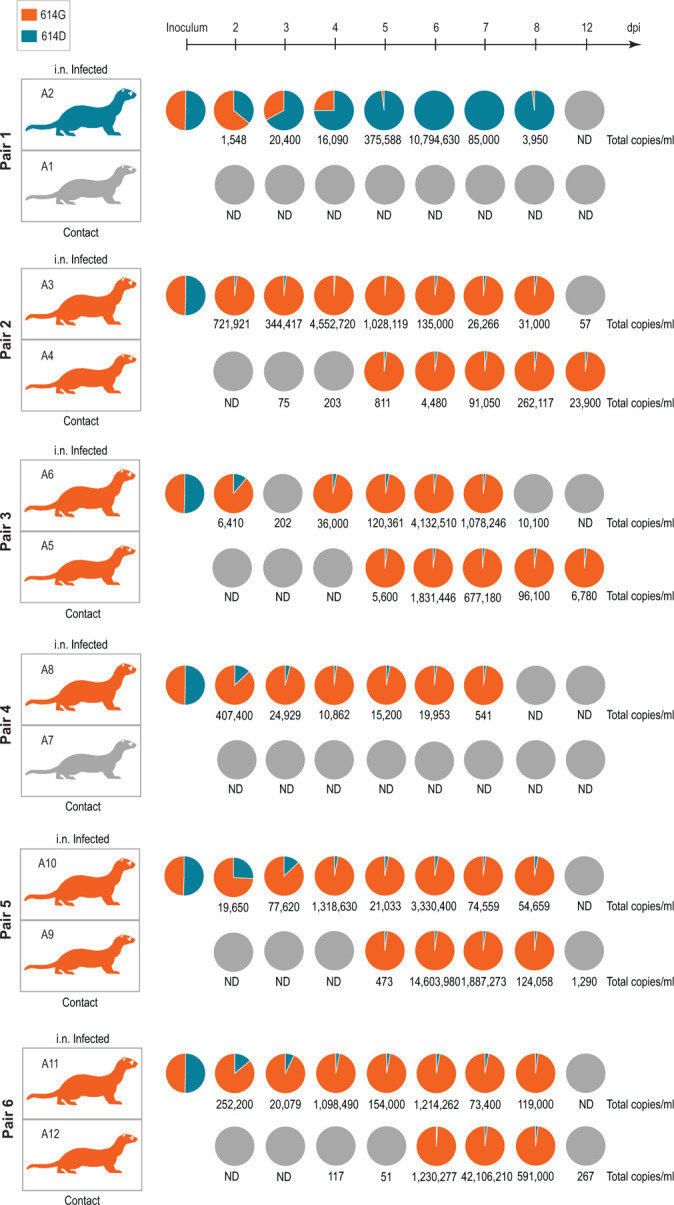
During the evolution of SARS-CoV-2 in humans a D614G substitution in the spike (S) protein emerged and became the predominant circulating variant (S-614G) of the COVID-19 pandemic 1 . However, whether the increasing prevalence of the S-614G variant represents a fitness advantage that improves replication and/or transmission in humans or is merely due to founder effects remains elusive. Here, we generated isogenic SARS-CoV-2 variants and demonstrate that the S-614G variant has (i) enhanced binding to human ACE2, (ii) increased replication in primary human bronchial and nasal airway epithelial cultures as well as in a novel human ACE2 knock-in mouse model, and (iii) markedly increased replication and transmissibility in hamster and ferret models of SARS-CoV-2 infection. Collectively, our data show that while the S-614G substitution results in subtle increases in binding and replication in vitro , it provides a real competitive advantage in vivo , particularly during the transmission bottle neck, providing an explanation for the global predominance of S-614G variant among the SARS-CoV-2 viruses currently circulating.


Conflict of interest statement

Competing interests

The authors declare no competing interests.

Figures

Figure 1.
Figure 1.. In vitro characterization of S1 proteins and recombinant SARS-CoV-2S−614D and SARS-CoV-2S−614G viruses.
(a) Affinity between S1 and hACE2 determined by Bio-layer interferometry. Biotinylated S1 protein (S1–614D or S1–614G) was loaded onto surface of streptavidin biosensors. Association was conducted using hACE2 protein followed by dissociation. (b) Binding of Fc-tagged or polyhistidine-tagged S1 to BHK-hACE2 cells is shown as peaks of fluorescence detected by flow cytometry. (c) Replication kinetics of recombinant viruses in (left) Vero E6 at 37°C and (right) hNE at 33°C. Supernatant was collected at indicated time points and titrated by plaque assay. Data represent the mean ± s.d. of three replicates (Vero E6) and four replicates (hNE). (d) Replication kinetics of recombinant viruses in NhBE at 33°C (left), 37°C (middle) and 39°C (right). NhBE were infected with 100,000 PFU of each virus. Supernatants were collected daily and titrated by TCID50 assay. Data represent the mean ± s.d. of four replicates. (c-d) Statistical significance was determined by two-sided unpaired Student’s t-test without adjustments for multiple comparisons. (c) P values (left to right): left, NS, P=0.9132; NS P=0.0604; NS P=0.2394; NS P=0.2389; NS P=0.2778; NS P=0.2781; right, NS P=0.1520; NS P=0.3891; NS P=0.9110; NS P=0.8985; NS P=0.1464. (d) P values (left to right): left, NS P=0.7943; NS P=0.5025; NS P=0.6683; NS P=0.8985; *P=0.0220; middle, **P=0.0065; NS P=0.4660; NS P=0.3134; *P=0.0159; right, **P=0.0094; ****P<10−4; **P=0.0028; ***P=0.0009. (e-f) Competition assay of recombinant viruses in hNE at 33°C and NhBE at 33°C, 37°C and 39°C. The inoculum was prepared by mixing two viruses at 1:1 ratio based on PFU ml−1 and used for infection of hNE and NhBE. Apical wash and supernatant were collected daily, and extracted RNA was used for sequencing. (e-f) Bar graph shows proportion of sequencing reads encoding either S-614D or S-614G, and square dots represent individual data points.
Figure 2.
Figure 2.. Replication of SARS-CoV-2S−614D and SARS-CoV-2S−614G viruses in hACE2 knock-in mice.
(a) Experimental scheme for infection of hACE2-KI mice intranasally infected recombinant SARS-CoV-2S−614D and SARS-CoV-2S−614G viruses. Oropharyngeal swabs were sampled daily and tissue samples were analyzed in sub-groups of 4 mice at 2 and 4 days post infection (dpi) in two independent experiments. (b) Quantitative RT-PCR analysis of oropharyngeal swabs of inoculated hACE2-KI and wild-type mice. (c,d) Pie chart representation of mean frequencies of A or G nucleotide at position 23,403 corresponding to SARS-CoV-2S−614D and SARS-CoV-2S−614G, respectively. Each pie chart illustrates the ratio of A/G detected from individual oropharyngeal swab samples (c) and tissues (d) at indicated time post infection. OB, olfactory bulb; ND, not detected.
Figure 3.
Figure 3.. Replication and transmission of SARS-CoV-2S−614D and SARS-CoV-2S−614G viruses in Syrian hamsters.
Transmission of SARS-CoV-2S−614D and S−614G variant by hamsters in a pairwise one-by-one setup with direct contact of donor and cohoused contact hamsters is illustrated. Samples of nasal washings were taken daily between days 2 to 8 post infection (dpi) and finally at 12 dpi and were analyzed. Pie chart representation of fraction of A or G nucleotide at position 23,403 corresponding to SARS-CoV-2S−614D and SARS-CoV-2S−614G, respectively, measured by amplicon sequencing. Genome copies were calculated from RT-qPCR using a standard RNA. Orange coloring of the hamster silhouette refer to detection of G (SARS-CoV-2S−614G), while blue coloring indicates detection of A (SARS-CoV-2S−614D) on most time points. Grey coloring signals no infection detected
Figure 4.
Figure 4.. Replication and transmission of SARS-CoV-2S−614D and SARS-CoV-2S−614G viruses in ferrets.
Schematic illustration of the experimental setup with six pairs of donor ferrets cohoused with naïve contact ferrets. Samples of nasal washings were taken daily between days 2 to 8 post infection (dpi) and finally at 12 dpi and were analyzed. Pie chart representation of fraction of A or G nucleotide at position 23,403 corresponding to SARS-CoV-2S−614D and SARS-CoV-2S−614G, respectively. Each pie chart illustrates the ratio of A/G detected from individual nasal washing samples over time. Orange coloring of the ferret silhouette refer to detection of G (SARS-CoV-2S−614G) on most time points, while blue coloring indicates detection of A (SARS-CoV-2S−614D). Numbers represent total genome copies ml−1 and grey coloring signals no infection or viral genome number too low for A/G ratio determination in sequencing. ND, not detected.

References

    1. Korber B. et al. Tracking Changes in SARS-CoV-2 Spike: Evidence that D614G Increases Infectivity of the COVID-19 Virus. Cell 182, 812–827.e819, doi:10.1016/j.Cell.2020.06.043 (2020). - DOI - PMC - PubMed
    1. Zhu N. et al. A Novel Coronavirus from Patients with Pneumonia in China, 2019. N Engl J Med 382, 727–733, doi:10.1056/NEJMoa2001017 (2020). - DOI - PMC - PubMed
    1. Zhou P. et al. A pneumonia outbreak associated with a new coronavirus of probable bat origin. Nature 579, 270–273, doi:10.1038/s41586-020-2012-7 (2020). - DOI - PMC - PubMed
    1. ECDC. COVID-19 pandemic, <https://www.ecdc.europa.eu/en/covid-19-pandemic> (2020).
    1. Huang C. et al. Clinical features of patients infected with 2019 novel coronavirus in Wuhan, China. Lancet 395, 497–506, doi:10.1016/s0140-6736(20)30183-5 (2020). - DOI - PMC - PubMed

Publication types