[Preprint]. 2021 Jan 19:2020.10.27.20220897.
doi: 10.1101/2020.10.27.20220897.

The effect of eviction moratoria on the transmission of SARS-CoV-2

Affiliations

The effect of eviction moratoria on the transmission of SARS-CoV-2

Anjalika Nande et al. medRxiv. .

Update in

  • The effect of eviction moratoria on the transmission of SARS-CoV-2.
    Nande A, Sheen J, Walters EL, Klein B, Chinazzi M, Gheorghe AH, Adlam B, Shinnick J, Tejeda MF, Scarpino SV, Vespignani A, Greenlee AJ, Schneider D, Levy MZ, Hill AL. Nande A, et al. Nat Commun. 2021 Apr 15;12(1):2274. doi: 10.1038/s41467-021-22521-5. Nat Commun. 2021. PMID: 33859196 Free PMC article.

Abstract

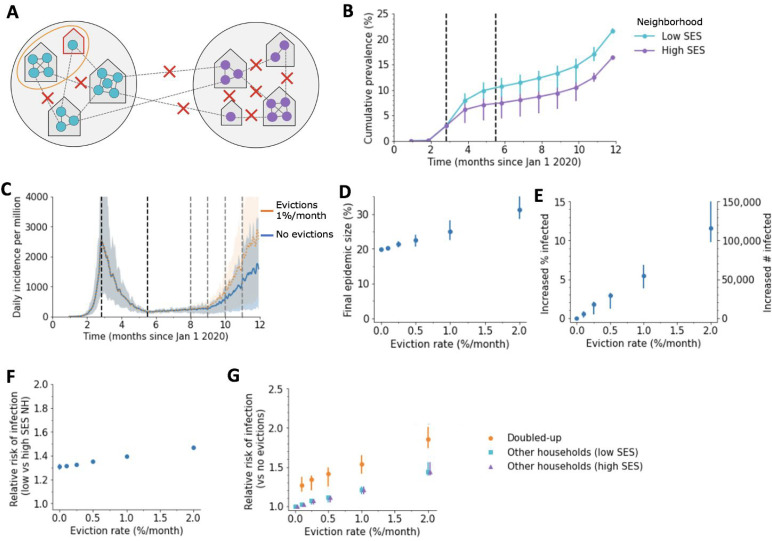
Massive unemployment during the COVID-19 pandemic could result in an eviction crisis in US cities. Here we model the effect of evictions on SARS-CoV-2 epidemics, simulating viral transmission within and among households in a theoretical metropolitan area. We recreate a range of urban epidemic trajectories and project the course of the epidemic under two counterfactual scenarios, one in which a strict moratorium on evictions is in place and enforced, and another in which evictions are allowed to resume at baseline or increased rates. We find, across scenarios, that evictions lead to significant increases in infections. Applying our model to Philadelphia using locally-specific parameters shows that the increase is especially profound in models that consider realistically heterogenous cities in which both evictions and contacts occur more frequently in poorer neighborhoods. Our results provide a basis to assess municipal eviction moratoria and show that policies to stem evictions are a warranted and important component of COVID-19 control.


Figures

Figure 1:
Figure 1:. Modeling the effect of evictions on SARS-CoV-2 transmission.
We model the spread of infection over a transmission network where contacts are divided into those occurring within a household (solid grey lines) versus outside the house (“external contacts”, dotted grey lines). Social distancing interventions (such as venue and school closures, work-from-home policies, mask wearing, lockdowns, etc) are modeled as reductions in external contacts (red x’s), while relaxations of these interventions result in increases in external contacts towards their baseline levels. When a household experiences eviction (red outline), we assume the residents of that house “double-up” by merging with another house (blue circle), thus increasing their household contacts. Evictions can also directly lead to homelessness (orange outline), and residence in shelters or encampments with high numbers of contacts
Figure 2:
Figure 2:. Impact of evictions on a SARS-CoV-2 comeback during Fall 2020.
We model evictions occurring in the context of an epidemic similar to cities following “Trajectory 1”, with a large first wave and strong control in the spring, followed by relaxation to a plateau over the summer and an eventual comeback in the fall. Monthly evictions start Sept 1, with a 4-month backlog processed in the first month. A) The projected daily incidence of new infections (7-day running average) with and without evictions. Shaded regions represent central 90% of all simulations. The first lockdown (dotted vertical line) reduced external contacts by 85%, under relaxation (second dotted line) they were still reduced by 70%, and during the fall comeback they were reduced by 60% (fourth dotted line). B) Final epidemic size by Dec 31 2020, measured as percent of individuals who had ever been in any stage of infection. C) The predicted increase in infections due to evictions through Dec 31 2020, measured as excess percent of population infected (left Y-axis) or number of excess infections (right Y-axis). Error bars show interquartile ranges across simulations. D) Relative risk of infection in the presence versus absence of evictions, for individuals who merged households due to evictions (“Doubled-up”) and for individuals who kept their pre-epidemic household (“Other households”). E)-F) Same as above but assuming a second lockdown is instituted on Dec 1, and maintained through March 2021.
Figure 3:
Figure 3:. Alternate epidemic trajectories of SARS-CoV-2 before and after evictions in a large city.
Each panel shows the projected daily incidence of new infections (7-day running average) with and without evictions at 1%/month with a 4 month backlog, starting on Sept 1 2020. Shaded regions represent central 90% of all simulations. In the left column, spread continues unabated through Dec 31 2020, whereas in the second column a new lockdown is introduced on Dec 1. Each trajectory scenario is created by calibrating the model to a group of US metropolitan statistical areas with similar patterns of spread (see Methods, Figure S5–S8). For all trajectory types, the degree of reduction in external contacts by control measures was modulated on dates March 25, June 15, July 15, and Oct 1, with values reported in Table S1.
Figure 4:
Figure 4:. Impact of evictions on COVID-19 epidemics in heterogeneous cities.
A) Schematic of our model for inequalities within a city. The city is divided into a “high socioeconomic status (SES)” (purple) and a “low SES” (teal) neighborhood. Evictions only occur in the low SES area, and individuals living in this area are assumed to be less able to adopt social distancing measures, and hence have higher contact rates under interventions (90% vs 80% reduction in external contacts during lockdown for 85% overall, 75% vs 65% during relaxation for 70% overall, and 65% vs 55% during fall comeback for 60% overall). Before interventions, residents are equally likely to contact someone outside the household who lives within vs outside their neighborhood. B) Cumulative percent of the population infected over time, by neighborhood, in the absence of evictions. C) The projected daily incidence of new infections (7-day running average) with 1%/month evictions vs no evictions. Shaded regions represent central 90% of all simulations. D) Final epidemic size by Dec 31 2020, measured as percent individuals who had ever been in any stage of infection, for the heterogenous city as compared to a homogenous city with same effective eviction rate and intervention efficacy. E) The predicted increase in infections due to evictions through Dec 31 2020, measured as excess percent of population infected (left Y-axis) or number of excess infections (right Y-axis). Error bars show interquartile ranges across simulations. F) Relative risk of infection by Dec 31 2020 for residents of the poor vs rich neighborhood. G) Relative risk of infection by Dec 31 2020 in the presence vs absence of evictions, for individuals who merged households due to evictions (“Doubled-up”) and for individuals who kept their pre-epidemic household (“Other households”).
Figure 5:
Figure 5:. A detailed example of how evictions might affect SARS-CoV-2 transmission in the city of Philadelphia, Pennsylvania, USA.
A) Map of Philadelphia, with each zip code colored by the cluster it was assigned to. Properties of clusters are Table 2 and Supplemental Tables 1–2 B) Schematic of our model for inequalities within the city. Each cluster is modeled as a group of households, and the eviction rate and ability to adopt social distancing measures vary by cluster. C) Simulated cumulative percent of the population infected over time, by cluster, in the absence of evictions. Data points from seroprevalence studies in Philadelphia or Pennsylvania: x [52], + [36], triangle [53], square [37]. D) The projected daily incidence of new infections (7-day running average) with evictions at 5-fold the 2019 rate vs no evictions. Shaded regions represent central 90% of all simulations. E) Final epidemic size by Dec 31 2020, measured as percent individuals who had ever been in any stage of infection. F) The predicted increase in infections due to evictions through Dec 31 2020, measured as excess percent of population infected (left Y-axis) or number of excess infections (right Y-axis). Error bars show interquartile ranges across simulations. G) Relative risk of infection by Dec 31 2020 for residents compared by neighborhood. H-I) Relative risk of infection by Dec 31 2020 in the presence vs absence of evictions, for individuals who merged households due to evictions (“Doubled-up”, H) and for individuals who kept their pre-epidemic household (“Other households”, I).

References

    1. Appelbaum B. Opinion | The Coming Eviction Crisis: ‘It’s Hard to Pay the Bills on Nothing.’ The New York Times. 9 August 2020. Available: https://www.nytimes.com/2020/08/09/opinion/evictions-foreclosures-covid-... Accessed 25 Oct 2020.
    1. Bauman A, Chakrabarti M. Is An Eviction Crisis On The Horizon? WBUR | On Point. Boston, MA, USA: NPR; 2020. Available: https://www.wbur.org/onpoint/2020/08/17/eviction-crisis-looming
    1. Benson D. Housing Advocates Say Eviction Waves Will Spread COVID-19 WFYI Public Media. Indianapolis, IN, USA: NPR; 2020. Available: https://www.wfyi.org/news/articles/housing-advocates-say-eviction-waves-...
    1. Dalbey B, Patch Staff. 40M Americans Could Lose Homes In Coronavirus Eviction Crisis | Across America, US Patch. Patch.com 28 August 2020. Available: https://patch.com/us/across-america/40m-americans-could-lose-homes-coron... Accessed 25 Oct 2020.
    1. Denham H, Telford T. Debt, eviction and hunger: Millions fall back into crisis as stimulus and safety nets vanish. Washington Post. 23 August 2020. Available: https://www.washingtonpost.com/business/2020/08/23/economy-federal-benef... Accessed 25 Oct 2020.

Publication types