

This is a preprint.
Detecting COVID-19 infection hotspots in England using large-scale self-reported data from a mobile application: a prospective, observational study
- PMID: 33140073
- PMCID: PMC7605586
- DOI: 10.1101/2020.10.26.20219659
Detecting COVID-19 infection hotspots in England using large-scale self-reported data from a mobile application: a prospective, observational study
Update in
-
Detecting COVID-19 infection hotspots in England using large-scale self-reported data from a mobile application: a prospective, observational study.Lancet Public Health. 2021 Jan;6(1):e21-e29. doi: 10.1016/S2468-2667(20)30269-3. Epub 2020 Dec 3. Lancet Public Health. 2021. PMID: 33278917 Free PMC article.
Abstract
Background: As many countries seek to slow the spread of COVID-19 without reimposing national restrictions, it has become important to track the disease at a local level to identify areas in need of targeted intervention.
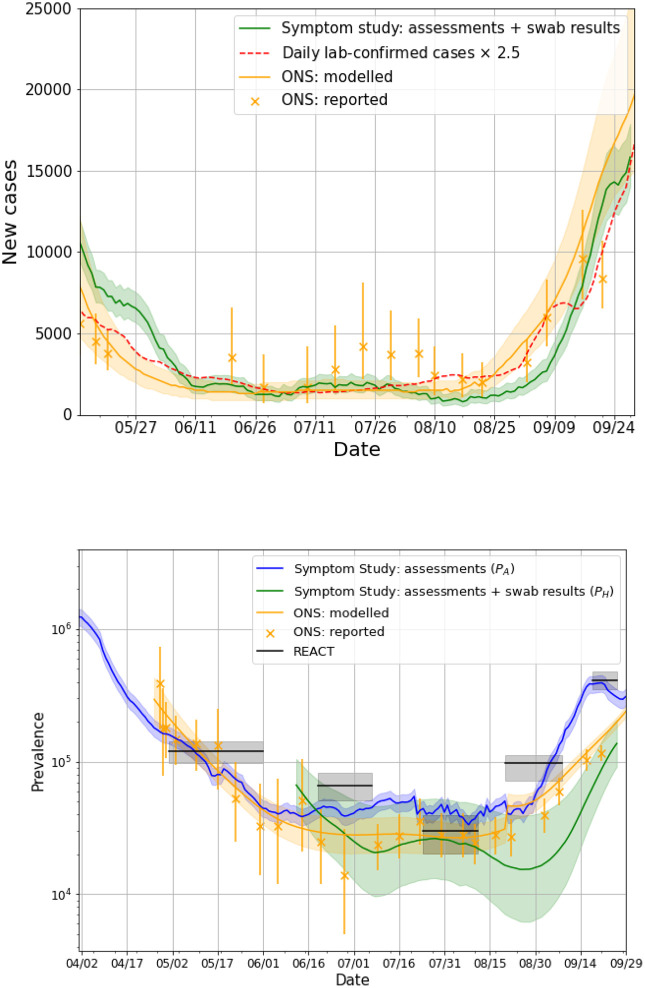
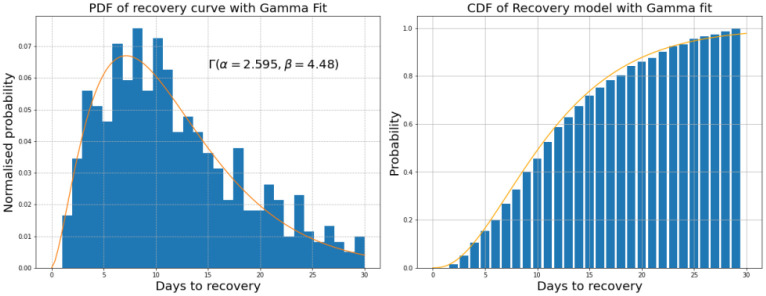
Methods: We performed modelling on longitudinal, self-reported data from users of the COVID Symptom Study app in England between 24 March and 29 September, 2020. Combining a symptom-based predictive model for COVID-19 positivity and RT-PCR tests provided by the Department of Health we were able to estimate disease incidence, prevalence and effective reproduction number. Geographically granular estimates were used to highlight regions with rapidly increasing case numbers, or hotspots.
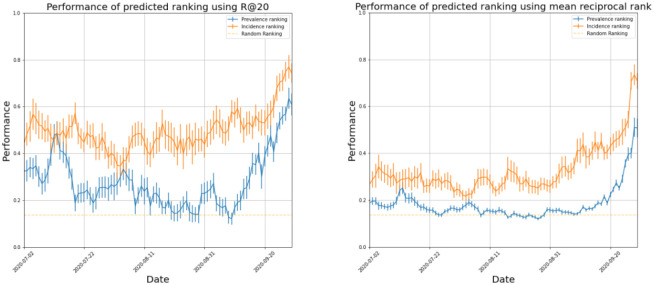
Findings: More than 2.8 million app users in England provided 120 million daily reports of their symptoms, and recorded the results of 170,000 PCR tests. On a national level our estimates of incidence and prevalence showed similar sensitivity to changes as two national community surveys: the ONS and REACT-1 studies. On 28 September 2020 we estimated 15,841 (95% CI 14,023-17,885) daily cases, a prevalence of 0.53% (95% CI 0.45-0.60), and R(t) of 1.17 (95% credible interval 1.15-1.19) in England. On a geographically granular level, on 28 September 2020 we detected 15 of the 20 regions with highest incidence according to Government test data, with indications that our method may be able to detect rapid case increases in regions where Government testing provision is more limited.
Interpretation: Self-reported data from mobile applications can provide an agile resource to inform policymakers during a fast-moving pandemic, serving as an independent and complementary resource to more traditional instruments for disease surveillance.
Funding: Zoe Global Limited, Department of Health, Wellcome Trust, EPSRC, NIHR, MRC, Alzheimer's Society.
Figures
References
-
- Flaxman S, Mishra S, Gandy A, et al. Estimating the effects of non-pharmaceutical interventions on COVID-19 in Europe. Nature 2020; 584: 257–61. - PubMed
-
- Mahase E.. Covid-19: How does local lockdown work, and is it effective? 2020 https://www.bmj.com/content/370/bmj.m2679.abstract. - PubMed
-
- Lavezzo E, Franchin E, Ciavarella C, et al. Suppression of a SARS-CoV-2 outbreak in the Italian municipality of Vo’. Nature 2020; 584: 425–9. - PubMed
Publication types
Grants and funding
LinkOut - more resources
Full Text Sources
Research Materials