. 2021 Mar 25;23(3):387-399.
doi: 10.1093/neuonc/noaa255.

PTRF/cavin-1 remodels phospholipid metabolism to promote tumor proliferation and suppress immune responses in glioblastoma by stabilizing cPLA2

Affiliations

PTRF/cavin-1 remodels phospholipid metabolism to promote tumor proliferation and suppress immune responses in glioblastoma by stabilizing cPLA2

Kaikai Yi et al. Neuro Oncol. .

Abstract

Background: Metabolism remodeling is a hallmark of glioblastoma (GBM) that regulates tumor proliferation and the immune microenvironment. Previous studies have reported that increased polymerase 1 and transcript release factor (PTRF) levels are associated with a worse prognosis in glioma patients. However, the biological role and the molecular mechanism of PTRF in GBM metabolism remain unclear.

Methods: The relationship between PTRF and lipid metabolism in GBM was detected by nontargeted metabolomics profiling and subsequent lipidomics analysis. Western blotting, quantitative real-time PCR, and immunoprecipitation were conducted to explore the molecular mechanism of PTRF in lipid metabolism. A sequence of in vitro and in vivo experiments (both xenograft tumor and intracranial tumor mouse models) were used to detect the tumor-specific impacts of PTRF.

Results: Here, we show that PTRF triggers a cytoplasmic phospholipase A2 (cPLA2)-mediated phospholipid remodeling pathway that promotes GBM tumor proliferation and suppresses tumor immune responses. Research in primary cell lines from GBM patients revealed that cells overexpressing PTRF show increased cPLA2 activity-resulting from increased protein stability-and exhibit remodeled phospholipid composition. Subsequent experiments revealed that PTRF overexpression alters the endocytosis capacity and energy metabolism of GBM cells. Finally, in GBM xenograft and intracranial tumor mouse models, we showed that inhibiting cPLA2 activity blocks tumor proliferation and prevents PTRF-induced reduction in CD8+ tumor-infiltrating lymphocytes.

Conclusions: The PTRF-cPLA2 lipid remodeling pathway promotes tumor proliferation and suppresses immune responses in GBM. In addition, our findings highlight multiple new therapeutic targets for GBM.

Keywords: PTRF; cPLA2; energy metabolism; glioblastoma; phospholipid remodeling.


Figures

Fig. 1
Fig. 1
PTRF increases lysophosphatidylcholine (LPC) levels in GBM. (A) Schematic of LC-MS analysis to study metabolism in primary GBM cells with or without PTRF overexpression. (B) Heatmap of phospholipid changes in N9 and N9 PTRF cells as assessed via nontargeted metabolomics analysis. Control group: n = 6; PTRF overexpression group: n = 5. (C) Nontargeted metabolomics analysis of phospholipids in N9 and N9 PTRF cells. Values are shown as log2 fold change relative to N9 cells. (D) Heatmap of lysophosphatidylcholine changes in N9 and N9 PTRF cells by lipidomics analysis. n = 6 for both groups. (E) Fold changes in the levels of various lysophosphatidylcholines in N9 and N9 PTRF cells. (F) ELISA-based analysis of total LPC levels in GBM cells.
Fig. 2
Fig. 2
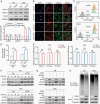
PTRF reprograms phospholipid metabolism by regulating the stability of cPLA2. (A) Western blot analysis of CHPT1, LPCAT1, and cPLA2 expression in primary GBM cells (N9 and N33 cells transduced with vector or PTRF). Quantitation of the Western blot results using ImageJ software. (B) Immunofluorescence of cPLA2 (green), F-actin (red), and nuclei (blue). Scale bar, 20 μm. (C) Flow cytometry analysis of cPLA2 in GBM cells. (D) cPLA2 levels in GBM cells based on a cPLA2 assay kit. (E) Relative mRNA level of cPLA2, as determined by quantitative PCR. (F) Western blot analysis of cPLA2 and PTRF treated with cycloheximide (CHX) at the indicated time points. (G) Western blot analysis of cPLA2 and PTRF after treatment with the proteasome inhibitor MG132 or the lysosome inhibitor chloroquine (CQ). (H) GBM cells with or without PTRF overexpression were lysed and subjected to immunoprecipitation with an antibody against cPLA2 and analyzed by western blotting with an anti-ubiquitin antibody.
Fig. 3
Fig. 3
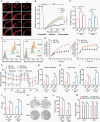
The PTRF-cPLA2 lipid remodeling pathway regulates the endocytosis capacity, mitochondrial respiration, and proliferation of GBM cells. (A) Confocal images from a FRAP assay showing plasma membrane fluidity changes in N9 and N9 PTRF cells, as well as in N9 cells treatment with an exogenous LPC. Scale bar, 10 μm. (B) Plot showing the fluorescence recovery of the cells in (A). (C) Pyrene assay showing the relative membrane fluidity of GBM cells. (D) Flow cytometry analysis of GBM cells after incubation with Cy5-BSA for 4 h. (E) Flow cytometry-based time curve (1–8 h) for GBM cells after incubation with Cy5-BSA. (F) Time series for the OCR measurements of GBM cells using a Seahorse Analyzer. n = 3–4 replicates per group. (G–I) OCR measurements of basal respiration (G), proton leakage (H), and ATP production (I) in GBM cells. (J) Direct measurement of the intracellular ATP concentration by bioluminescence. (K) Colony formation assay was performed in GBM cells. (L) Quantification of colony numbers in (K). (M) Relative cell viability of GBM cells.
Fig. 4
Fig. 4
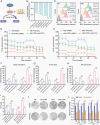
A cPLA2 inhibitor represses endocytosis, ATP production, and GBM cell proliferation through suppressing PTRF-mediated phospholipid reprogramming. (A) Schematic model of the role of cPLA2 in PTRF-induced phospholipid remodeling. (B) Fold change in the levels of various LPCs in N9 PTRF cells treated with DMSO or AACOCF3 based on lipidomics analysis. (C) Flow cytometry analysis of Cy5-BSA after 4 h incubation with DMSO or AACOCF3. (D) N9 cells with or without PTRF overexpression were seeded in XF24 well plates, and treated with DMSO or AACOCF3 for bioenergetic measurements. n = 3–4 replicates per group. (E) N33 cells with or without PTRF overexpression were seeded in XF24 well plates, and treated with DMSO or AACOCF3 for bioenergetic measurements. n = 3–4 replicates per group. (F–H) Graphs showing basal respiration (F), proton leakage (G), and ATP production (H) of GBM cells treated with DMSO or AACOCF3. (I) Intracellular ATP concentration in GBM cells treated with DMSO or AACOCF3, as detected via bioluminescence. (J) Colony formation of GBM cells treated with DMSO or AACOCF3. (K) Relative cell viability of GBM cells treated with DMSO or AACOCF3.
Fig. 5
Fig. 5
PTRF promotes GBM tumor proliferation and suppresses immune responses in vivo. (A) Schematic of the overexpression of PTRF in patient-derived GBM orthotopic xenograft model using lentivirus vector (n = 7 for each group). (B) Representative tumor bioluminescence images of mice at 7, 14, and 21 days after tumor implantation. (C) Tumor growth curves for mice by quantification of bioluminescent imaging signal intensities. (D) Kaplan–Meier survival curve of nude mice. (E) Representative images of H&E staining for tumor volume in the nude mice. (F) IHC staining for Ki-67 and PTRF in the samples. Scale bar, 50 μm. (G) Schematic of the GL261 intracranial tumor model used to investigate the role of PTRF in the immune microenvironment. (H) The levels of ATP in the tumor microenvironment of control and PTRF-overexpressing intracranial tumor model mice. (I) The levels of adenosine in the tumor microenvironment. (J) The levels of GrB within the tumors. (K) Flow cytometry analysis of CD8+ T cells (gated on CD45+CD3+ cells) within GL261 tumors. n = 5–6, with each sample representing tumor tissue from one mouse.
Fig. 6
Fig. 6
AACOCF3 and metformin as a combination therapy against GBM. (A) Representative tumor bioluminescence images of nude mice at 7, 14, and 21 days after tumor implantation. Tumor growth curves for mice bearing PTRF-overexpressing tumors and treated with AACOCF3, metformin, or a combination of AACOCF3 and metformin by quantification of bioluminescence imaging signal intensities (n = 7 for each group). (B) Kaplan–Meier survival curves of the nude mice. (C) Representative images of HE staining of tumors from the nude mice. (D) IHC staining for Ki-67 and cPLA2 in the samples. Scale bar, 50 μm. (E) The levels of ATP in the tumor microenvironment of GL261 tumor with PTRF overexpression in mice treated with AACOCF3, metformin, or a combination of AACOCF3 and metformin. (F) The levels of adenosine in the tumor microenvironment. (G) The levels of GrB within GL261 tumors with PTRF overexpression in mice treated with the indicated agents. (H) Flow cytometry analysis of CD8+ T cells. n = 5, with each sample representing tumor tissue from one mouse. (I) The mechanistic scheme by which PTRF remodels phospholipid metabolism to promote tumor proliferation and suppress immune responses in glioblastoma by stabilizing cPLA2.

Comment in

References

    1. Ostrom QT, Gittleman H, Liao P, et al. . CBTRUS statistical report: primary brain and other central nervous system tumors diagnosed in the United States in 2010–2014. Neuro Oncol. 2017;19(suppl_5):v1–v88. - PMC - PubMed
    1. Van Meir EG, Hadjipanayis CG, Norden AD, Shu HK, Wen PY, Olson JJ. Exciting new advances in neuro-oncology: the avenue to a cure for malignant glioma. CA Cancer J Clin. 2010;60(3):166–193. - PMC - PubMed
    1. Lyssiotis CA, Kimmelman AC. Metabolic interactions in the tumor microenvironment. Trends Cell Biol. 2017;27(11):863–875. - PMC - PubMed
    1. Agnihotri S, Zadeh G. Metabolic reprogramming in glioblastoma: the influence of cancer metabolism on epigenetics and unanswered questions. Neuro Oncol. 2016;18(2):160–172. - PMC - PubMed
    1. Pavlova NN, Thompson CB. The emerging hallmarks of cancer metabolism. Cell Metab. 2016;23(1):27–47. - PMC - PubMed

Publication types