. 2021 Aug;53(4):1407-1425.
doi: 10.3758/s13428-020-01501-5. Epub 2020 Nov 2.

Realistic precision and accuracy of online experiment platforms, web browsers, and devices

Affiliations

Realistic precision and accuracy of online experiment platforms, web browsers, and devices

Alexander Anwyl-Irvine et al. Behav Res Methods. 2021 Aug.

Abstract

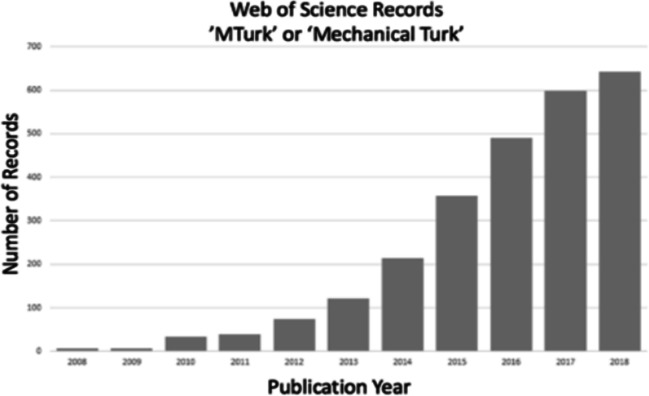
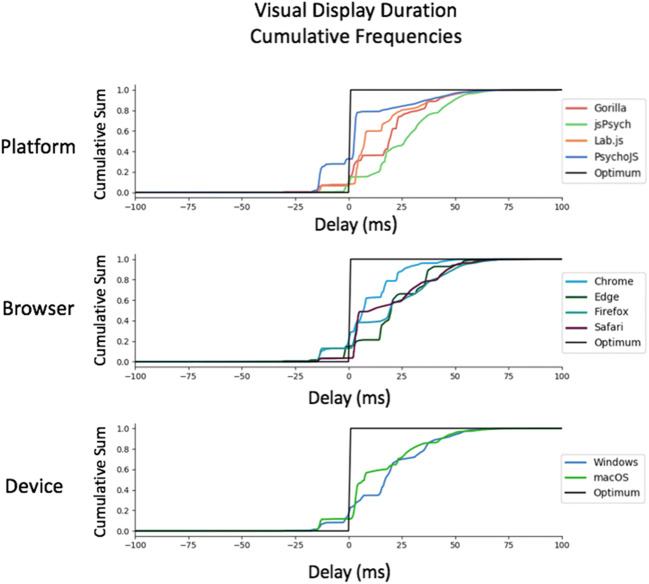
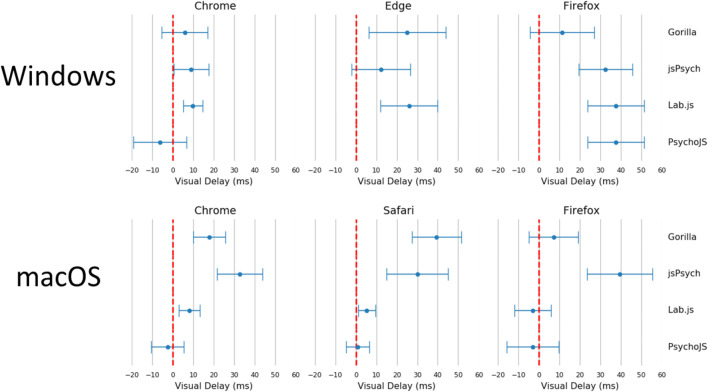
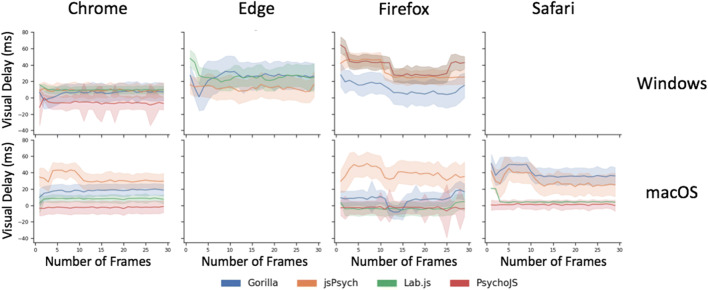
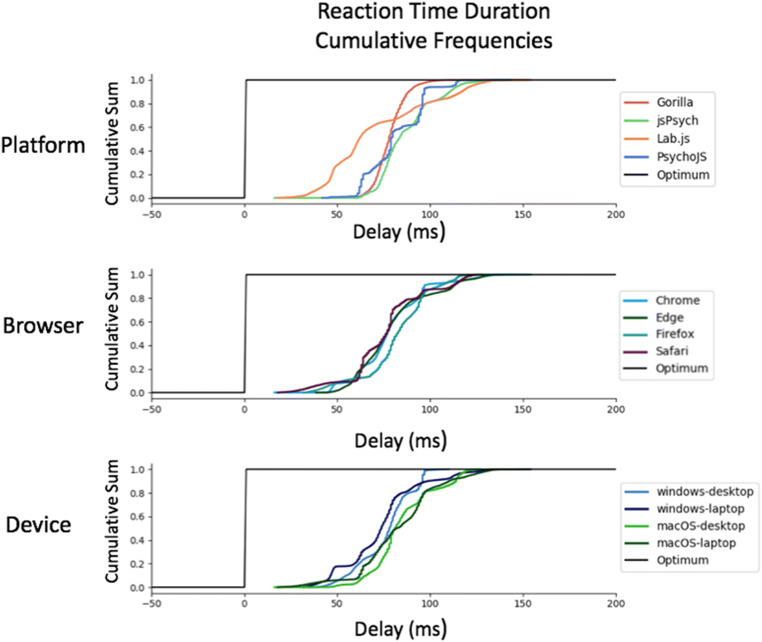
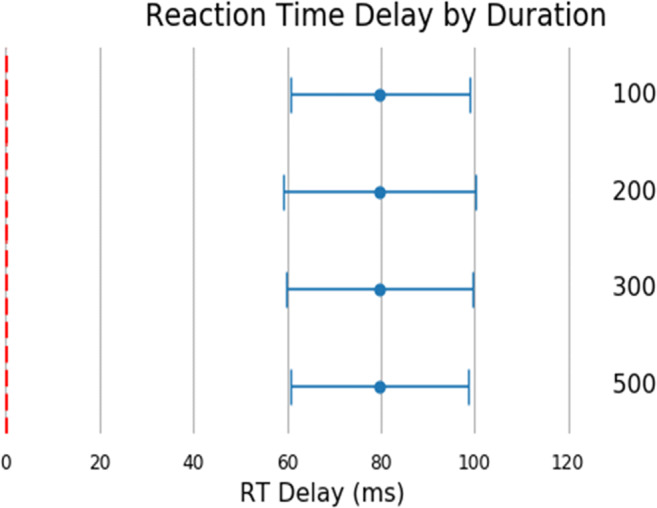
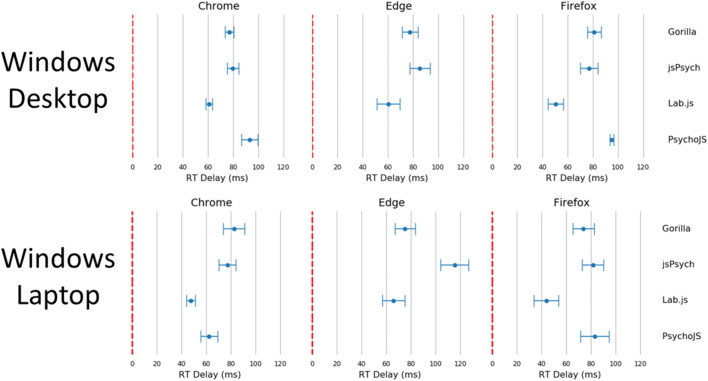
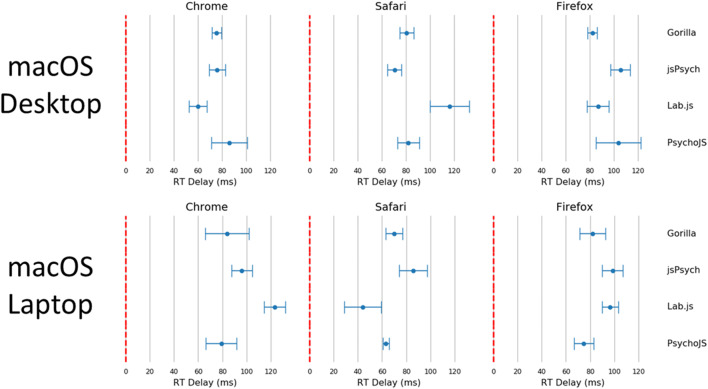
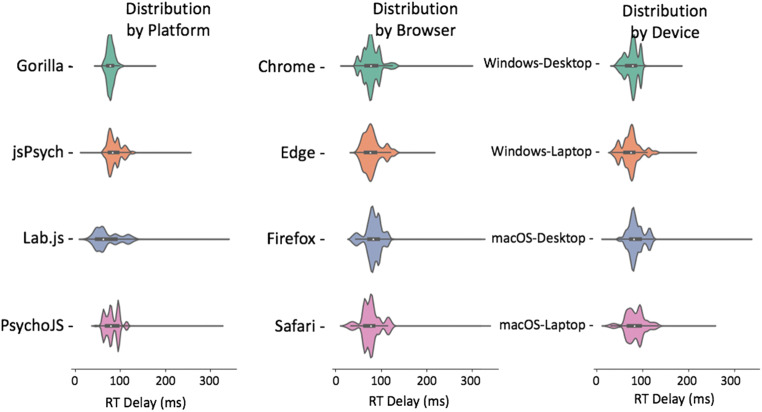
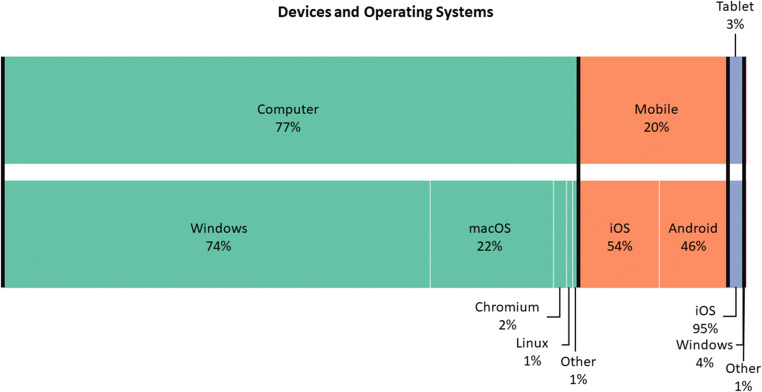
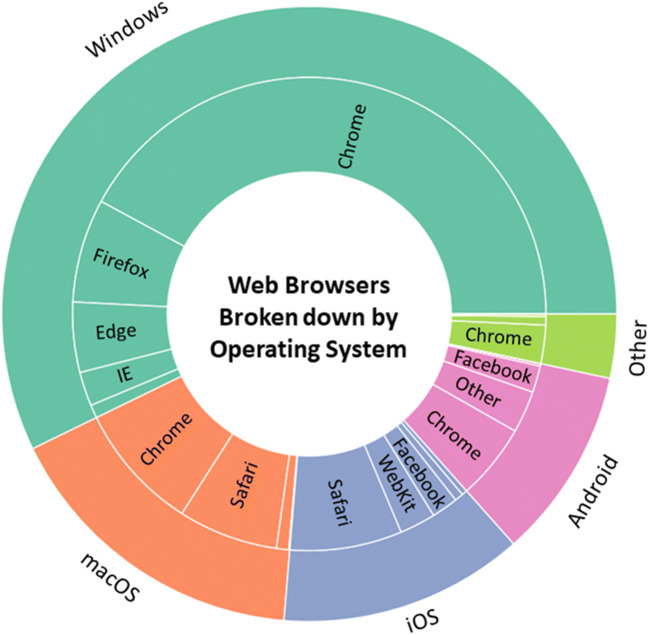
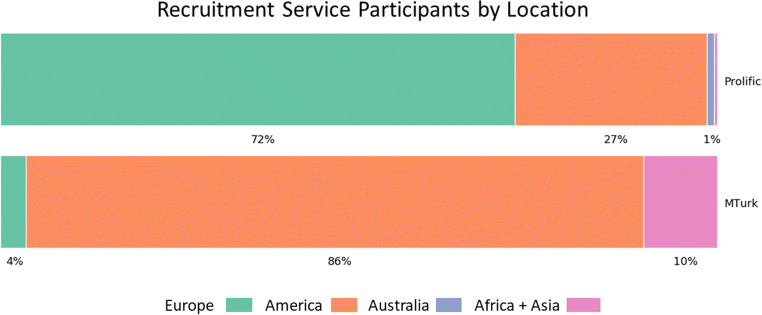
Due to increasing ease of use and ability to quickly collect large samples, online behavioural research is currently booming. With this popularity, it is important that researchers are aware of who online participants are, and what devices and software they use to access experiments. While it is somewhat obvious that these factors can impact data quality, the magnitude of the problem remains unclear. To understand how these characteristics impact experiment presentation and data quality, we performed a battery of automated tests on a number of realistic set-ups. We investigated how different web-building platforms (Gorilla v.20190828, jsPsych v6.0.5, Lab.js v19.1.0, and psychoJS/PsychoPy3 v3.1.5), browsers (Chrome, Edge, Firefox, and Safari), and operating systems (macOS and Windows 10) impact display time across 30 different frame durations for each software combination. We then employed a robot actuator in realistic set-ups to measure response recording across the aforementioned platforms, and between different keyboard types (desktop and integrated laptop). Finally, we analysed data from over 200,000 participants on their demographics, technology, and software to provide context to our findings. We found that modern web platforms provide reasonable accuracy and precision for display duration and manual response time, and that no single platform stands out as the best in all features and conditions. In addition, our online participant analysis shows what equipment they are likely to use.

Keywords: Accuracy; Automated hardware testing; Big data; Experiment builder; MTurk; Online testing; Psychophysics; Reaction time; System testing.


Figures

Fig. 1
Fig. 1
Trends over time in papers mentioning Mechanical Turk, taken from Web of Science
Fig. 2
Fig. 2
Global internet users over time; data taken from the UN International Telecommunication Union (https://www.itu.int/en/ITU-D/Statistics/Pages/stat/default.aspx)
Fig. 3
Fig. 3
Cumulative frequency plots for delays in visual duration, separated by testing platform (top panel), browser (middle panel), and operating system (bottom panel). (Gorilla versions 20190625, 20190730, and 20190828; Lab.js version 19.1.0; PsychoJS/PsychoPy version 3.1.5; jsPsych version 6.0.5)
Fig. 4
Fig. 4
Average visual delay across all frame lengths, broken down by browser, platform, and operating system. Each point represents the average, with bars representing the standard error across all frames. (Gorilla versions 20190625, 20190730, and 20190828; Lab.js version 19.1.0; PsychoJS/PsychoPy version 3.1.5; jsPsych version 6.0.5)
Fig. 5
Fig. 5
Visual delay traces broken down by web browser, operating system, and platform. Visual delay is the delta between requested and recording duration in milliseconds, shown across 30 frames. The shaded errors represent standard error. Safari on Windows, and Edge on macOS, are not supported (so missing). (Gorilla versions 20190625, 20190730, and 20190828; Lab.js version 19.1.0; PsychoJS/PsychoPy version 3.1.5; jsPsych version 6.0.5)
Fig. 6
Fig. 6
Visual delay violin plots of data broken down by platform, browser, and device. The shaded error represents the distribution density, the lines represent the span of times, and the white dot represents the mean. (Gorilla versions 20190625, 20190730, and 20190828; Lab.js version 19.1.0; PsychoJS/PsychoPy version 3.1.5; jsPsych version 6.0.5)
Fig. 7
Fig. 7
Cumulative frequency plots for delays in visual duration, separated by testing platform (top panel), browser (middle panel), and operating system (bottom panel). (Gorilla versions 20190625, 20190730, and 20190828; Lab.js version 19.1.0; PsychoJS/PsychoPy version 3.1.5; jsPsych version 6.0.5)
Fig. 8
Fig. 8
Reaction time delay by requested duration. Points represent the mean, and error bars represent the standard deviation
Fig. 9
Fig. 9
Reaction time delay for Windows 10 devices broken down by browser, device and platform. Points represent the mean, and bars represent the standard deviation. (Gorilla versions 20190625, 20190730, and 20190828; Lab.js version 19.1.0; PsychoJS/PsychoPy version 3.1.5; jsPsych version 6.0.5)
Fig. 10
Fig. 10
Reaction time delay for macOS devices broken down by browser, device, and platform. Points represent the mean, and bars represent the standard deviation (bottom panel). (Gorilla versions 20190625, 20190730, and 20190828; Lab.js version 19.1.0; PsychoJS/PsychoPy version 3.1.5; jsPsych version 6.0.5)
Fig 11
Fig 11
Reaction time violin plots organized by platform, browser, and device. Lines represent the maxima and minima, whereas the shaded error represents a distribution plot (bottom panel). (Gorilla versions 20190625, 20190730, and 20190828; Lab.js version 19.1.0; PsychoJS/PsychoPy version 3.1.5; jsPsych version 6.0.5)
Fig. 12
Fig. 12
Operating systems and devices, nested and stacked bar chart. Based on a sample of 202,600 participants. Percentages are rounded to the nearest integer
Fig. 13
Fig. 13
Nested pie chart representing the breakdown of browsers within each operating system. For readability, wedges less than 3% are not labelled, but all are in the ‘other’ category
Fig. 14
Fig. 14
Scatter graph of screen width and height, with histograms and kernel density estimation plots for each dimension. The diagonal lines represent the different aspect ratios
Fig. 15
Fig. 15
Kernel density estimation of browser window coverage relative to screen size, with individual points as a carpet plot
Fig. 16
Fig. 16
Time zones of participants. The data are scaled into percentile rank scores within the whole sample, for interpretability of geographical spread (but not relative contribution)
Fig. 17
Fig. 17
Continents of participants from each recruitment platform. Africa and Asia are combined as they represent a relatively small number of participants

References

    1. Anwyl-Irvine, A. L., Massonnié, J., Flitton, A., Kirkham, N., & Evershed, J. K. (2019). Gorilla in our midst: An online behavioral experiment builder. Behavior Research Methods. 10.3758/s13428-019-01237-x - PMC - PubMed
    1. Baker, J. D. (2013). Online Survey Software. Online Instruments, Data Collection, and Electronic Measurements: Organizational Advancements, 328–334. 10.4018/978-1-4666-2172-5.ch019
    1. Barnhoorn JS, Haasnoot E, Bocanegra BR, Steenbergen H v. QRTEngine: An easy solution for running online reaction time experiments using Qualtrics. Behavior Research Methods. 2015;47(4):918–929. doi: 10.3758/s13428-014-0530-7. - DOI - PMC - PubMed
    1. Biederman I, Cooper E. Size Invariance in Visual Object Priming. Journal of Experimental Psychology: Human Perception and Performance. 1992;18(1):121–133.
    1. Birnbaum, M. H. (2000). Psychological Experiments on the Internet. Academic Press.

Publication types

LinkOut - more resources