. 2020 Dec;105(12):2123-2140.
doi: 10.1113/EP089070. Epub 2020 Nov 16.

Hypoxia gradually augments metabolic and thermoperceptual responsiveness to repeated whole-body cold stress in humans

Affiliations

Hypoxia gradually augments metabolic and thermoperceptual responsiveness to repeated whole-body cold stress in humans

Michail E Keramidas et al. Exp Physiol. 2020 Dec.

Abstract

New findings: What is the central question of this study? In male lowlanders, does hypoxia modulate thermoregulatory effector responses during repeated whole-body cold stress encountered in a single day? What is the main finding and its importance? A ∼10 h sustained exposure to hypoxia appears to mediate a gradual upregulation of endogenous heat production, preventing the progressive hypothermic response prompted by serial cold stimuli. Also, hypoxia progressively degrades mood, and compounds the perceived thermal discomfort, and sensations of fatigue and coldness.

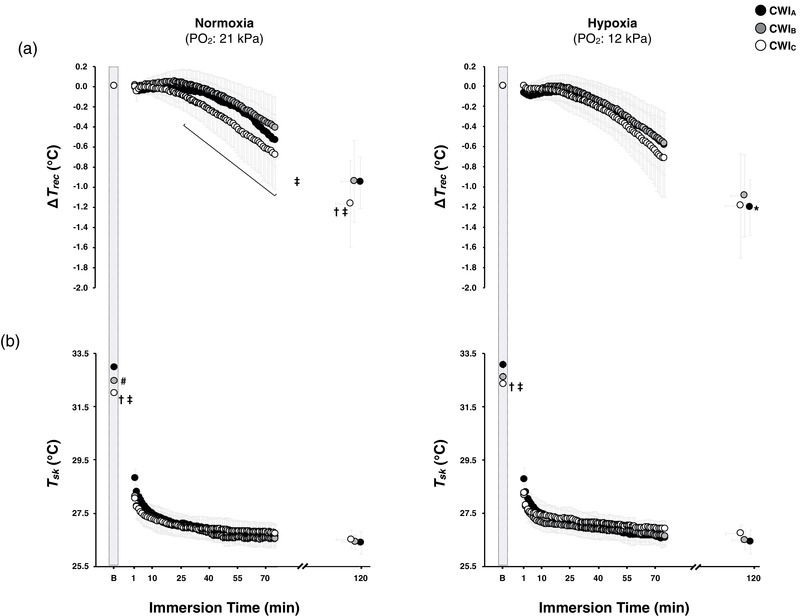
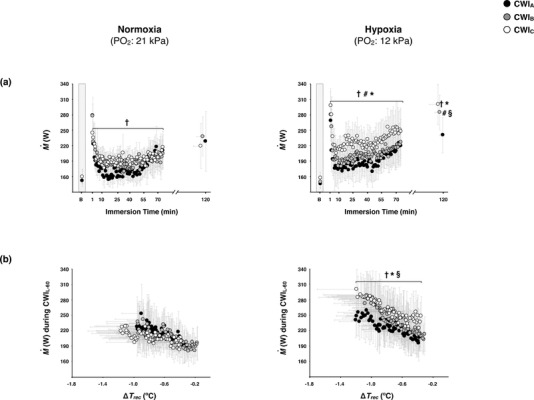
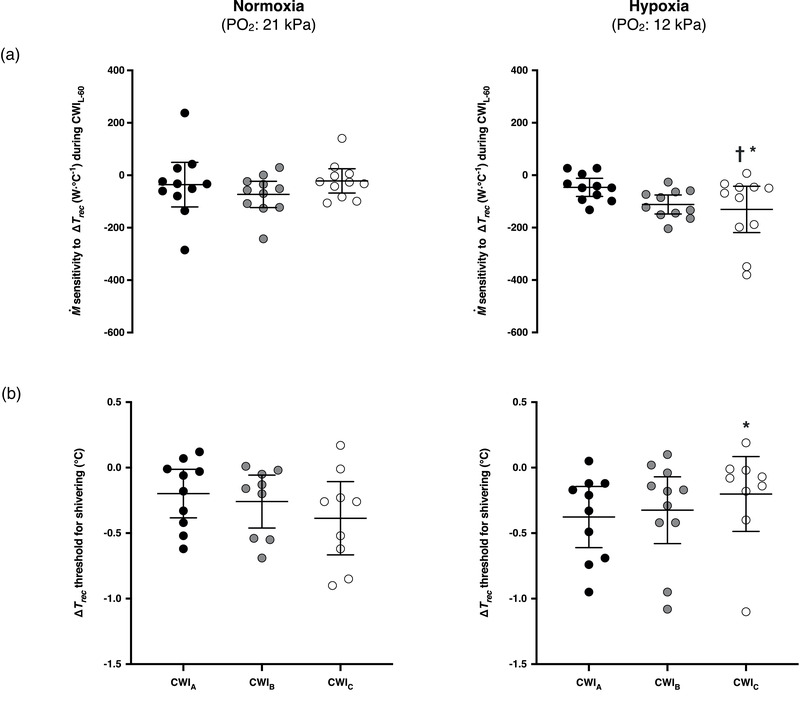
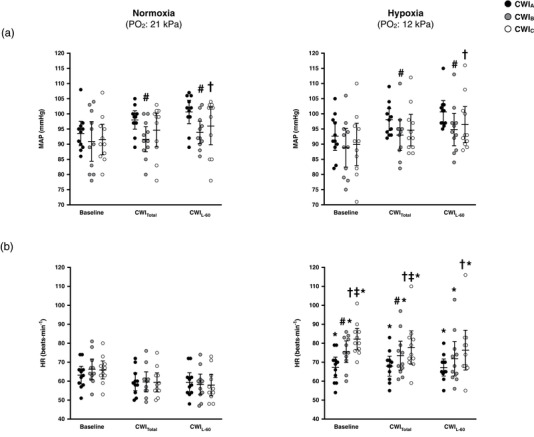
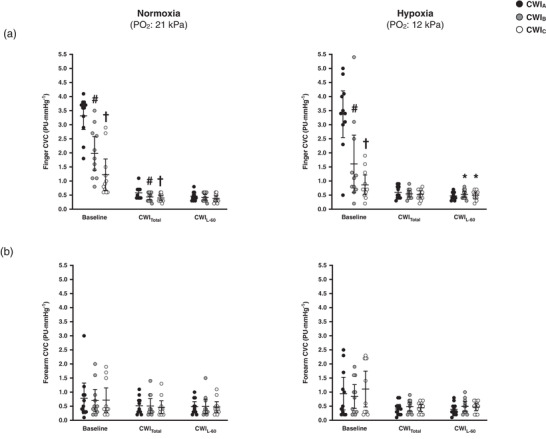
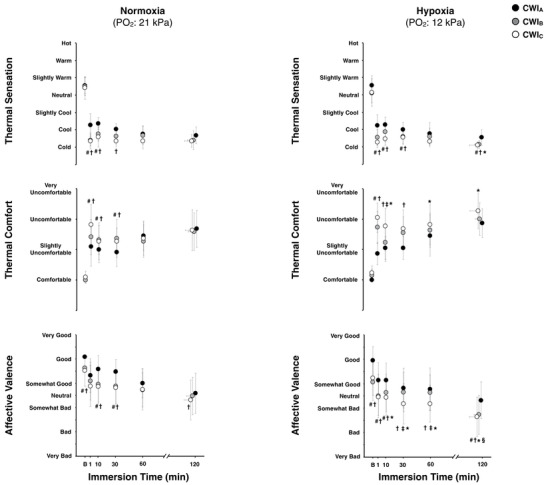
Abstract: We examined whether hypoxia would modulate thermoeffector responses during repeated cold stress encountered in a single day. Eleven men completed two ∼10 h sessions, while breathing, in normobaria, either normoxia or hypoxia ( PO2 : 12 kPa). During each session, subjects underwent sequentially three 120 min immersions to the chest in 20°C water (CWI), interspersed by 120 min rewarming. In normoxia, the final drop in rectal temperature (Trec ) was greater in the third (∼1.2°C) than in the first and second (∼0.9°C) CWIs (P < 0.05). The first hypoxic CWI augmented the Trec fall (∼1.2°C; P = 0.002), but the drop in Trec did not vary between the three hypoxic CWIs (P = 0.99). In normoxia, the metabolic heat production ( Ṁ ) was greater during the first half of the third CWI than during the corresponding part of the first CWI (P = 0.02); yet the difference was blunted during the second half of the CWIs (P = 0.89). In hypoxia, by contrast, the increase in Ṁ was augmented by ∼25% throughout the third CWI (P < 0.01). Regardless of the breathing condition, the cold-induced elevation in mean arterial pressure was blunted in the second and third CWI (P < 0.05). Hypoxia aggravated the sensation of coldness (P = 0.05) and thermal discomfort (P = 0.04) during the second half of the third CWI. The present findings therefore demonstrate that prolonged hypoxia mediates, in a gradual manner, metabolic and thermoperceptual sensitization to repeated cold stress.

Keywords: altitude; fatigue; hypothermia; immersion; sensitization; shivering; thermogenesis.


Conflict of interest statement

None declared.

Figures

FIGURE 1
FIGURE 1
Time course of changes in rectal temperature relative to baseline values (ΔT rec; a), and skin temperature (T sk; b) during the three successive cold‐water (20°C) immersions (CWIA: 1st trial, CWIB: 2nd trial, CWIC: 3rd trial) performed in normoxia and hypoxia. Data are expressed as a function of the immersion time completed by all subjects, including the final value obtained in each CWI. B: baseline. Values are mean (95% CI). Data in all trials were significantly different from baseline (P < 0.001). Significant difference # between CWIA and CWIB, † between CWIA and CWIC, ‡ between CWIB and CWIC, and * between the normoxic and hypoxic CWIA
FIGURE 2
FIGURE 2
Time course of metabolic heat production (M˙) during the total (a; data are expressed as a function of the immersion time completed by all subjects, including the final value obtained in each CWI), and the last 60 min (CWIL‐60; b) period of the three successive cold‐water (20°C) immersions (CWIA: 1st trial, CWIB: 2nd trial, CWIC: 3rd trial) performed in normoxia and hypoxia. B: baseline. Values are mean (95% CI). Data in all trials were significantly different from baseline (P ≤ 0.001). Significant difference # between CWIA and CWIB, † between CWIA and CWIC, § between the normoxic and hypoxic CWIB, and * between the normoxic and hypoxic CWIC
FIGURE 3
FIGURE 3
Mean (95% CI) and individual values of the metabolic heat production (M˙) sensitivity (a) and shivering thresholds (b) obtained during the three successive cold‐water (20°C) immersions (CWIA: 1st trial, CWIB: 2nd trial, CWIC: 3rd trial) performed in normoxia and hypoxia. Number of subjects that exhibited a shivering response in normoxia: CWIA, 10; CWIB, 9; CWIC, 9; and in hypoxia: CWIA, 10; CWIB, 11; CWIC, 9. M˙ sensitivity was calculated for the last 60 min of each immersion (CWIL‐60). ΔT rec: changes in rectal temperature relative to baseline values. Significant difference † between CWIA and CWIC, and * between the normoxic and hypoxic CWIC
FIGURE 4
FIGURE 4
Mean (95% CI) and individual values of mean arterial pressure (MAP; a), and heart rate (HR; b) obtained during the baseline, the total (CWITotal), and the last 60 min (CWIL‐60) period of the three successive cold‐water (20°C) immersions (CWIA: 1st trial, CWIB: 2nd trial, CWIC: 3rd trial) performed in normoxia and hypoxia. Data in all trials were significantly different from baseline (P ≤ 0.02). Significant difference # between CWIA and CWIB, † between CWIA and CWIC, ‡ between CWIB and CWIC, and * between normoxia and hypoxia
FIGURE 5
FIGURE 5
Mean (95% CI) and individual values of cutaneous vascular conductance (CVC) of the left index finger (a) and forearm (b) during the baseline, the total (CWITotal), and the last 60 min (CWIL‐60) period of the three successive cold‐water (20°C) immersions (CWIA: 1st trial, CWIB: 2nd trial, CWIC: 3rd trial) performed in normoxia and hypoxia. Data in all trials were significantly different from baseline (P ≤ 0.01). Significant difference # between CWIA and CWIB, † between CWIA and CWIC, and * between normoxia and hypoxia. PU, perfusion unit
FIGURE 6
FIGURE 6
Mean (95% CI) values of thermal sensation, thermal comfort and affective valence during the three successive cold‐water (20°C) immersions (CWIA: 1st trial, CWIB: 2nd trial, CWIC: 3rd trial) performed in normoxia and hypoxia. Data are expressed as a function of the immersion time completed by all subjects, including the final value obtained in each CWI. B: baseline. Data in all trials were significantly different from baseline (P ≤ 0.001). Significant difference # between CWIA and CWIB, † between CWIA and CWIC, ‡ between CWIB and CWIC, § between the normoxic and hypoxic CWIB, and * between the normoxic and hypoxic CWIC

References

    1. Ainslie, P. N. , & Reilly, T. (2003). Physiology of accidental hypothermia in the mountains: A forgotten story. British Journal of Sports Medicine, 37, 548–550. - PMC - PubMed
    1. Arnold, J. T. , Hemsley, Z. , Hodder, S. G. , Havenith, G. , & Lloyd, A. B. (2020). Reliability and validity of methods in the assessment of cold‐induced shivering thermogenesis. European Journal of Applied Physiology, 120, 591–601. - PMC - PubMed
    1. Arnsten, A. F. (2015). Stress weakens prefrontal networks: Molecular insults to higher cognition. Nature Neuroscience, 18, 1376–1385. - PMC - PubMed
    1. Atkinson, G. , & Batterham, A. M. (2015). True and false interindividual differences in the physiological response to an intervention. Experimental Physiology, 100, 577–588. - PubMed
    1. Attia, M. (1984). Thermal pleasantness and temperature regulation in man. Neuroscience and Biobehavioral Reviews, 8, 335–342. - PubMed

Publication types