. 2020 Dec;24(23):14026-14038.
doi: 10.1111/jcmm.16013. Epub 2020 Nov 2.

Metabolic reprogramming of glycolysis and glutamine metabolism are key events in myofibroblast transition in systemic sclerosis pathogenesis

Affiliations

Metabolic reprogramming of glycolysis and glutamine metabolism are key events in myofibroblast transition in systemic sclerosis pathogenesis

John Henderson et al. J Cell Mol Med. 2020 Dec.

Abstract

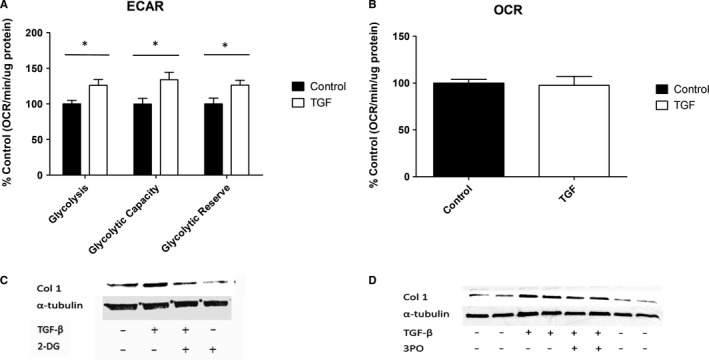
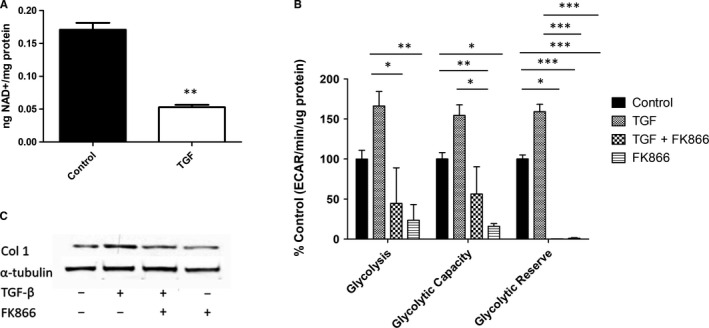
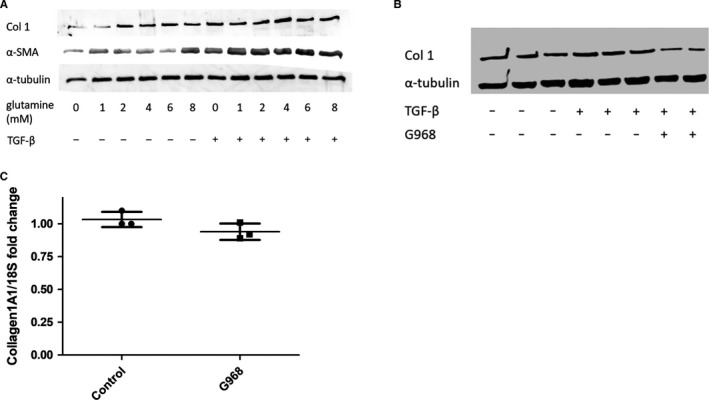
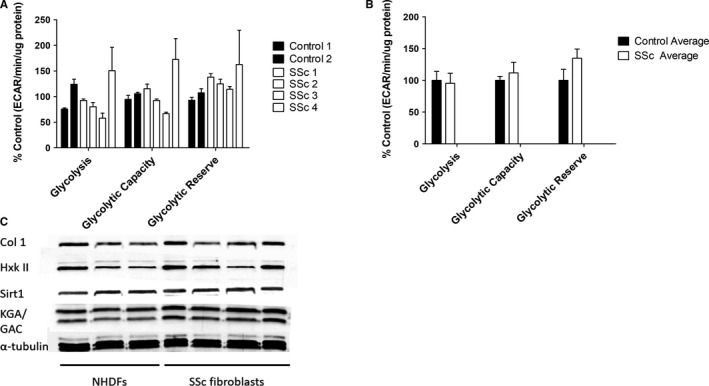
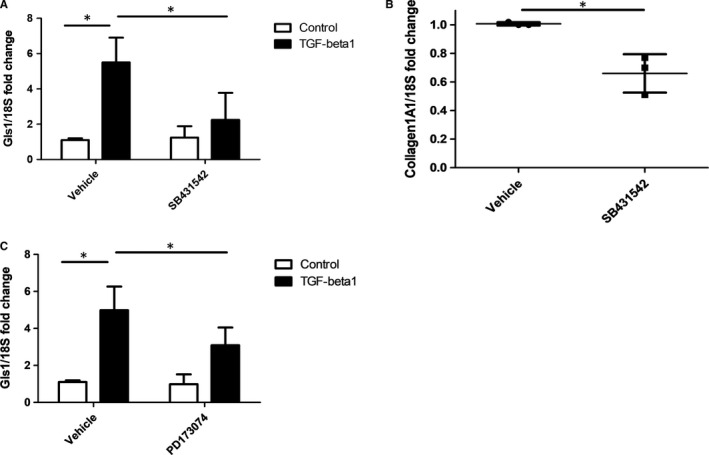
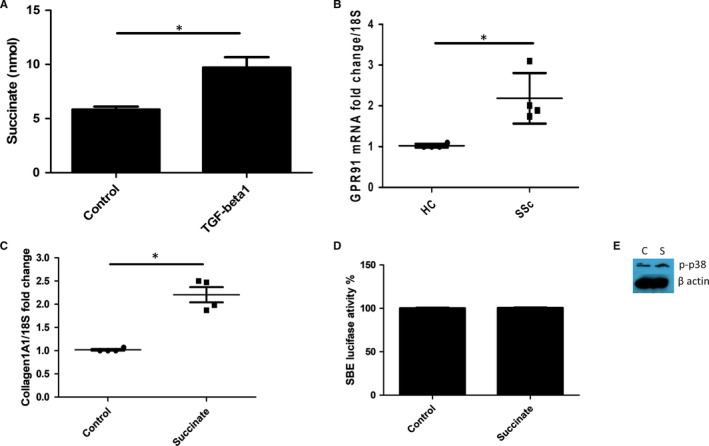
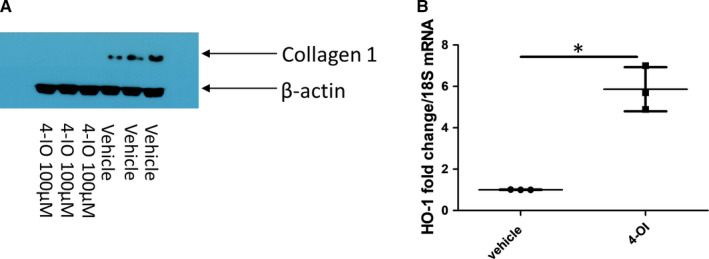
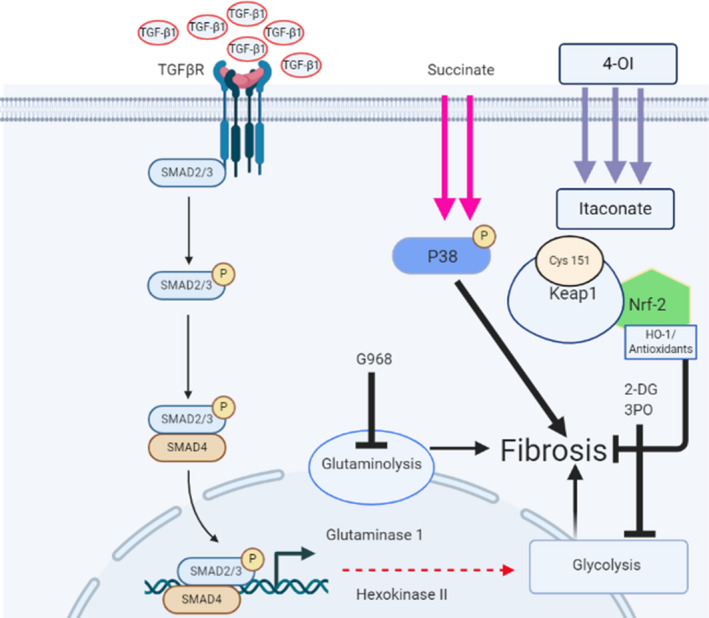
Systemic Sclerosis (SSc) is a rare fibrotic autoimmune disorder for which no curative treatments currently exist. Metabolic remodelling has recently been implicated in other autoimmune diseases; however, its potential role in SSc has received little attention. Here, we aimed to determine whether changes to glycolysis and glutaminolysis are important features of skin fibrosis. TGF-β1, the quintessential pro-fibrotic stimulus, was used to activate fibrotic pathways in NHDFs in vitro. Dermal fibroblasts derived from lesions of SSc patients were also used for in vitro experiments. Parameters of glycolytic function were assessed using by measuring extracellular acidification in response to glycolytic activators/inhibitors, whilst markers of fibrosis were measured by Western blotting following the use of the glycolysis inhibitors 2-dg and 3PO and the glutaminolysis inhibitor G968. Succinate was also measured after TGF-β1 stimulation. Itaconate was added to SSc fibroblasts and collagen examined. TGF-β1 up-regulates glycolysis in dermal fibroblasts, and inhibition of glycolysis attenuates its pro-fibrotic effects. Furthermore, inhibition of glutamine metabolism also reverses TGF-β1-induced fibrosis, whilst glutaminase expression is up-regulated in dermal fibroblasts derived from SSc patient skin lesions, suggesting that enhanced glutamine metabolism is another aspect of the pro-fibrotic metabolic phenotype in skin fibrosis. TGF-β1 was also able to enhance succinate production, with increased succinate shown to be associated with increased collagen expression. Incubation of SSc cells with itaconate, an important metabolite, reduced collagen expression. TGF-β1 activation of glycolysis is a key feature of the fibrotic phenotype induced by TGF-B1 in skin cells, whilst increased glutaminolysis is also evident in SSc fibroblasts.

Keywords: Systemic Sclerosis; TGF-β1; fibrosis; glutaminolysis; glycolysis.


Conflict of interest statement

The authors state there are no conflicts of interest to declare.

Figures

FIGURE 1
FIGURE 1
Glycolysis is a vital component of TGF‐β1 induction of fibrotic proteins in NHDFs. A, The glycolytic parameters of NHDFs treated with/without 10 ng/mL TGF‐β1 were measured on a Seahorse XFp Analyser by performing a glycolysis stress test. B, OXPHOS was also measured in NHDFs treated with/without 10 ng/mL TGF‐β1, by measuring the oxygen consumption rate (OCR). Data shown are the percentage change compared with control untreated cells, and OCR is measured by pmol/min normalized to total protein. C, NHDFs were treated with/without 10 ng/mL TGF‐β1 and/or the glycolysis inhibitor 2‐DG (10 Mm), and the proteins indicated were measured by Western blotting. D, Likewise, Western blotting was used to observe changes to proteins of interest in NHDFs were treated with/without 10 ng/mL TGF‐β1 and/or the glycolytic flux inhibitor 3PO (8 µmol/L). *Represents P < .05. Error bars represent the mean (n = 3) ±SEM. Statistical significance was tested for using 1‐way ANOVA followed by a Bonferroni post hoc test
FIGURE 2
FIGURE 2
NAD+ levels regulate glycolysis and fibrotic expression in TGF‐β1 NHDFs. A, NAD+ levels were measured for NHDFs treated with/without 10 ng/mL TGF‐β1 using a commercial kit and normalized to protein levels. Statistical significance was tested for using a Student's t test and is highly significant. B, The glycolytic parameters of NHDFs treated with/without 10 ng/mL TGF‐β1 and or 10 nmol/L FK866 were measured on a Seahorse XFp Analyser by performing a glycolysis stress test. Statistical analysis was performed using 1‐way ANOVA and significant differences between the treatments tested using a Bonferroni post hoc test. C, Expression of collagen I and α‐tubulin was measured by Western blotting for NHDFs treated with/without 10 ng/mL TGF‐β1 and or 10 nmol/L FK866. *Represents P < .05, **P < .01, ***P < .0001. Error bars represent the mean (n = 5 for the NAD+ assay and n = 3 for the glycolysis stress test) ±SEM
FIGURE 3
FIGURE 3
Glutaminase activity is essential for TGF‐β1 driven effects. A, NHDFs were treated with/without 10 ng/mL TGF‐β1 and various concentrations of L‐glutamine. Proteins of interest were quantified by Western blotting. B, The expression of Collagen I and α‐tubulin was quantified by Western blotting for NHDFs treated with/without 10 ng/mL TGF‐β1 and/or the specific glutaminase inhibitor G968 (10 µmol/L). C, The glutaminase inhibitor did not change the expression of collagen1A1 gene expression. Cells were treated with or without the glutaminase inhibitor G968 (10 µmol/L) for 36 h after which qRT‐PCR was performed for collagen1A1 gene expression P = .13 Student's t test n = 3. Data are the mean and SD and is normalized to 18S as the housekeeping gene (n = 3)
FIGURE 4
FIGURE 4
Glycolysis and glutaminase expression in SSc patient derived dermal fibroblasts. Glycolytic parameters for dermal fibroblasts from healthy controls (n = 3) and SSc patients (n = 4) were measured using a glycolysis stress test, displayed individually (A) and as disease and control averages (B). Statistical analysis was performed using 1‐way ANOVA. C, Expression of glutaminase (KGA/GAC), hexokinase II, collagen I and α‐tubulin in SSc and healthy control fibroblasts was analysed by Western blotting. Error bars represent the mean (n = 3) ±SEM
FIGURE 5
FIGURE 5
TGF‐β1 up‐regulates Gls1 in dermal fibroblasts via Smad. A, Expression of Gls1 was measured by qRT‐PCR after stimulation with TGF‐β1 and pre‐treated with the Smad inhibitor SB431542 (1 µmol/L) or vehicle control. Data are the mean and standard deviation *= Significant Two‐way ANOVA; n = 4 donors. B, Collagen1A1 gene expression was quantified after vehicle control or SB431542 and after 48 h with TGF‐β1 incubation. Data were normalized to the housekeeping gene 18S and shown as fold change compared with vehicle control treated cells. Data are the mean and SD *= significant Student's t test P = .0113; n = 3 donors. C, Expression of Gls1 was measured by qRT‐PCR after stimulation with TGF‐β1 and pre‐treated with the FGFR3 inhibitor PD173074 (20 nmol/L) or DMSO vehicle control treated. Data are the mean and standard deviation. *=Significant Two‐way ANOVOA; n = 4
FIGURE 6
FIGURE 6
TGF‐β1 up‐regulates succinate levels. A, Healthy dermal fibroblasts were stimulated with TGF‐β1 or not, and after 36 h succinate was quantified colorimetrically * significantly different compared with controls P = .0002; Student's t test. Data are the mean and SD n = 4. B, GPR91 expression is higher in SSc dermal fibroblasts *Significantly different compared with healthy controls P = .0096 n = 4 donors. C, Collagen1A1 was quantified after succinate incubation (5 mmol/L) using qRT‐PCR, Data are normalized to the housekeeping gene 18S and shown as fold change compared with control. Data are mean and SD * significant difference compared with control P = .0005 Student's t test; n = 4. D, No significant difference in SMAD activation after succinate incubation. Luciferase activity is determined after stimulation with succinate. Data are normalized to untreated control set to 100% luciferase set to Renilla luciferase for transfection efficacy n = 3. E, Western blot of healthy dermal fibroblast incubated with succinate after 15 min and the cells were probed with phosphorylated p38 and re probed with β‐actin for equal loading. C = control untreated S = Succinate 5 mmol/L
FIGURE 7
FIGURE 7
The metabolic regulator Itaconate reduces collagen in SSc fibroblasts. A, Western blot to quantify collagen 1 in SSc dermal fibroblasts exposed to the cell permeable 4‐octyl Itaconate (100 µmol/L) or vehicle control for 48 h. Cells were lysed and subjected to PAGE and transferred and probed with collagen 1 antibody. Β‐actin is used to confirm equal loading of protein. B, Elevated HO‐1 gene expression after Itaconate stimulation (100 µmol/L). Data are the mean from three individual donors each point a donor. Data are normalized to the housekeeping gene 18S (*P = .0014 Student's t test; n = 3)
FIGURE 8
FIGURE 8
Putative pathway of metabolic alterations via TGF‐β1 TGF‐β1 binds the cognate receptor and then causes downstream signalling from the canonical pathway to activate glutaminolysis via up‐regulation of glutaminase 1 enzyme, and this leads to fibrosis possibly through increased epigenetic marks. Glycolysis is also up‐regulated leading to fibrosis via up‐regulation of glycolytic enzymes. Both pathways can be blocked with G968 (glutaminase 1 inhibitor) or 2‐DG and 3PO for glycolysis. Extracellular succinate also up‐regulates fibrosis possibly through the activation of P38 via phosphorylation of this intracellular signalling molecule. 4‐OI mediates an anti‐fibrotic effect by first being cleaved to itaconate via esterases and alkylates cysteine residue 161 (Cys 161) of KEAP1 thus repressing its ability to modify nrf‐2 to be degraded via the proteosome. Nrf‐2 is then up‐regulated and downstream targets such as HO‐1 are increased that are anti‐fibrotic. 2‐DG; 2Deoxyglucose, 4‐OI; 4‐octyl itaconate, HO‐1; Haem oxygenase‐1, nrf2; nuclear factor erythroid‐2‐related factor, TGF‐β1; transforming growth factor beta 1

References

    1. Denton CP, Khanna D. Systemic sclerosis. Lancet. 2017;390(10103):1685‐1699. - PubMed
    1. Volkmann ER, Varga J. Emerging targets of disease‐modifying therapy for systemic sclerosis. Nat Rev Rheumatol. 2019;15(4):208‐224. - PubMed
    1. Hinchcliff M, O'Reilly S. Current and potential new targets in systemic sclerosis therapy: a new hope. Curr Rheumatol Rep. 2020;22(8):42. - PMC - PubMed
    1. Warburg O, Wind F, Negelein E. The metabolism of tumors in the body. J Gen Physiol. 1927;8(6):519‐530. - PMC - PubMed
    1. Lu J, Tan M, Cai Q. The Warburg effect in tumor progression: mitochondrial oxidative metabolism as an anti‐metastasis mechanism. Cancer Lett, 2015;356(2 Pt A):156‐164. - PMC - PubMed

Publication types

MeSH terms