

Effect of the glucagon-like peptide-1 analogue liraglutide versus placebo treatment on circulating proglucagon-derived peptides that mediate improvements in body weight, insulin secretion and action: A randomized controlled trial
- PMID: 33140542
- PMCID: PMC7856054
- DOI: 10.1111/dom.14242
Effect of the glucagon-like peptide-1 analogue liraglutide versus placebo treatment on circulating proglucagon-derived peptides that mediate improvements in body weight, insulin secretion and action: A randomized controlled trial
Abstract
Aim: To examine how circulating glucagon-like peptide-1 (GLP-1) concentrations during liraglutide treatment relate to its therapeutic actions on glucose and weight, and to study the effects of liraglutide on other proglucagon-derived peptides (PGDPs), including endogenous GLP-1, glucagon-like peptide-2, glucagon, oxyntomodulin, glicentin and major proglucagon fragment, which also regulate metabolic and weight control.
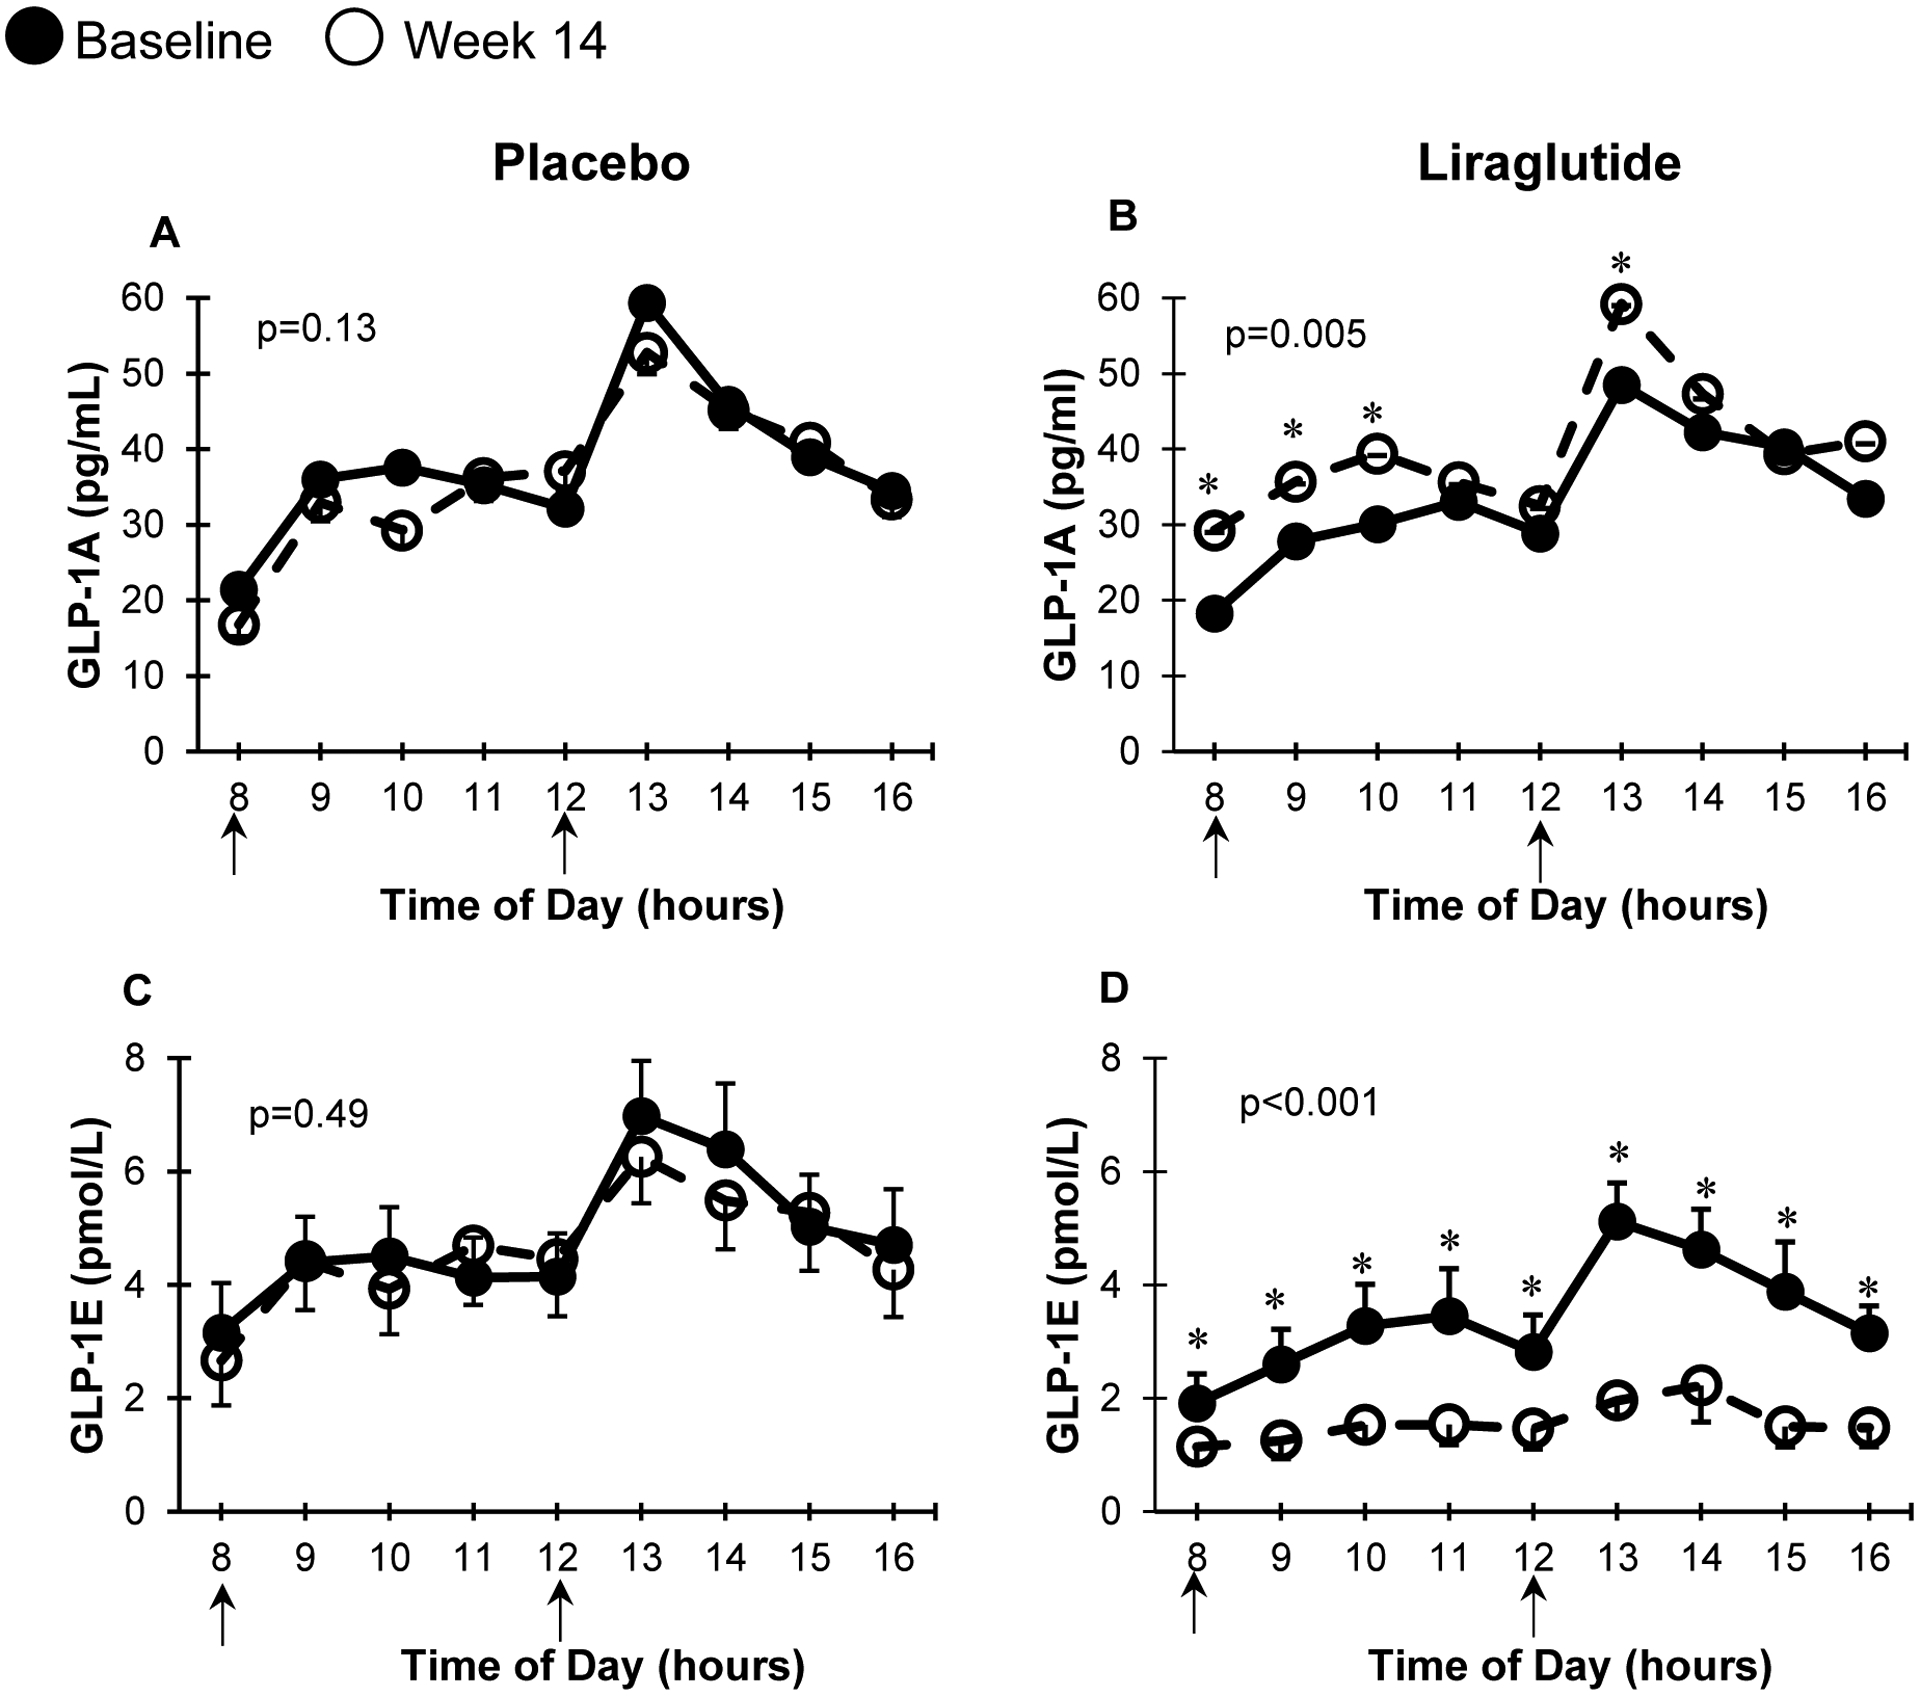
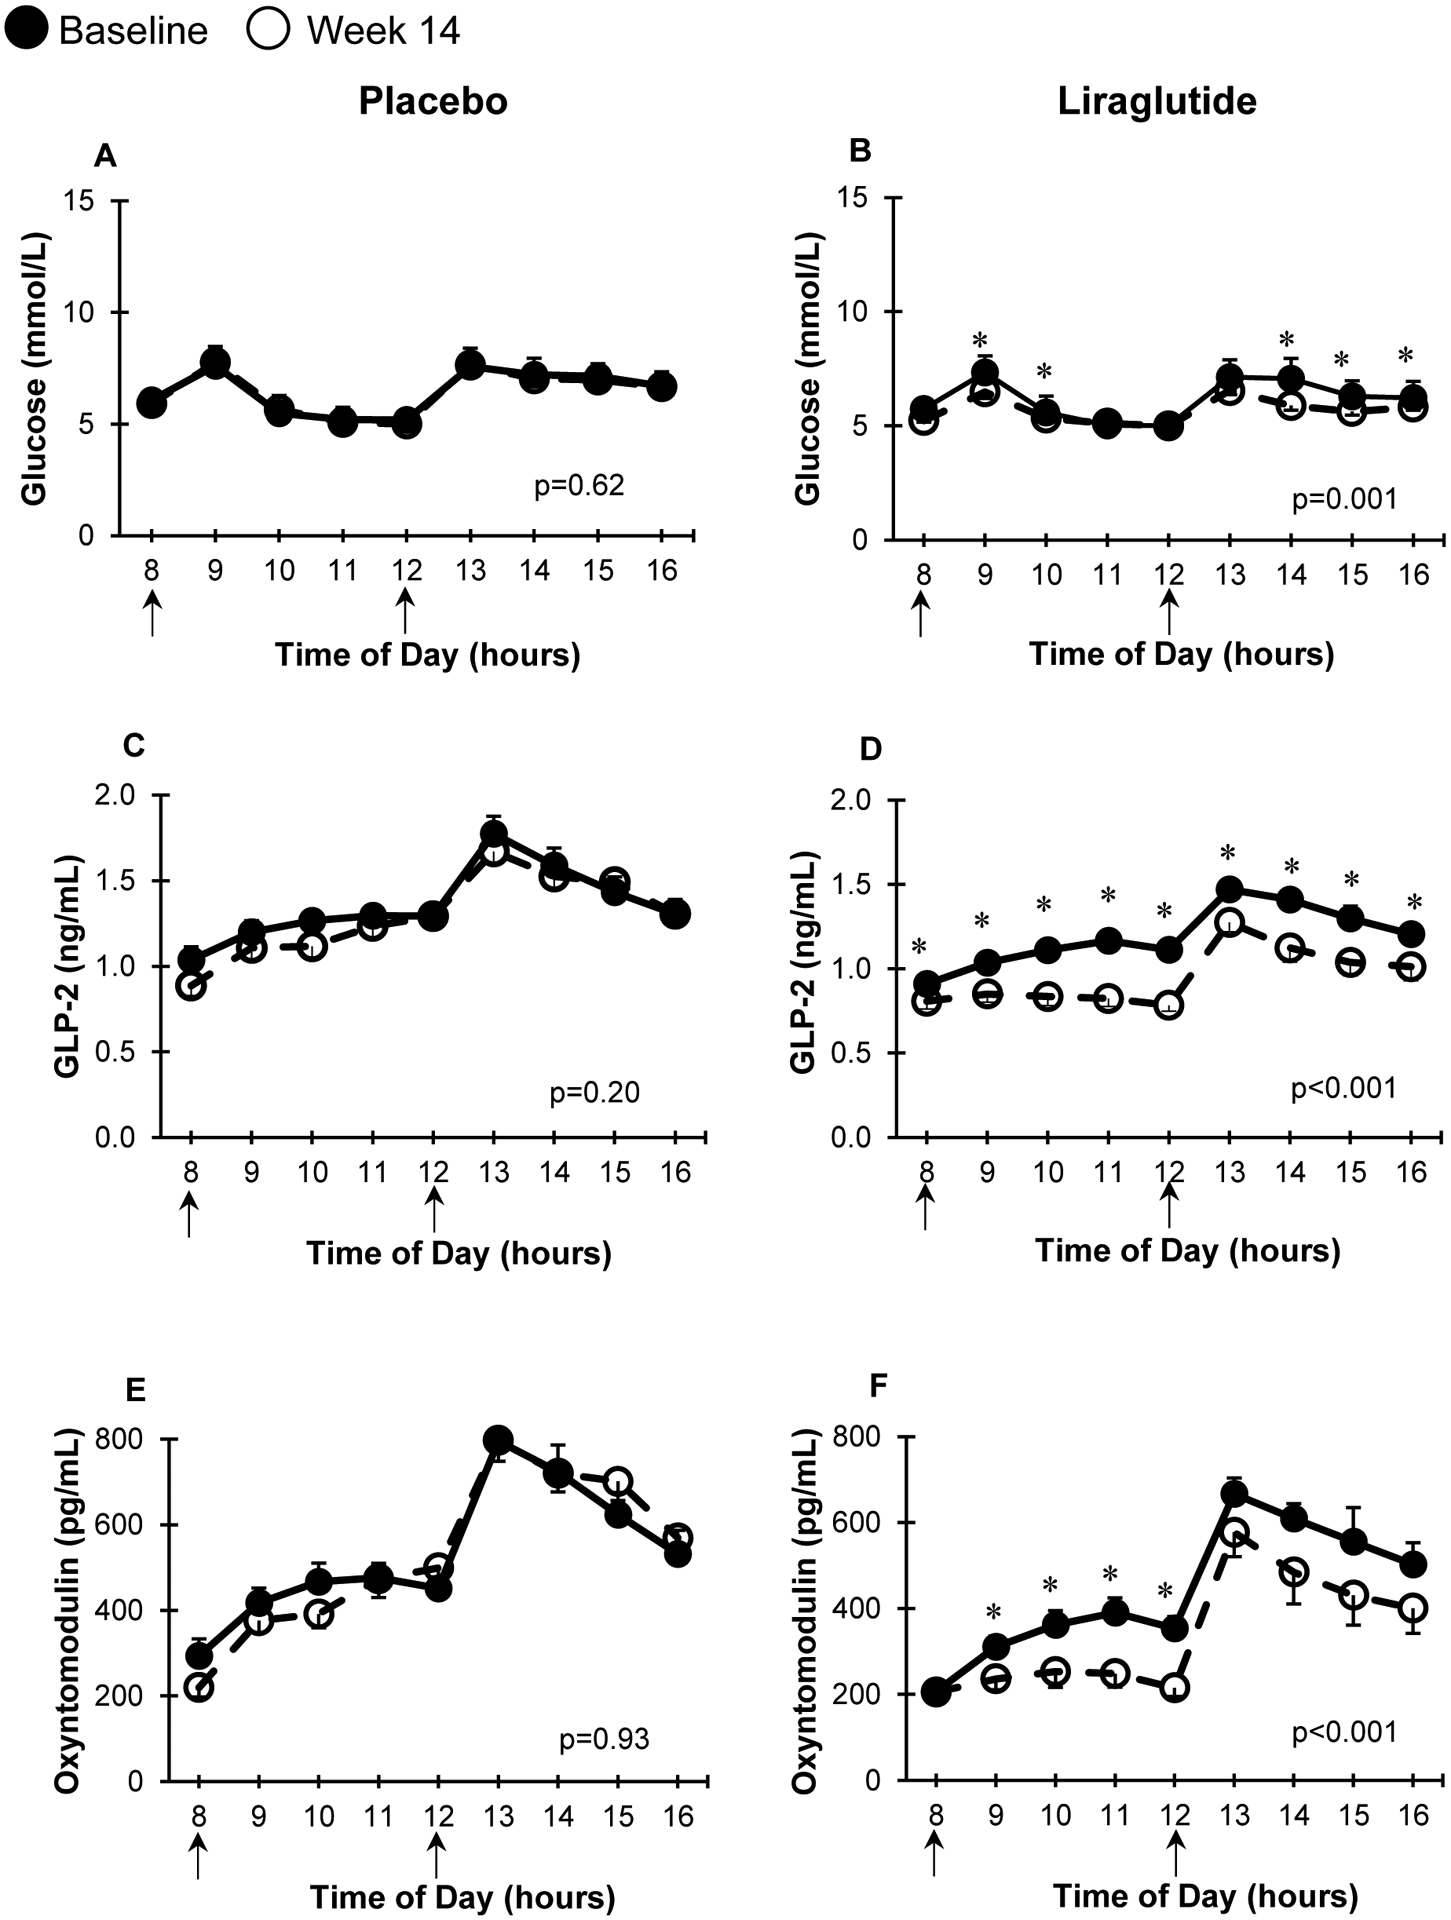
Materials and methods: Adults who were overweight/obese (body mass index 27-40 kg/m2 ) with prediabetes were randomized to liraglutide (1.8 mg/day) versus placebo for 14 weeks. We used specific assays to measure exogenous (liraglutide, GLP-1 agonist [GLP-1A]) and endogenous (GLP-1E) GLP-1, alongside five other PGDP concentrations during a mixed meal tolerance test (MMTT) completed at baseline and at week 14 (liraglutide, n = 16; placebo, n = 19). Glucose during MMTT, steady-state plasma glucose (SSPG) concentration for insulin resistance and insulin secretion rate (ISR) were previously measured. MMTT area-under-the-curve (AUC) was calculated for ISR, glucose and levels of PGDPs.
Results: Participants on liraglutide versus placebo had significantly (P ≤ .004) decreased weight (mean -3.6%, 95% CI [-5.2% to -2.1%]), SSPG (-32% [-43% to -22%]) and glucose AUC (-7.0% [-11.5% to -2.5%]) and increased ISR AUC (30% [16% to 44%]). GLP-1A AUC at study end was significantly (P ≤ .04) linearly associated with % decrease in weight (r = -0.54) and SSPG (r = -0.59) and increase in ISR AUC (r = 0.51) in the liraglutide group. Treatment with liraglutide significantly (P ≤ .005) increased exogenous GLP-1A AUC (median 310 vs. 262 pg/mL × 8 hours at baseline but decreased endogenous GLP-1E AUC [13.1 vs. 24.2 pmol/L × 8 hours at baseline]), as well as the five other PGDPs. Decreases in the PGDPs processed in the intestines are independent of weight loss, indicating a probable direct effect of GLP-1 receptor agonists to decrease their endogenous production in contrast to weight loss-dependent changes in glucagon and major proglucagon fragment that are processed in pancreatic alpha cells.
Conclusions: Circulating GLP-1A concentrations, reflecting liraglutide levels, predict improvement in weight, insulin action and secretion in a linear manner. Importantly, liraglutide also downregulates other PGDPs, normalization of the levels of which may provide additional metabolic and weight loss benefits in the future.
Keywords: clinical trial, control, GLP-1, GLP-1 analogue, glucagon, glycaemic, liraglutide.
© 2020 John Wiley & Sons Ltd.
Conflict of interest statement
Conflict of interest statement
AK, BK, GS work for Ansh Labs. CSM has been a shareholder of and reports grants through his institution and personal consulting fees from Coherus Inc and personal consulting fees from Pangea Inc, reports grants through his institution and personal consulting fees from Eisai and Novo Nordisk, reports personal consulting fees and in kind support with research reagents from Ansh Labs, reports personal consulting fees from Genfit, P.E.S., Loumos, Intercept, Astra Zeneca, Aegerion and Regeneron, reports in kind support (educational activity meals at and through his institution) from Amarin, Janssen, Boehringer Ingelheim and travel support and fees from TMIOA, the California Walnut Commission and the Cardiometabolic Health Conference.
Figures


References
-
- Perakakis N, Kokkinos A, Peradze N, et al. Circulating levels of gastrointestinal hormones in response to the most common types of bariatric surgery and predictive value for weight loss over one year: Evidence from two independent trials. Metabolism. 2019;101:153997. - PubMed
-
- Perakakis N, Mantzoros CS. The role of glicentin and oxyntomodulin in human metabolism: new evidence and new directions. J Clin Endocrinol Metab. 2020; 105(8):e3003–e3005. - PubMed
-
- Nielsen MS, Ritz C, Wewer Albrechtsen NJ, Holst JJ, le Roux CW, Sjödin A. Oxyntomodulin and Glicentin May Predict the Effect of Bariatric Surgery on Food Preferences and Weight Loss. J Clin Endocrinol Metab. 2020;105(4). - PubMed
Publication types
MeSH terms
Substances
Grants and funding
LinkOut - more resources
Full Text Sources
