Cycling in degradation of organic polymers and uptake of nutrients by a litter-degrading fungus
- PMID: 33140552
- PMCID: PMC7894533
- DOI: 10.1111/1462-2920.15297
Cycling in degradation of organic polymers and uptake of nutrients by a litter-degrading fungus
Abstract
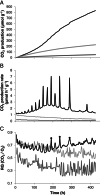
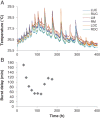
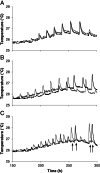
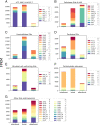
Wood and litter degrading fungi are the main decomposers of lignocellulose and thus play a key role in carbon cycling in nature. Here, we provide evidence for a novel lignocellulose degradation strategy employed by the litter degrading fungus Agaricus bisporus (known as the white button mushroom). Fusion of hyphae allows this fungus to synchronize the activity of its mycelium over large distances (50 cm). The synchronized activity has a 13-h interval that increases to 20 h before becoming irregular and it is associated with a 3.5-fold increase in respiration, while compost temperature increases up to 2°C. Transcriptomic analysis of this burst-like phenomenon supports a cyclic degradation of lignin, deconstruction of (hemi-) cellulose and microbial cell wall polymers, and uptake of degradation products during vegetative growth of A. bisporus. Cycling in expression of the ligninolytic system, of enzymes involved in saccharification, and of proteins involved in nutrient uptake is proposed to provide an efficient way for degradation of substrates such as litter.
© 2020 The Authors. Environmental Microbiology published by Society for Applied Microbiology and John Wiley & Sons Ltd.
Figures


Similar articles
-
Occurrence and function of enzymes for lignocellulose degradation in commercial Agaricus bisporus cultivation.Appl Microbiol Biotechnol. 2017 Jun;101(11):4363-4369. doi: 10.1007/s00253-017-8294-5. Epub 2017 May 2. Appl Microbiol Biotechnol. 2017. PMID: 28466110 Free PMC article. Review.
-
Uncovering the abilities of Agaricus bisporus to degrade plant biomass throughout its life cycle.Environ Microbiol. 2015 Aug;17(8):3098-109. doi: 10.1111/1462-2920.12967. Epub 2015 Aug 4. Environ Microbiol. 2015. PMID: 26118398
-
Lignin degradation by Agaricus bisporus accounts for a 30% increase in bioavailable holocellulose during cultivation on compost.J Agric Food Chem. 2003 Apr 9;51(8):2242-5. doi: 10.1021/jf021131h. J Agric Food Chem. 2003. PMID: 12670164
-
Genome sequence of the button mushroom Agaricus bisporus reveals mechanisms governing adaptation to a humic-rich ecological niche.Proc Natl Acad Sci U S A. 2012 Oct 23;109(43):17501-6. doi: 10.1073/pnas.1206847109. Epub 2012 Oct 8. Proc Natl Acad Sci U S A. 2012. PMID: 23045686 Free PMC article.
-
Microbial ecology of the Agaricus bisporus mushroom cropping process.Appl Microbiol Biotechnol. 2018 Feb;102(3):1075-1083. doi: 10.1007/s00253-017-8683-9. Epub 2017 Dec 8. Appl Microbiol Biotechnol. 2018. PMID: 29222576 Review.
Cited by
-
Feeding growing button mushrooms: The role of substrate mycelium to feed the first two flushes.PLoS One. 2022 Jul 26;17(7):e0270633. doi: 10.1371/journal.pone.0270633. eCollection 2022. PLoS One. 2022. PMID: 35881577 Free PMC article.
References
-
- Alexander, N.J. , McCormick, S.P. , and Hohn, T.M. (1999) TRI12, a trichothecene efflux pump from Fusarium sporotrichioides: gene isolation and expression in yeast. Mol Gen Genet 261: 977–984. - PubMed
-
- Arantes, V. , Jellison, J. , and Goodell, B. (2012) Peculiarities of brown‐rot fungi and biochemical Fenton reaction with regard to their potential as a model for bioprocessing biomass. Appl Microbiol Biotechnol 94: 323–338. - PubMed
-
- Atkey, P.T. , and Wood, D.A. (1983) An electron microscope study of wheat straw composted as a substrate for the cultivation of the edible mushroom (Agaricus bisporus). J Appl Bacteriol 55: 293–304.
-
- Burton, K. , Partis, M. , Wood, D. , and Thurston, C. (1997) Accumulation of serine proteinase in senescent sporophores of the cultivated mushroom, Agaricus bisporus. Mycol Res 101: 146–152.
Publication types
MeSH terms
Substances
Supplementary concepts
Grants and funding
LinkOut - more resources
Full Text Sources
Other Literature Sources
Molecular Biology Databases

