

Alternative splicing coupled mRNA decay shapes the temperature-dependent transcriptome
- PMID: 33140569
- PMCID: PMC7726792
- DOI: 10.15252/embr.202051369
Alternative splicing coupled mRNA decay shapes the temperature-dependent transcriptome
Abstract
Mammalian body temperature oscillates with the time of the day and is altered in diverse pathological conditions. We recently identified a body temperature-sensitive thermometer-like kinase, which alters SR protein phosphorylation and thereby globally controls alternative splicing (AS). AS can generate unproductive variants which are recognized and degraded by diverse mRNA decay pathways-including nonsense-mediated decay (NMD). Here we show extensive coupling of body temperature-controlled AS to mRNA decay, leading to global control of temperature-dependent gene expression (GE). Temperature-controlled, decay-inducing splicing events are evolutionarily conserved and pervasively found within RNA-binding proteins, including most SR proteins. AS-coupled poison exon inclusion is essential for rhythmic GE of SR proteins and has a global role in establishing temperature-dependent rhythmic GE profiles, both in mammals under circadian body temperature cycles and in plants in response to ambient temperature changes. Together, these data identify body temperature-driven AS-coupled mRNA decay as an evolutionary ancient, core clock-independent mechanism to generate rhythmic GE.
Keywords: NMD; SR proteins; alternative splicing; circadian clock; mRNA decay; temperature.
© 2020 The Authors. Published under the terms of the CC BY NC ND 4.0 license.
Conflict of interest statement
The authors declare that they have no conflict of interest.
Figures
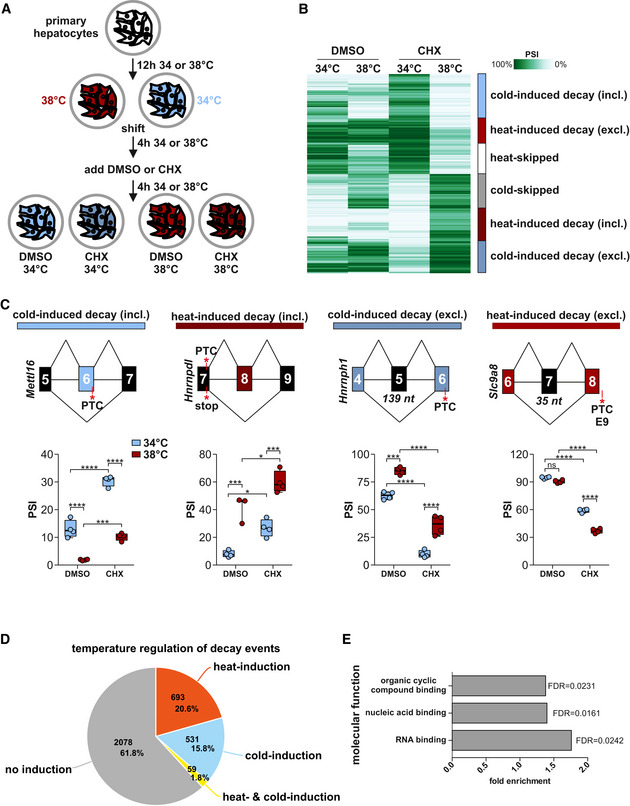
Generation of RNA samples from mouse primary hepatocytes for analysis of temperature‐dependent AS‐decay.
Automatic cluster mapping of the temperature‐dependent splicing changes in CHX, based on changes in PSI (percent spliced in). Categories (right) were manually assigned. Here the top 1,000 events are shown, see also Fig EV1E for all events.
Examples for cold‐induced (blue) or heat‐induced (red) AS‐decay via exon inclusion or exon skipping. In each example, on top a simplified exon–intron structure is given, PTCs and the length of frameshift inducing exons are highlighted. Predicted splicing changes were validated by radioactive RT–PCR with primers binding to the surrounding constitutive exons. Box plots show median PSI of validation PCRs of four different samples from at least two different mice, whiskers show min to max. Individual data points are shown as circles. Statistical significance was determined by two‐way ANOVA and is indicated by asterisks: adjusted P values: not significant (ns), *P < 0.05, ***P < 0.001, ****P < 0.0001. See Fig EV1F and G for further examples.
Classification of temperature dependence in genes with CHX‐dependent splicing events. Number of genes and percentages are indicated.
GO‐term analysis of temperature‐controlled AS‐decay genes. All expressed genes (mean tpm > 0) served as background.

- A.
Principle component analysis of the investigated triplicate samples by RNA sequencing.
- B.
Distribution of splicing types in events identified to change after CHX treatment. AA alternative acceptor, AD alternative donor, AF alternative first exon, AL alternative last exon, CE cassette exon, RI retained intron, TE transcription end, TS transcription start.
- C.
Overlap of genes with CHX‐dependent events identified in our study in primary mouse hepatocytes (34 and 38°C) and by Hurt et al., 2013 in embryonic stem cells (37°C).
- D.
Number of alternative cassette exons that have a stop codon included, grouped by whether and how the exons are alternatively spliced upon CHX treatment. ****P < 0.0001, Chi‐square test.
- E.
Automatic cluster mapping of temperature‐dependent splicing changes in CHX, based on PSI (percent spliced in). All events with |ΔPSI| > 0.15 and P > 0.85 between CHX 34 and 38°C are shown. N = 4,740.
- F, G.
In F, examples for heat‐skipped (white) or cold‐skipped (gray) splicing events. Note that these splicing events are barely affected by CHX. In G, further examples for cold‐induced (blue) or heat‐induced (red) AS‐decay events. Box plots show median PSI of validation PCRs of four different samples from at least two different mice, whiskers show min to max. Individual data points are shown as circles. Statistical significance was determined by two‐way ANOVA and is indicated by asterisks: adjusted P values: not significant (ns), *P < 0.05, **P < 0.01, ***P < 0.001, ****P < 0.0001.
- H.
Comparison of temperature‐regulated AS events predicted by Whippet RNA‐Seq analysis and validated by RT–PCR from independent samples. The line depicts linear regression; goodness of fit is indicated by R 2.
- I.
Comparison of splicing changes in CHX (x‐axis) and DMSO (y‐axis) for all events presented in EV1E. The line depicts linear regression, goodness of fit is indicated by R 2, N = 4,740. The P value represents statistical probability of the slope being different from 0. Splicing changes in DMSO and CHX have the same directionality but ΔPSI values are generally larger in CHX.
- J.
Temperature dependence of the strongest decay events (top 500, largest ΔPSI in either 34 or 38°C comparison of DMSO vs CHX). Categories (right) were manually assigned. We define four categories: (i) cold‐induced decay, (ii) heat‐induced decay, (iii) temperature‐independent decay, and (iv) CHX‐sensitive temperature‐dependent splicing events. The generation of these isoforms could depend on de novo protein synthesis.

- A.
Temperature‐dependent poison events in Hnrnpdl (left, see also Fig 1C), Hnrnph3 (middle), and Cirbp (right). For each target, on top a simplified exon–intron structure is given and below Sashimi plots show the distribution of raw sequencing reads. Exon–exon junction reads are indicated by the numbers connecting the exons. Below, sequence conservation across placental species is indicated. Hnrnpdl exhibits a heat‐included exon that leads to a PTC, Hnrnph3 a cold‐skipped exon that leads to a frameshift, and in Cirbp, heat leads to inclusion of an alternative transcript end, which leads to formation of a PTC.
- B.
For each gene from A, the triplicate normalized read counts in DMSO (left y‐axis, green) and the percentage of the poison isoform in CHX (right y‐axis, orange) are plotted at the two temperatures. Line represents mean PSI.
- C.
Correlation of poison isoform inclusion and GE levels for all RBPs with temperature‐dependent AS‐decay skipped exon events. Shown are the log2 fold change (FC) in GE vs the ΔPSI of the poison isoform between the CHX samples. Top shows the GE change between the DMSO samples and bottom between the CHX samples. R 2 and P (deviation from zero slope) are indicated. N = 24.
- D.
GFP splicing reporter. The GFP encoding sequence is interrupted by an intron and contains destabilizing mRNA (AU‐rich) and protein (PEST) elements (based on a luciferase reporter by (Younis et al., 2010)). Insertion of an alternative exon makes GFP expression splicing‐dependent, as exon inclusion (with or without a STOP, red asterisks) abolishes the GFP signal (see Fig EV2B).
- E.
Splicing reporters, containing only an intron (GFP ctrl, #1) or additionally temperature‐dependent exons with ~ 1 kB surrounding introns. Representative radioactive RT–PCRs (bottom) confirm cold‐induced inclusion of Ythdf3 exon 7 (#2) and human Synerg exon 21 (#3) after 24 h at the indicated temperatures. Representative images are derived from three independent gels. See SourceDataForFigure2E for uncropped versions of these gels.
- F–G.
GFP expression was quantified using FACS and is shown relative to GFP ctrl. In (F) transfected cells were incubated at the indicated temperatures for 24 h (n = 3, mean ± SD). In (G) cells were incubated directly after transfection for 12 h at 39°C (blue) or 33°C (red) and then shifted for 2, 4, 8 and 12 h (n = 3, mean ± SD).

Global correlation of poison isoform inclusion and GE levels for all genes with temperature‐dependent AS‐decay skipped exon events. Shown are the log2 fold change (FC) in GE vs the ΔPSI of the poison isoform between the CHX samples. Left shows the GE change between the DMSO samples and right the between the CHX samples at the two temperatures. R 2 and P (deviation from zero slope) are indicated, N = 254.
Exon inclusion abolishes the GFP signal. Replacing the central 27 nucleotides of exon 7 in the Ythdf3 reporter (GFP Ythdf3 b‐GLO, #4) results in almost complete exon inclusion (RT–PCR, bottom right). A cytometric analysis comparing this mutant (#4, > 95% exon inclusion) and the GFP ctrl (#1, almost complete skipping) confirms that exon inclusion abolishes the GFP signal.

Comparing temperature‐dependent AS‐decay (ΔPSI of 38–34°C in CHX) of SR proteins in primary mouse hepatocytes. The poison event in Srsf1 (*) escaped the computational analysis; data are derived from radioactive RT–PCR.
Validation of Srsf2 temperature‐dependent AS‐decay by radioactive RT–PCR as described in Fig 1C. Box plots show median PSI of validation PCRs of four different samples from at least two different mice; whiskers show min to max. Individual data points are shown as circles. Statistical significance was determined by two‐way ANOVA and is indicated by asterisks: adjusted P values: not significant (ns), ***P < 0.001, ****P < 0.0001.
Validation of Srsf10 temperature‐dependent AS‐decay by radioactive RT–PCR as described in A. Box plots show median PSI of validation PCRs of four different samples from at least two different mice; whiskers show min to max. Individual data points are shown as circles. Statistical significance was determined by two‐way ANOVA and is indicated by asterisks: adjusted P values: not significant (ns), *P < 0.05, **P < 0.01, ****P < 0.0001.
Sashimi plots for SRSF2 (top) and SRSF10 (bottom) confirming increased poison exon inclusion upon SMG6/SMG7 double KD (light gray) compared to control (black).
Heatmap for SR protein expression in D. melanogaster. Normalized mean GE in ovaries kept at 18 or 29°C (n = 2, (Fast et al, 2017)) is shown for each SR protein. Note cold‐induced expression of the SRSF2 homolog SC35.
Sashimi plots indicating heat‐induced (red, top) or cold‐induced (blue, bottom) generation of a low‐abundance splicing isoform in cold‐induced Rbp1‐like (top) or heat‐induced Rbp1 (bottom).

SR protein specific temperature‐dependent AS‐decay. Sashimi plots are shown for heat‐induced poison exon inclusion for Srsf2 (left) and cold‐induced poison isoform formation for Srsf10 (right). Quantification of GE and AS are presented in the center (as in Fig 2B), lines represent mean.
Poison exon inclusion for Srsf2 (left) and Srsf10 (right) in a 24 h temperature rhythm in human cells. Hek293 cells were pre‐entrained with square‐wave temperature cycles (12 h 34°C/12 h 38°C) for 48 h. For the last 24 h, cells were treated with DMSO or CHX every 4 h and harvested after 4 h and analyzed by splicing sensitive RT–PCR (n = 3, mean ± SD). White area: 34°C; Red area: 38°C. In Hek293 cells, inclusion of Srsf10 exon 3 is coupled to polyadenylation making it a weak decay target.
AS‐decay of human targets at 34°C (blue) and 38°C (red) was investigated after a square‐wave temperature regime (see B). RNAs were harvested after 56 and 68 h, respectively (n = 3, mean ± SD). Statistical significance was determined by two‐way ANOVA and is indicated by asterisks: adjusted P values: not significant (ns), **P < 0.01, ***P < 0.001, ****P < 0.0001.
Intron conservation of alternative cassette exons. Shown are average placental conservation scores of introns surrounding all alternative exons (black, N = 46,901), AS‐decay exons (yellow, N = 453) and temperature‐regulated AS‐decay exons (green, N = 139).
Quantification of Srsf2 AS‐decay in hamster, rabbit, and chicken cells (n = 2, mean ± SD). Statistical significance was determined by two‐way ANOVA, *P < 0.05, **P < 0.01, ***P < 0.001, ****P < 0.0001.

- A.
WT Hek293 and cell lines lacking either Srsf2 or Srsf10 exon 3 (Δpoison exon) through CRISPR/Cas9‐mediated genome editing (see also Fig EV4) were temperature entrained at three consecutive days of square‐wave temperature rhythm (12 h at 34 and 38°C, respectively). Time points of harvest are indicated by arrows.
- B, C.
Rhythmic Srsf2 (B) and Srsf10 (C) productive mRNA levels (relative to Gapdh) were analyzed by RT–qPCR. For each clone, expression is normalized to time point 52 h, (B) n = 3, (C) n = 4, mean ± SEM. For Srsf10 two independently generated clones were investigated (ΔE3 A and B). Statistical significance was determined by unpaired t‐test and is indicated by asterisks: P values: **P < 0.01, ****P < 0.0001.
- D, E.
Comparing temperature‐induced expression of the core clock components Bmal1 (D) and Per1 (E) in WT and Srsf10 ΔE3 cells (relative to Gapdh, normalized to time point 52 h). Statistical significance was determined by unpaired t‐test and is indicated by asterisks: P values: *P < 0.05, ***P < 0.001, ****P < 0.0001. n = 3, mean ± SEM.

- A, B.
CRISPR/Cas9 strategy for cell lines lacking poison exons for Srsf2 (A) and Srsf10 (B). Lack of poison exons in clonal Srsf2 CRISPR/Cas9‐edited cell lines was confirmed by splicing sensitive RT–PCR (bottom). WT and mutant cell lines were treated with DMSO or CHX at 38°C and inclusion of the poison isoform was investigated by splicing sensitive RT–PCR (A). Investigation of Srsf10 dn‐E3 splicing in samples from Fig 4C. AS was analyzed by RT–PCR. A Gapdh PCR was performed simultaneously and served as a loading control. A representative gel image is shown. The asterisk indicates an unspecific product.

Normalized GE values of plant SR proteins in a 48‐h time course. In the first day, plants were kept at 20°C (red) and shifted to 4°C (blue) for the second day. Plants were under a 12‐h dark/light regimen (gray/yellow bars). Warm‐ and cold‐expressed genes are indicated.
Arabidopsis thaliana SR proteins divided in their subfamilies and classified as warm‐ or cold‐expressed.
Sashimi plots as shown in Fig 2A (without conservation score) for decay‐inducing AS events upon cold (At‐SCL33, left) or warm temperature (At‐SR34, right). Data shown represent, from top to bottom, warm‐dark, warm‐light, cold‐dark, and cold‐light conditions as indicated on the right of the plots.
For validation, A. thaliana were incubated for 3 days either at 20 or 4°C and RNA was investigated for gene expression (green, left y‐axis) and poison isoform formation (orange, right y‐axis). Gene expression of At‐SCL33 (left) or At‐SR34 (right) is shown relative to Ipp2. Lines represent mean, and individual data points are shown.
Correlation of poison isoform inclusion and GE levels for temperature‐dependent poison skipped exon events. Shown are the log2 fold change (FC) in GE vs the ΔPSI of the poison isoform. Decay targets were identified by using data from CHX‐treated plants. R 2 and P (deviation from zero slope) are indicated. N = 80 (see main text and Materials and Methods for details).
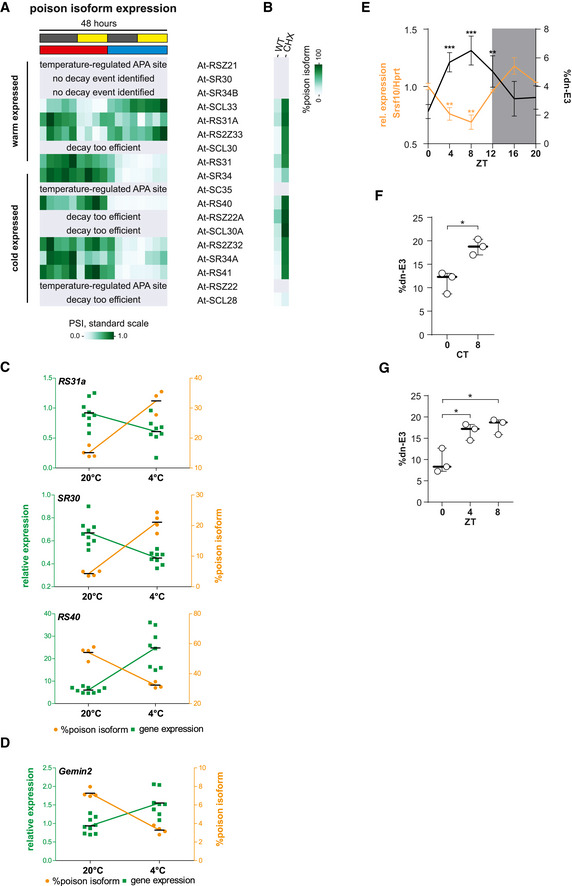
Normalized poison isoform expression of plant SR proteins as in Fig 5A. In this dataset, without inhibition of decay pathways, the identification of poison isoforms is likely incomplete (compare to B). In three cases, a clear temperature‐regulated alternative polyadenylation (APA) event occurred but was not quantified (also indicating a post‐transcriptional origin of temperature‐dependent GE). In two cases, no poison event could be identified. Four times decay seemed to be too efficient, as no poison isoform could be identified without CHX treatment.
Poison isoform inclusion in WT‐ or CHX‐treated plants for the same genes as in A. Here, the amount of the respective isoforms was compared in control and CHX‐treated samples (based on another RNA‐Seq dataset (Drechsel et al., 2013), see Table EV1). Note that most temperature‐dependent isoforms from A are stabilized upon CHX treatment.
Validation RT–PCRs and qPCRs of poison events in further plant SR proteins as shown in Fig 5D. For each case, poison isoform inclusion correlates with lower GE. Lines represents mean.
Validation of an AS‐decay event in GEMIN2, in which cold‐induced inclusion of the poison isoform correlates with lower GE. Lines represents mean.
Correlation of rhythmic productive Srsf10 mRNA expression (orange, left y‐axis) and exon 3 inclusion (black, right y‐axis) in mouse cerebellum samples from the indicated ZTs. Splicing was analyzed using radioactive RT–PCR of at least three mice per time point. Expression was determined by RT–qPCR and is shown relative to Hprt and ZT0 (mean of at least three mice ± SEM). Student's unpaired t‐test‐derived P values **P < 0.01, ***P < 0.001 indicate difference from ZT0.
Rhythmic Srsf10 AS persists in constant darkness. Mice were kept in constant darkness for 24 h and sacrificed at the indicated circadian times (CTs) of the following subjective day. RT–PCR analysis as in A (n = 3, median ± min to max). Student's unpaired t‐test‐derived P values *P < 0.05.
Entrained Srsf10 AS. Mice were 8‐h phase delayed and sacrificed at the indicated ZTs on the 4th day. RT–PCR analysis as in A (n = 3, median ± min to max). Student's unpaired t‐test‐derived P values *P < 0.05.
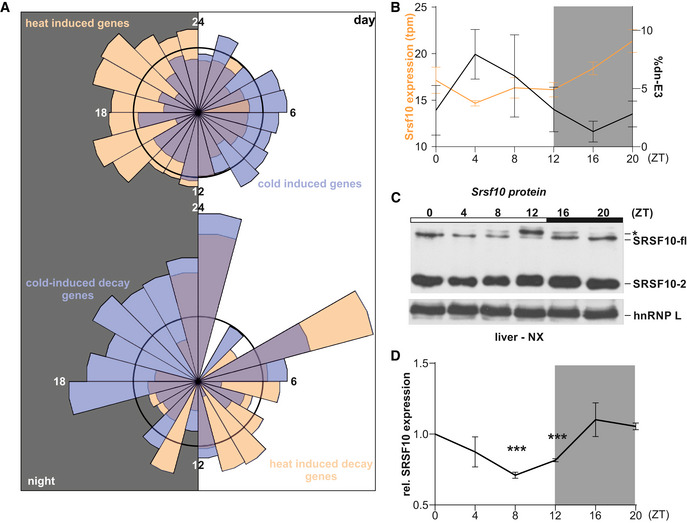
Top: Rose plot visualizing the acrophases (based on rhythmic genes in the liver transcriptome from (Atger et al., 2015)) of genes exhibiting heat‐induced (orange, n = 797) and cold‐induced (blue, n = 828) upregulation of GE in mouse hepatocytes, respectively. Bottom: Acrophases of genes with cold‐induced (blue, n = 55) and heat‐induced (orange, n = 47) poison exon events, respectively. Numbers indicate respective ZT, with the left half representing night (at which mice are active and have an elevated body temperature) and the right half representing day (at which mice are asleep with lower body temperature). The black circles represent expected normal distribution if data would be randomly sampled.
Correlation of rhythmic Srsf10 expression (orange, left y‐axis) and exon 3 inclusion (black, right y‐axis) in mouse liver samples from the indicated ZTs (n = 4, mean ± SEM). Quantifications were obtained by RNA‐Seq analysis of datasets from (Atger et al., 2015).
Representative Western blot of SRSF10 protein levels from mouse liver nuclear extracts (NX) from different ZTs. The different SRSF10 variants are highlighted on the right. SRSF10‐fl and SRSF10‐2 are the result of differential last exon usage. hnRNP L was used as a loading control. The asterisks could represent hyperphosphorylated SRSF10‐fl through higher CLK activity during the day.
Quantification of SRSF10‐fl + SRSF10‐2 relative to ZT0 and hnRNP L (mean of at least 3 mice ± SEM). Student's unpaired t‐test‐derived P values ***P < 0.001.

Similar articles
-
Systematic discovery of regulated and conserved alternative exons in the mammalian brain reveals NMD modulating chromatin regulators.Proc Natl Acad Sci U S A. 2015 Mar 17;112(11):3445-50. doi: 10.1073/pnas.1502849112. Epub 2015 Mar 3. Proc Natl Acad Sci U S A. 2015. PMID: 25737549 Free PMC article.
-
Alternative splicing and nonsense-mediated decay of circadian clock genes under environmental stress conditions in Arabidopsis.BMC Plant Biol. 2014 May 19;14:136. doi: 10.1186/1471-2229-14-136. BMC Plant Biol. 2014. PMID: 24885185 Free PMC article.
-
Regulation of splicing factors by alternative splicing and NMD is conserved between kingdoms yet evolutionarily flexible.Mol Biol Evol. 2015 Apr;32(4):1072-9. doi: 10.1093/molbev/msv002. Epub 2015 Jan 8. Mol Biol Evol. 2015. PMID: 25576366 Free PMC article.
-
Perspective in Alternative Splicing Coupled to Nonsense-Mediated mRNA Decay.Int J Mol Sci. 2020 Dec 10;21(24):9424. doi: 10.3390/ijms21249424. Int J Mol Sci. 2020. PMID: 33321981 Free PMC article. Review.
-
Alternative splicing and nonsense-mediated mRNA decay enforce neural specific gene expression.Int J Dev Neurosci. 2016 Dec;55:102-108. doi: 10.1016/j.ijdevneu.2016.03.003. Epub 2016 Mar 8. Int J Dev Neurosci. 2016. PMID: 26968265 Free PMC article. Review.
Cited by
-
Alternative Splicing in the Regulatory Circuit of Plant Temperature Response.Int J Mol Sci. 2023 Feb 15;24(4):3878. doi: 10.3390/ijms24043878. Int J Mol Sci. 2023. PMID: 36835290 Free PMC article. Review.
-
Thermoregulated transcriptomics: the molecular basis and biological significance of temperature-dependent alternative splicing.Biochem J. 2024 Aug 7;481(15):999-1013. doi: 10.1042/BCJ20230410. Biochem J. 2024. PMID: 39083035 Free PMC article. Review.
-
Nonsense-mediated mRNA decay pathway in plants under stress: general gene regulatory mechanism and advances.Planta. 2024 Jan 30;259(3):51. doi: 10.1007/s00425-023-04317-7. Planta. 2024. PMID: 38289504 Review.
-
Regulatory interplay between SR proteins governs CLK1 kinase splice variants production.RNA. 2024 Nov 18;30(12):1596-1607. doi: 10.1261/rna.080107.124. RNA. 2024. PMID: 39251328 Free PMC article.
-
An autoregulatory poison exon in Smndc1 is conserved across kingdoms and influences organism growth.PLoS Genet. 2024 Aug 16;20(8):e1011363. doi: 10.1371/journal.pgen.1011363. eCollection 2024 Aug. PLoS Genet. 2024. PMID: 39150991 Free PMC article.
References
-
- Bejerano G, Pheasant M, Makunin I, Stephen S, Kent WJ, Mattick JS, Haussler D (2004) Ultraconserved elements in the human genome. Science (New York, NY) 304: 1321–1325 - PubMed
Publication types
MeSH terms
Associated data
- Actions
Grants and funding
LinkOut - more resources
Full Text Sources
Other Literature Sources
Molecular Biology Databases
Research Materials
