. 2020 Dec 15:409:115300.
doi: 10.1016/j.taap.2020.115300. Epub 2020 Oct 22.

Biological effects of inhaled hydraulic fracturing sand dust VII. Neuroinflammation and altered synaptic protein expression

Affiliations

Biological effects of inhaled hydraulic fracturing sand dust VII. Neuroinflammation and altered synaptic protein expression

Krishnan Sriram et al. Toxicol Appl Pharmacol. .

Abstract

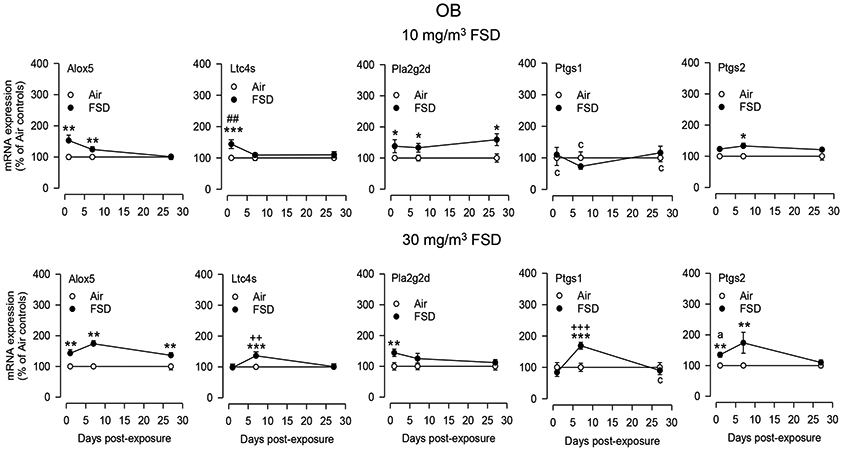
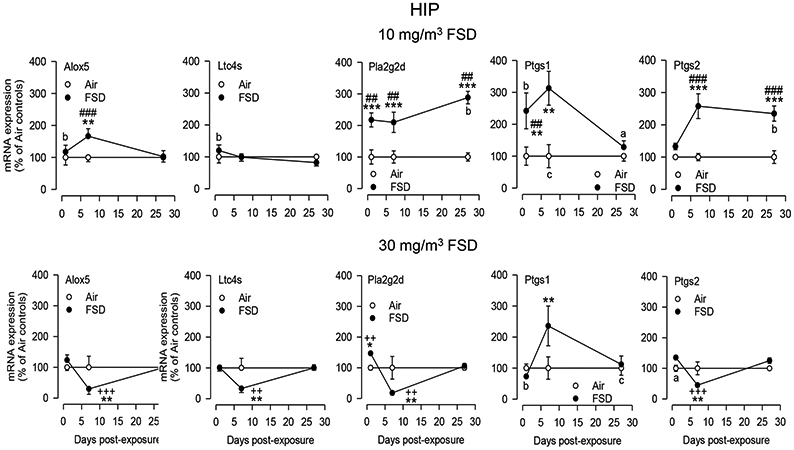
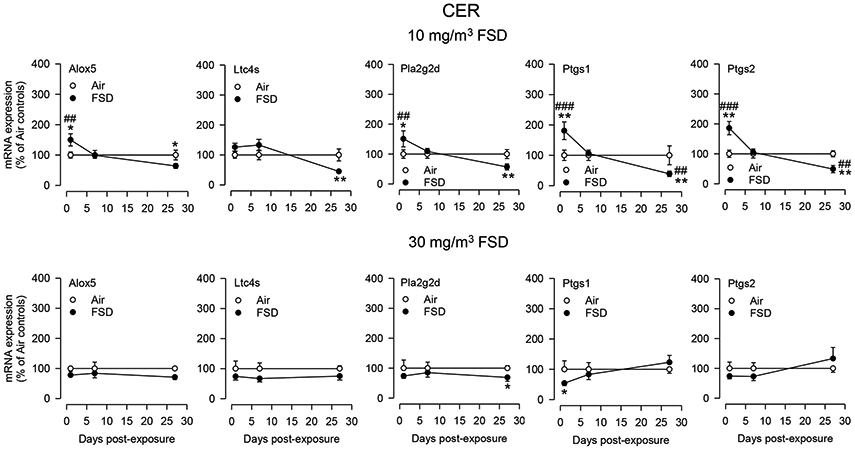
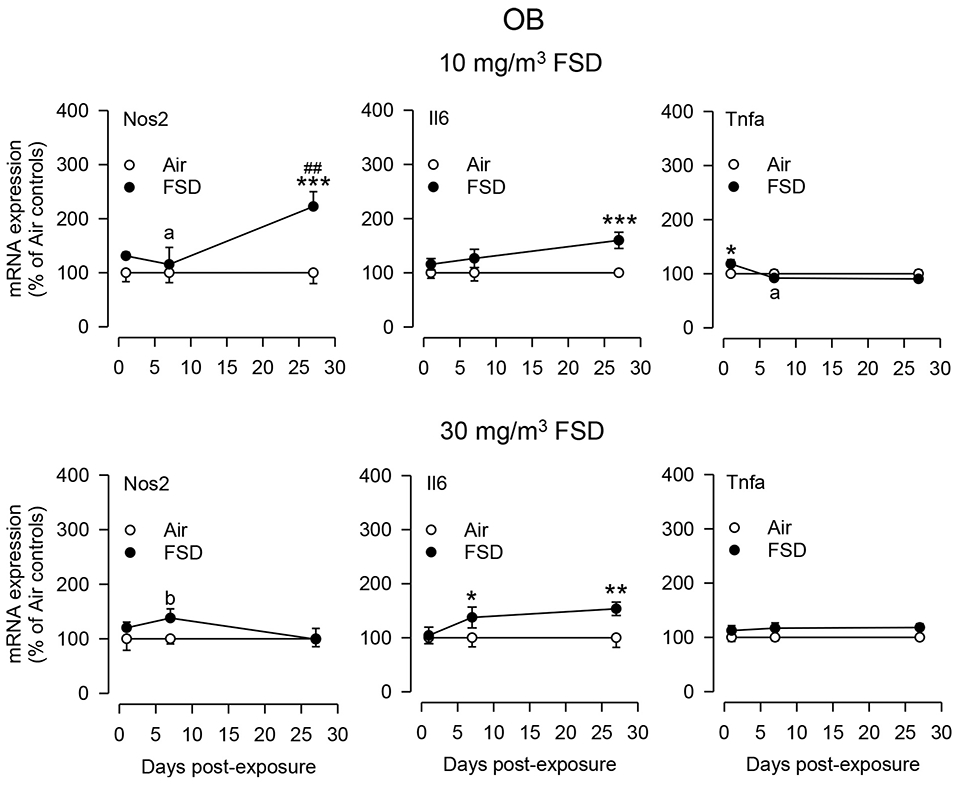
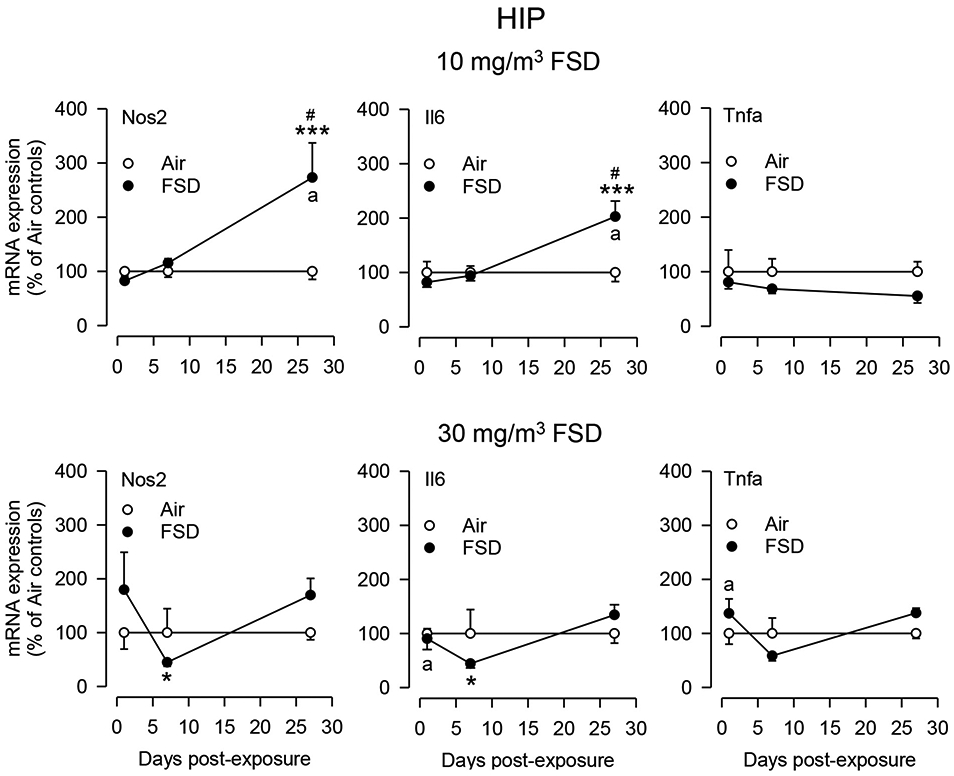
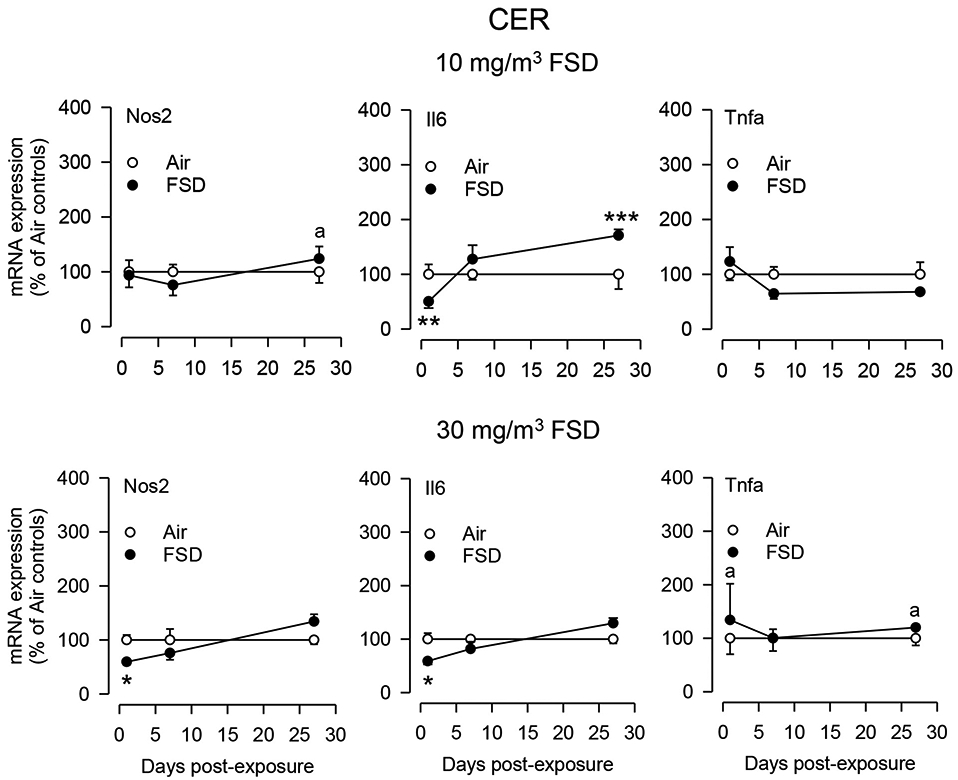
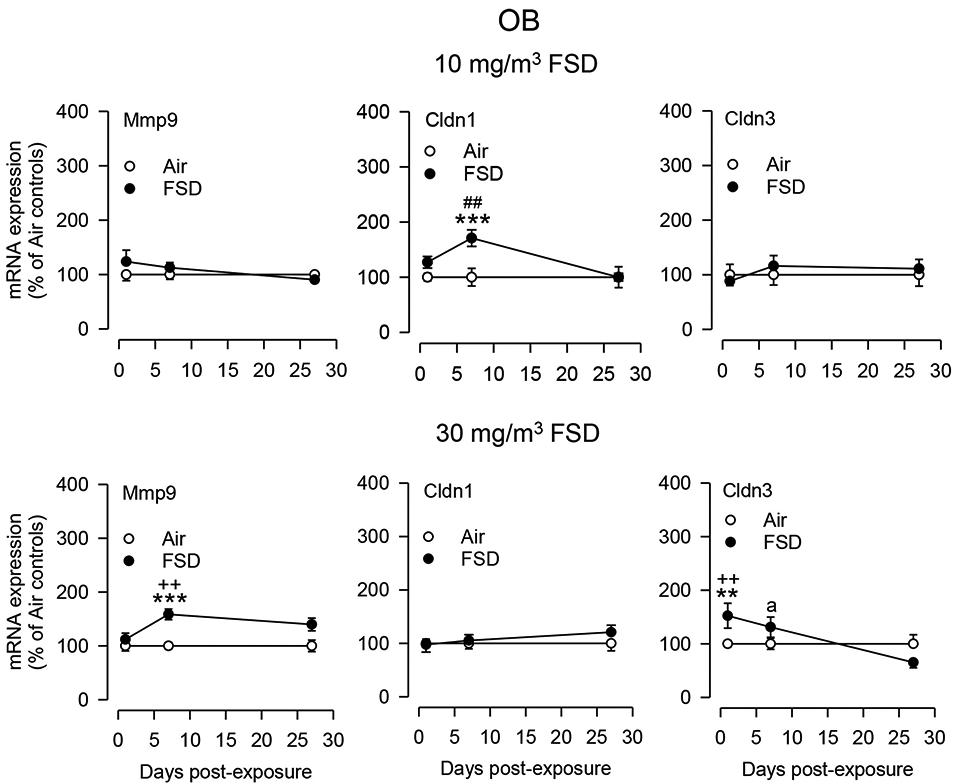
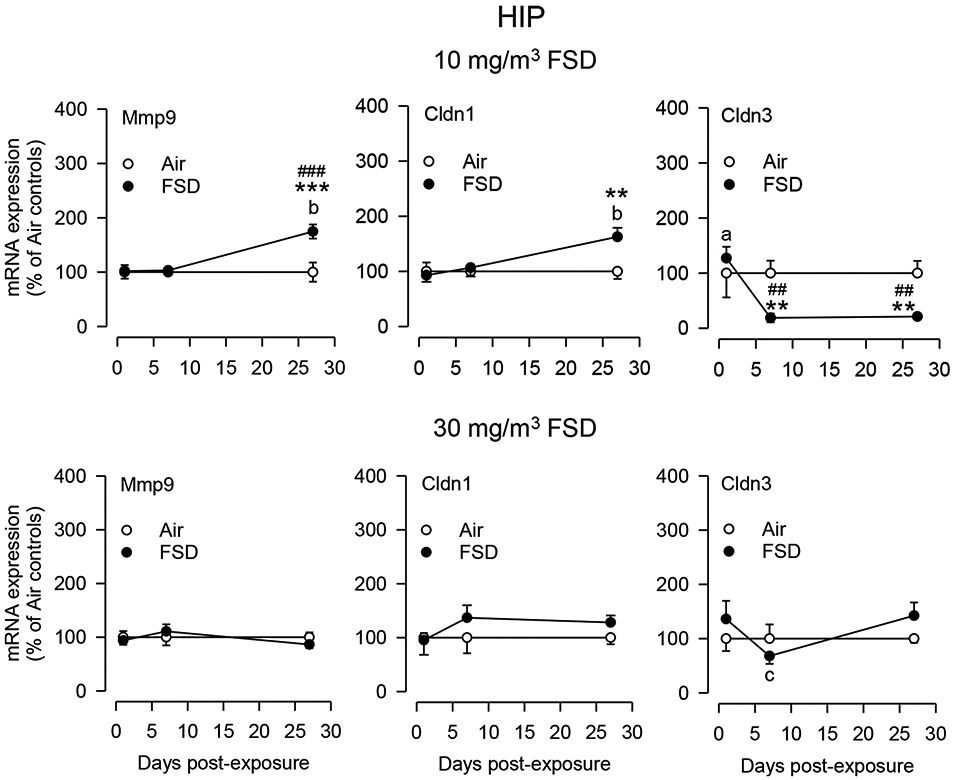
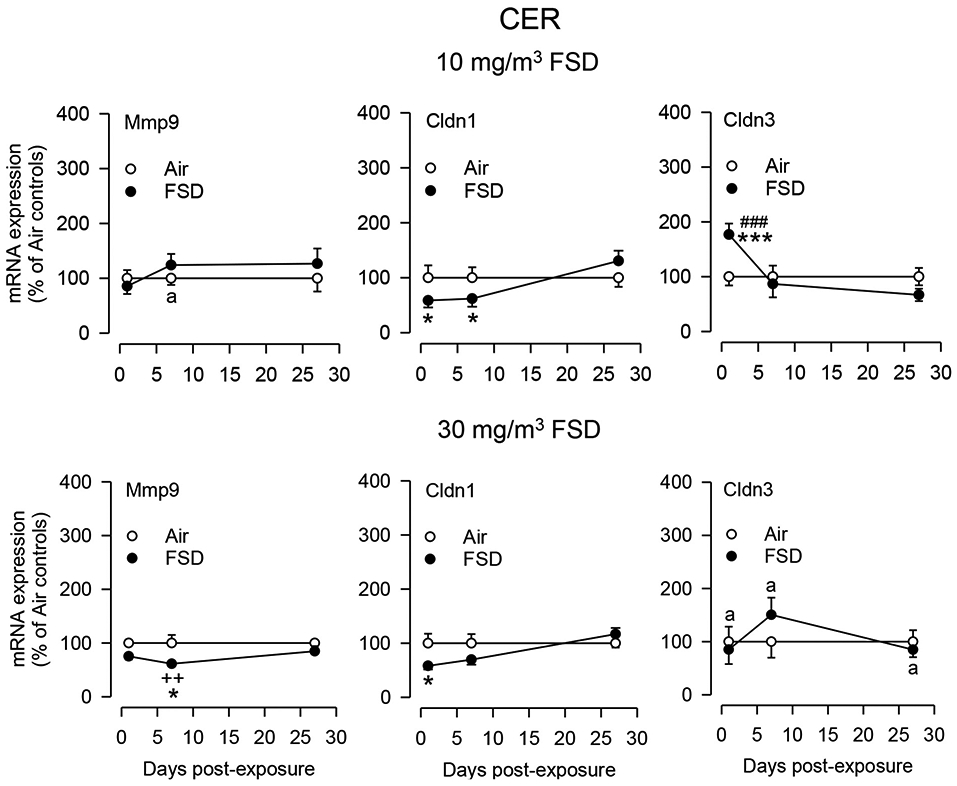
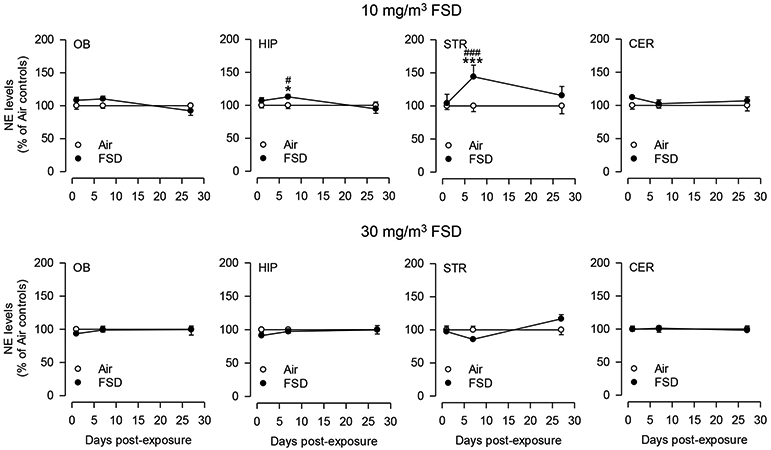
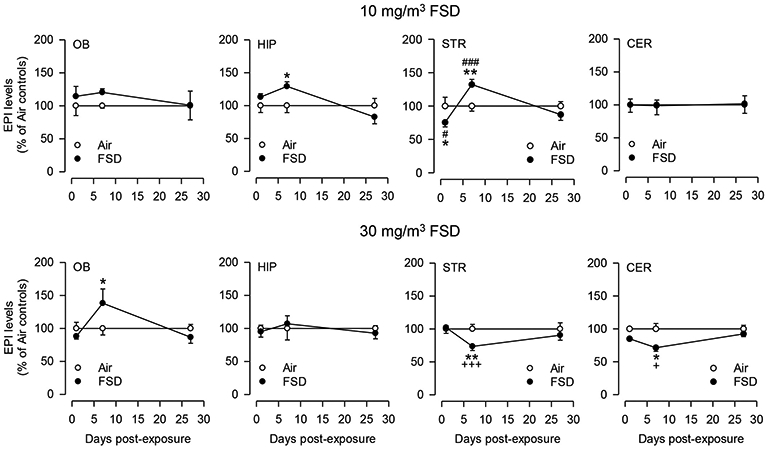
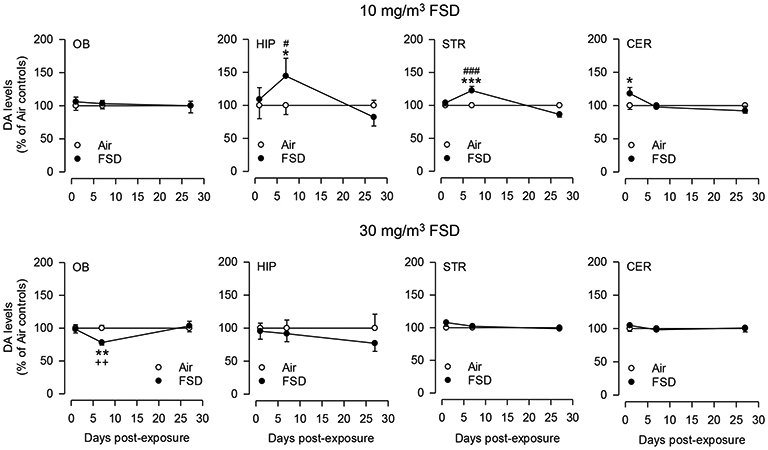
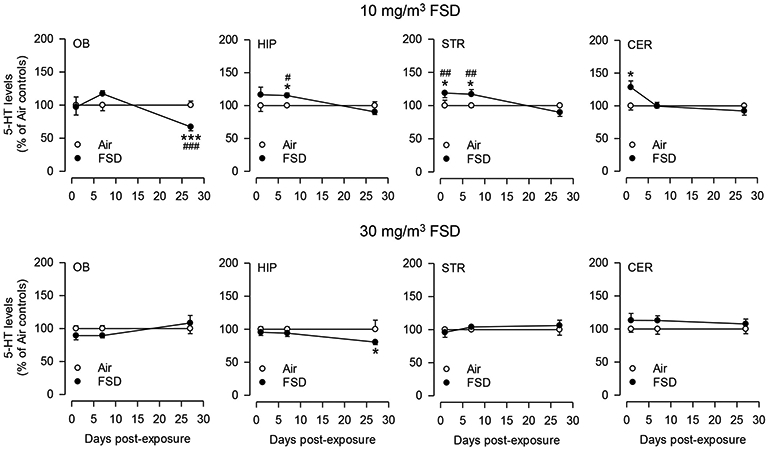
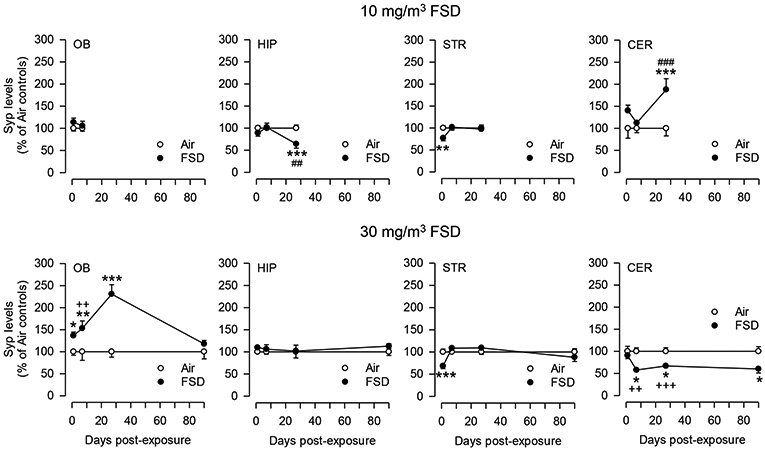
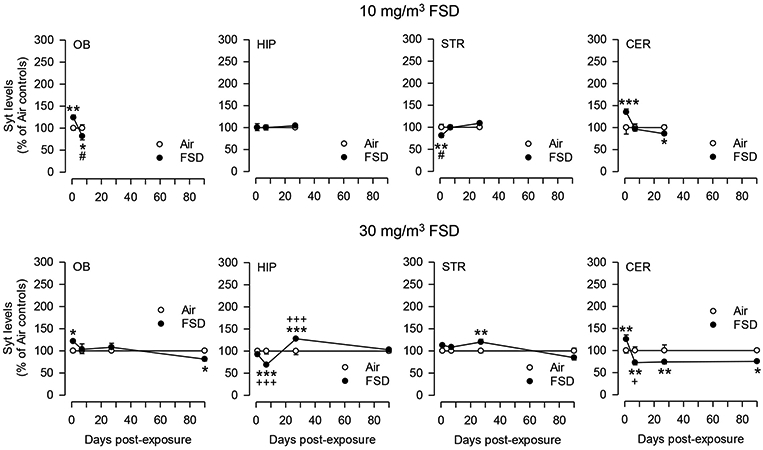
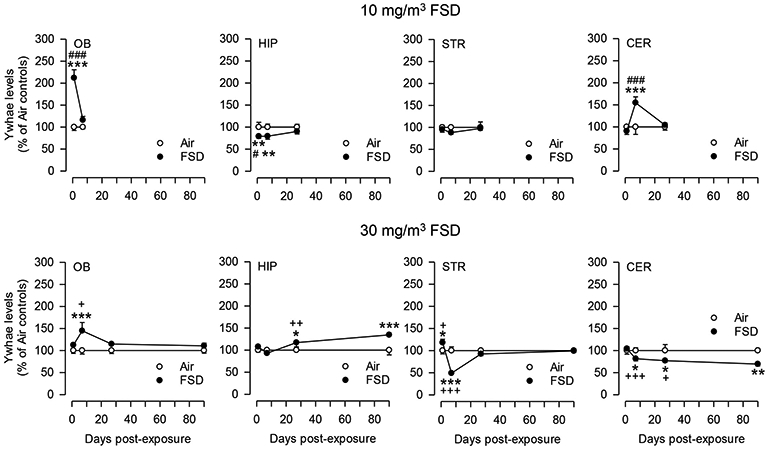
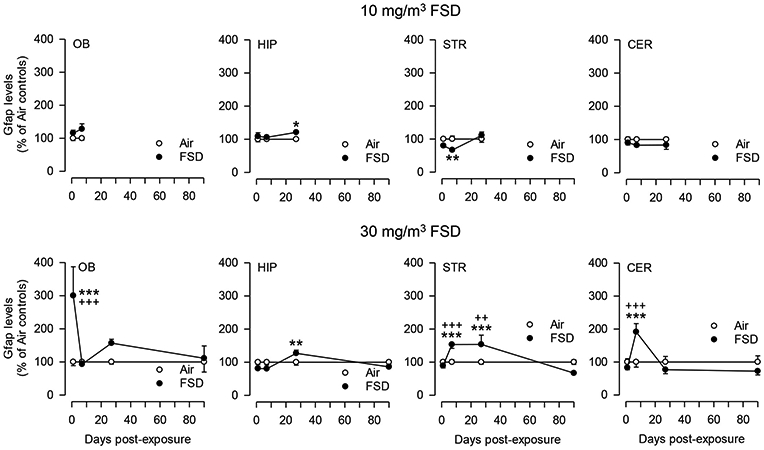
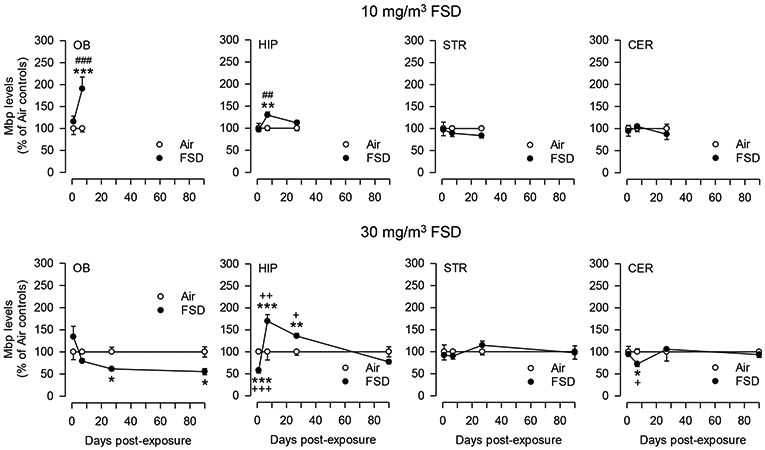
Hydraulic fracturing (fracking) is a process used to recover oil and gas from shale rock formation during unconventional drilling. Pressurized liquids containing water and sand (proppant) are used to fracture the oil- and natural gas-laden rock. The transportation and handling of proppant at well sites generate dust aerosols; thus, there is concern of worker exposure to such fracking sand dusts (FSD) by inhalation. FSD are generally composed of respirable crystalline silica and other minerals native to the geological source of the proppant material. Field investigations by NIOSH suggest that the levels of respirable crystalline silica at well sites can exceed the permissible exposure limits. Thus, from an occupational safety perspective, it is important to evaluate the potential toxicological effects of FSD, including any neurological risks. Here, we report that acute inhalation exposure of rats to one FSD, i.e., FSD 8, elicited neuroinflammation, altered the expression of blood brain barrier-related markers, and caused glial changes in the olfactory bulb, hippocampus and cerebellum. An intriguing observation was the persistent reduction of synaptophysin 1 and synaptotagmin 1 proteins in the cerebellum, indicative of synaptic disruption and/or injury. While our initial hazard identification studies suggest a likely neural risk, more research is necessary to determine if such molecular aberrations will progressively culminate in neuropathology/neurodegeneration leading to behavioral and/or functional deficits.

Keywords: Aluminum Silicates; Fracking Sand Dust; Hydraulic Fracturing; Neurotoxicity; Occupational Hazards; Silica.


Conflict of interest statement

Declaration of Competing Interest

The authors declare that they have no known competing financial interests or personal relationships that could have appeared to influence the work reported in this paper.

Figures

Fig. 1.
Fig. 1.
Expression of arachidonic acid pathway-associated genes in the olfactory bulb (OB). (FSD 8 is abbreviated as FSD in all the figures). Rats were exposed to FSD 8 aerosol (10 or 30 mg/m3; 6 h/d × 4 d) by whole-body inhalation. At 1, 7 or 27 d post-exposure, the mRNA expression of Alox5, Ltc4s, Pla2g2d, Ptgs1 and Ptgs2 were assayed by TaqMan real-time PCR. Following normalization to the endogenous control β-actin (Actb), the change in mRNA expression was calculated as percent of air-exposed controls. n = 5–6/group. cn = 5 due to one undetected sample in assay group; *P < 0.05, **P < 0.01, ***P < 0.001. #, ## or ### indicates values significantly different from the low dose FSD 8 at P < 0.05, 0.01 or 0.001, respectively. +, ++ or +++ indicates values significantly different from low dose FSD 8 at P < 0.05, 0.01 or 0.001, respectively.
Fig. 2.
Fig. 2.
Expression of arachidonic acid pathway-associated genes in the hippocampus (HIP). Rats were exposed to FSD 8 aerosol (10 or 30 mg/m3; 6 h/d × 4 d) by whole-body inhalation. At 1, 7 or 27 d post-exposure, the mRNA expression of Alox5, Ltc4s, Pla2g2d, Ptgs1 and Ptgs2 were assayed by TaqMan real-time PCR. Following normalization to the endogenous control β-actin (Actb), the change in mRNA expression was calculated as percent of air-exposed controls. n = 4–6/group. an = 5 due to one outlier sample in assay group; bn = 4 due to two outlier sample in assay group; cn = 5 due to one undetected sample in assay group; *P < 0.05, **P < 0.01, ***P < 0.001. #, ## or ### indicates values significantly different from the high dose FSD 8 at P < 0.05, 0.01 or 0.001, respectively. +, ++ or +++ indicates values significantly different from the low dose of FSD 8 at P < 0.05, 0.01 or 0.001, respectively.
Fig. 3.
Fig. 3.
Expression of arachidonic acid pathway-associated genes in the cerebellum (CER). Rats were exposed to FSD 8 aerosol (10 or 30 mg/m3; 6 h/d × 4 d) by whole-body inhalation. At 1, 7 or 27 d post-exposure, the mRNA expression of Alox5, Ltc4s, Pla2g2d, Ptgs1 and Ptgs2 were assayed by TaqMan real-time PCR. Following normalization to the endogenous control β-actin (Actb), the change in mRNA expression was calculated as percent of air-exposed controls. n = 6/group. *P < 0.05, **P < 0.01, ***P < 0.001. #, ## or ### indicates values significantly different from the high dose FSD 8 at P < 0.05, 0.01 or 0.001, respectively. +, ++ or +++ indicates values significantly different from the low dose of FSD 8 at P < 0.05, 0.01 or 0.001, respectively.
Fig. 4.
Fig. 4.
Expression of neuroinflammatory mediators in the olfactory bulb (OB). Rats were exposed to FSD 8 aerosol (10 or 30 mg/m3; 6 h/d × 4 d) by whole-body inhalation. At 1, 7 or 27 d post-exposure, the mRNA expression of Nos2, Il6 and Tnfa were assayed by TaqMan real-time PCR. Following normalization to the endogenous control β-actin (Actb), the change in mRNA expression was calculated as percent of air-exposed controls. n = 4–6/group. an = 5 due to one outlier sample in assay group; bn = 4 due to two outlier sample in assay group; *P < 0.05, **P < 0.01, ***P < 0.001. #, ## or ### indicates values significantly different from the high dose FSD 8 at P < 0.05, 0.01 or 0.001, respectively. +, ++ or +++ indicates values significantly different from the low dose of FSD 8 at P < 0.05, 0.01 or 0.001, respectively.
Fig. 5.
Fig. 5.
Expression of neuroinflammatory mediators in the hippocampus (HIP). Rats were exposed to FSD 8 aerosol (10 or 30 mg/m3; 6 h/d × 4 d) by whole-body inhalation. At 1, 7 or 27 d post-exposure, the mRNA expression of Nos2, Il6 and Tnfa were assayed by TaqMan real-time PCR. Following normalization to the endogenous control β-actin (Actb), the change in mRNA expression was calculated as percent of air-exposed controls. n = 5-6/group. an = 5 due to one outlier sample in assay group; *P < 0.05, **P < 0.01, ***P < 0.001. #, ## or ### indicates values significantly different from the high dose FSD 8 at P < 0.05, 0.01 or 0.001, respectively. +, ++ or +++ indicates values significantly different from the low dose of FSD 8 at P < 0.05, 0.01 or 0.001, respectively.
Fig. 6.
Fig. 6.
Expression of neuroinflammatory mediators in the cerebellum (CER). Rats were exposed to FSD 8 aerosol (10 or 30 mg/m3; 6 h/d × 4 d) by whole-body inhalation. At 1, 7 or 27 d post-exposure, the mRNA expression of Nos2, Il6 and Tnfa were assayed by TaqMan real-time PCR. Following normalization to the endogenous control β-actin (Actb), the change in mRNA expression was calculated as percent of air-exposed controls. n = 5-6/group. an = 5 due to one outlier sample in assay group; *P < 0.05, **P < 0.01, ***P < 0.001. #, ## or ### indicates values significantly different from the high dose FSD 8 at P < 0.05, 0.01 or 0.001, respectively. +, ++ or +++ indicates values significantly different from the low dose of FSD 8 at P < 0.05, 0.01 or 0.001, respectively.
Fig. 7.
Fig. 7.
mRNA expression of blood-brain barrier associated markers in the olfactory bulb (OB). Rats were exposed to FSD 8 aerosol (10 or 30 mg/m3; 6 h/d × 4 d) by whole-body inhalation. At 1, 7 or 27 d post-exposure, the mRNA expression of Mmp9, Cldn1 and Cldn3 were assayed by TaqMan real-time PCR. Following normalization to the endogenous control β-actin (Actb), the change in mRNA expression was calculated as percent of air-exposed controls. n = 6/group. *P < 0.05, **P < 0.01, ***P < 0.001. #, ## or ### indicates values significantly different from the high dose FSD 8 at P < 0.05, 0.01 or 0.001, respectively. +, ++ or +++ indicates values significantly different from the low dose of FSD 8 at P < 0.05, 0.01 or 0.001, respectively.
Fig. 8.
Fig. 8.
mRNA expression of blood-brain barrier associated markers in the hippocampus (HIP). Rats were exposed to FSD 8 aerosol (10 or 30 mg/m3; 6 h/d × 4 d) by whole-body inhalation. At 1, 7 or 27 d post-exposure, the mRNA expression of Mmp9, Cldn1 and Cldn3 were assayed by TaqMan real-time PCR. Following normalization to the endogenous control β-actin (Actb), the change in mRNA expression was calculated as percent of air-exposed controls. n = 4–6/group. bn = 4 due to two outlier sample in assay group; *P < 0.05, **P < 0.01, ***P < 0.001. #, ## or ### indicates values significantly different from the low dose of FSD 8 at P < 0.05, 0.01 or 0.001, respectively. +, ++ or +++ indicates values significantly different from low dose FSD 8 at P < 0.05, 0.01 or 0.001, respectively.
Fig. 9.
Fig. 9.
mRNA expression of blood-brain barrier associated markers in the cerebellum (CER). Rats were exposed to FSD 8 aerosol (10 or 30 mg/m3; 6 h/d × 4 d) by whole-body inhalation. At 1, 7 or 27 d post-exposure, the mRNA expression of Mmp9, Cldn1 and Cldn3 were assayed by TaqMan real-time PCR. Following normalization to the endogenous control β-actin (Actb), the change in mRNA expression was calculated as percent of air-exposed controls. n = 5-6/group. an = 5 due to one outlier sample in assay group; *P < 0.05, **P < 0.01, ***P < 0.001. #, ## or ### indicates values significantly different from the high dose FSD 8 at P < 0.05, 0.01 or 0.001, respectively. +, ++ or +++ indicates values significantly different from the low dose of FSD 8 at P < 0.05, 0.01 or 0.001, respectively.
Fig. 10.
Fig. 10.
Changes in the levels of norepinephrine in various brain regions. Rats were exposed to FSD 8 aerosol (10 or 30 mg/m3; 6 h/d × 4 d) by whole-body inhalation. At 1, 7 or 27 d post-exposure, the levels of norepinephrine (NE) were measured by HPLC-EC in the olfactory bulb (OB), hippocampus (HIP), striatum (STR) and cerebellum (CER). Following normalization to an internal standard, the neurotransmitter content was calculated using a standard curve. Values are expressed as percent of air-exposed controls. n = 7–8/group). *P < 0.05, **P < 0.01, ***P < 0.001. #, ## or ### indicates values significantly different from the high dose FSD 8 at P < 0.05, 0.01 or 0.001, respectively. +, ++ or +++ indicates values significantly different from the low dose of FSD 8 at P < 0.05, 0.01 or 0.001, respectively.
Fig. 11.
Fig. 11.
Changes in the levels of epinephrine in various brain regions. Rats were exposed to FSD 8 aerosol (10 or 30 mg/m3; 6 h/d × 4 d) by whole-body inhalation. At 1, 7 or 27 d post-exposure, the levels of epinephrine (EPI) were measured by HPLC-EC in the olfactory bulb (OB), hippocampus (HIP), striatum (STR) and cerebellum (CER). Following normalization to an internal standard, the neurotransmitter content was calculated using a standard curve. Values are expressed as percent of air-exposed controls. n = 8/group. *P < 0.05, **P < 0.01, ***P < 0.001. #, ## or ### indicates values significantly different from the high dose FSD 8 at P < 0.05, 0.01 or 0.001, respectively. +, ++ or +++ indicates values significantly different from the low dose of FSD 8 at P < 0.05, 0.01 or 0.001, respectively.
Fig. 12.
Fig. 12.
Changes in the levels of dopamine in various brain regions. Rats were exposed to FSD 8 aerosol (10 or 30 mg/m3; 6 h/d × 4 d) by whole-body inhalation. At 1, 7 or 27 d post-exposure, the levels of dopamine (DA) were measured by HPLC-EC in the olfactory bulb (OB), hippocampus (HIP), striatum (STR) and cerebellum (CER). Following normalization to an internal standard, the neurotransmitter content was calculated using a standard curve. Values are expressed as percent of air-exposed controls. n = 8/group. *P < 0.05, **P < 0.01, ***P < 0.001. #, ## or ### indicates values significantly different from the high dose FSD 8 at P < 0.05, 0.01 or 0.001, respectively. +, ++ or +++ indicates values significantly different from the low dose of FSD 8 at P < 0.05, 0.01 or 0.001, respectively.
Fig. 13.
Fig. 13.
Changes in the levels of serotonin in various brain regions. Rats were exposed to FSD 8 aerosol (10 or 30 mg/m3; 6 h/d × 4 d) by whole-body inhalation. At 1, 7 or 27 d post-exposure, the levels of serotonin (5-HT) were measured by HPLC-EC in the olfactory bulb (OB), hippocampus (HIP), striatum (STR) and cerebellum (CER). Following normalization to an internal standard, the neurotransmitter content was calculated using a standard curve. Values are expressed as percent of air-exposed controls. n = 7–8/group. *P < 0.05, **P < 0.01, ***P < 0.001. #, ## or ### indicates values significantly different from the high dose FSD 8 at P < 0.05, 0.01 or 0.001, respectively. +, ++ or +++ indicates values significantly different from the low dose of FSD 8 at P < 0.05, 0.01 or 0.001, respectively.
Fig. 14.
Fig. 14.
Levels of synaptophysin-1 protein in various brain regions. Rats were exposed to FSD 8 aerosol (10 or 30 mg/m3; 6 h/d × 4 d) by whole-body inhalation. At 1, 7, 27 or 90 d post-exposure, the protein expression of synaptophysin-1 (SYP) was determined by western immunoblotting in the olfactory bulb (OB), hippocampus (HIP), striatum (STR) and cerebellum (CER). Following normalization to the endogenous control β-actin (ACTB), the change in protein expression was calculated as percent of air-exposed controls. Values are expressed as percent of air-exposed controls. n = 7–8/group. *P < 0.05, **P < 0.01, ***P < 0.001. #, ## or ### indicates values significantly different from the high dose FSD 8 at P < 0.05, 0.01 or 0.001, respectively. +, ++ or +++ indicates values significantly different from the low dose of FSD 8 at P < 0.05, 0.01 or 0.001, respectively. OB tissue from the 27-d time point of the low dose FSD 8 exposure was not collected.
Fig. 15.
Fig. 15.
Levels of synaptotagmin-1 protein in various brain regions. Rats were exposed to FSD 8 aerosol (10 or 30 mg/m3; 6 h/d × 4 d) by whole-body inhalation. At 1, 7, 27 or 90 d post-exposure, the protein expression of synaptotagmin-1 (SYT) was determined by western immunoblotting in the olfactory bulb (OB), hippocampus (HIP), striatum (STR) and cerebellum (CER). Following normalization to the endogenous control β-actin (ACTB), the change in protein expression was calculated as percent of air-exposed controls. Values are expressed as percent of air-exposed controls. n = 7–8/group. *P < 0.05, **P < 0.01, ***P < 0.001. #, ## or ### indicates values significantly different from the high dose FSD 8 at P < 0.05, 0.01 or 0.001, respectively. +, ++ or +++ indicates values significantly different from the low dose of FSD 8 at P < 0.05, 0.01 or 0.001, respectively. OB tissue from the 27-d time point of the low dose FSD 8 exposure was not collected.
Fig. 16.
Fig. 16.
Levels of tyrosine 3-monooxygenase/tryptophan 5-monooxygenase activation protein-ε–protein in various brain regions. Rats were exposed to FSD 8 aerosol (10 or 30 mg/m3; 6 h/d × 4 d) by whole-body inhalation. At 1, 7, 27 or 90 d post-exposure, the protein expression of tyrosine 3-monooxygenase/tryptophan 5-monooxygenase activation protein-14-3-3-ε (YWHAE) was determined by western immunoblotting in the olfactory bulb (OB), hippocampus (HIP), striatum (STR) and cerebellum (CER). Following normalization to the endogenous control β-actin (ACTB), the change in protein expression was calculated as percent of air-exposed controls. Values are expressed as percent of air-exposed controls. n = 7–8/group. *P < 0.05, **P < 0.01, ***P < 0.001. #, ## or ### indicates values significantly different from the high dose FSD 8 at P < 0.05, 0.01 or 0.001, respectively. +, ++ or +++ indicates values significantly different from the low dose of FSD 8 at P < 0.05, 0.01 or 0.001, respectively. OB tissue from the 27-d time point of the low dose FSD 8 exposure was not collected.
Fig. 17.
Fig. 17.
Levels of glial fibrillary acidic protein in various brain regions. Rats were exposed to FSD 8 aerosol (10 or 30 mg/m3; 6 h/d × 4 d) by whole-body inhalation. At 1, 7, 27 or 90 d post-exposure, the protein expression of glial fibrillary acidic protein (GFAP) was determined by western immunoblotting in the olfactory bulb (OB), hippocampus (HIP), striatum (STR) and cerebellum (CER). Following normalization to the endogenous control β-actin (ACTB), the change in protein expression was calculated as percent of air-exposed controls. Values are expressed as percent of air-exposed controls. n = 6–8/group. *P < 0.05, **P < 0.01, ***P < 0.001. #, ## or ### indicates values significantly different from the high dose FSD 8 at P < 0.05, 0.01 or 0.001, respectively. +, ++ or +++ indicates values significantly different from the low dose of FSD 8 at P < 0.05, 0.01 or 0.001, respectively. OB tissue from the 27-d time point of the low dose FSD 8 exposure was not collected.
Fig. 18.
Fig. 18.
Levels of myelin basic protein in various brain regions. Rats were exposed to FSD 8 aerosol (10 or 30 mg/m3; 6 h/d × 4 d) by whole-body inhalation. At 1, 7, 27 or 90 d post-exposure, the protein expression of myelin basic protein (MBP) was determined by western immunoblotting in the olfactory bulb (OB), hippocampus (HIP), striatum (STR) and cerebellum (CER). Following normalization to the endogenous control β-actin (ACTB), the change in protein expression was calculated as percent of air-exposed controls. Values are expressed as percent of air-exposed controls. n = 6–8/group. *P < 0.05, **P < 0.01, ***P < 0.001. #, ## or ### indicates values significantly different from the high dose FSD 8 at P < 0.05, 0.01 or 0.001, respectively. +, ++ or +++ indicates values significantly different from the low dose of FSD 8 at P < 0.05, 0.01 or 0.001, respectively. OB tissue from the 27-d time point of the low dose FSD 8 exposure was not collected.

References

    1. Alder J, Kanki H, Valtorta F, Greengard P, Poo MM, 1995. Overexpression of synaptophysin enhances neurotransmitter secretion at Xenopus neuromuscular synapses. J. Neurosci 15, 511–519. - PMC - PubMed
    1. Allen NJ, 2014. Astrocyte regulation of synaptic behavior. Annu. Rev. Cell Dev. Biol 30, 439–463. - PubMed
    1. Allen JL, Liu X, Weston D, Prince L, Oberdörster G, Finkelstein JN, Johnston CJ, Cory-Slechta DA, 2014. Developmental exposure to concentrated ambient ultrafine particulate matter air pollution in mice results in persistent and sex-dependent behavioral neurotoxicity and glial activation. Toxicol. Sci 140, 160–178. - PMC - PubMed
    1. Anderson SE, Shane H, Long C, Marrocco A, Lukomska E, Roberts JR, Marshall N, Fedan JS, 2020. Biological effects of inhaled hydraulic fracturing sand dust. VIII. Immunotoxicity. Toxicol Appl Pharmacol 408, 115256 10.1016/j.taap.2020.115256 (September 30, Epub ahead of print. PMID: 33007384). - DOI - PMC - PubMed
    1. Bazzoni G, Dejana E, 2004. Endothelial cell-to-cell junctions: molecular organization and role in vascular homeostasis. Physiol. Rev 84, 869–901. - PubMed

Publication types