Clinical Trial
. 2020 Nov 3;15(11):e0240898.
doi: 10.1371/journal.pone.0240898. eCollection 2020.

Chest computed tomography outcomes in a randomized clinical trial in cystic fibrosis: Lessons learned from the first ataluren phase 3 study

Affiliations
Clinical Trial

Chest computed tomography outcomes in a randomized clinical trial in cystic fibrosis: Lessons learned from the first ataluren phase 3 study

Harm A W M Tiddens et al. PLoS One. .

Abstract

A phase 3 randomized double blind controlled, trial in 238 people with cystic fibrosis (CF) and at least one nonsense mutation (nmCF) investigated the effect of ataluren on FEV1. The study was of 48 weeks duration and failed to meet its primary endpoint. Unexpectedly, while FEV1 declined, chest computed tomography (CT) scores using the Brody-II score as secondary outcome measures did not show progression in the placebo group. Based on this observation it was concluded that the role of CT scans in CF randomized clinical trials was limited. However, more sensitive scoring systems were developed over the last decade warranting a reanalysis of this unique dataset. The aim of our study was to reanalyse all chest CT scans, obtained in the ataluren phase 3 study, using 2 independent scoring systems to characterize structural lung disease in this cohort and to compare progression of structural lung disease over the 48 weeks between treatment arms. 391 study CT scans from 210 patients were reanalysed in random order by 2 independent observers using the CF-CT and Perth-Rotterdam Annotated Grid Morphometric Analysis for CF (PRAGMA-CF) scoring systems. CF-CT and PRAGMA-CF subscores were expressed as %maximal score and %total lung volume, respectively. PRAGMA-CF subscores %Disease (p = 0.008) and %Mucus Plugging (p = 0.029) progressed over 48 weeks. CF-CT subscores did not show progression. There was no difference in progression of structural lung disease between treatment arm and placebo independent of tobramycin use. PRAGMA-CF Chest CT scores can be used as an outcome measure to study the effect of potential disease modifying drugs in CF on lung structure.


Conflict of interest statement

JM worked at the time of the manuscript preparation at PTC and owns stock of PTC, he supplied us with relevant data when requested and he critically read the manuscript and gave relevant input where needed fulfilling all requirements for co-authorship. EK received a research grant through his hospital to perform the ataluren Phase III study and acted as Medical & Scientific Consulting Board member and received reimbursement for his time and for travel expenses. HT is director of the Erasmus MC LungAnalysis laboratory, he is a co-inventor of PRAGMACF which is patented. All financial aspects of the patent are handled by the Erasmus MC.

Figures
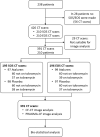
Fig 1
Fig 1
Fig 2
Fig 2
Stacked bar plots showing the wide spectrum of disease scores found by the CF-CT (A) and PRAGMA-CF scoring system (B). A. This stacked bar plot shows the distribution of the CF-CT %total score scores at start of study (SOS) for 195 patients. Patients are sorted based on the CF-CT %total score. %total score for each patient is subdivided by the subscores %Bronchiectasis, %Mucus Plugging, %Airway Wall Thickening and %Atelectasis. Note the wide distribution of %total score ranging from 0 to 37%. B. This stacked bar plot shows the distribution of the % volume of the lung at start of study (SOS) for 195 patients occupied by structural lung abnormalities as determined by PRAGMA-CF score. Patients are sorted based on the PRAGMA-CF %Disease subscore which is the sum of PRAGMA-CF %Bronchiectasis, %Mucus Plugging, and %Airway Wall Thickening. %Atelectasis (is depicted on top of %disease). Note the wide distribution of %Disease severities ranging from 0 to 35.5%.
Fig 3
Fig 3
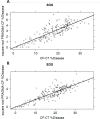
SOS (A) and EOS (B) CT scan image analysis results of %Disease subscore: CF-CT score vs. PRAGMA-CF method. This figure shows CF-CT %Disease scored by observer 1 plotted against PRAGMA-CF %Disease scored by observer 2 at the start of study (SOS, A) and at the end of study (EOS, B). The black line represents the regression line. The correlation between PRAGMA-CF and CF-CT for %Disease at SOS and EOS is 0.74 (p = <0.001).
Fig 4
Fig 4
Change of PRAGMA-CF %BE (A) and %Disease (B) from EOS to SOS per patient. These plots show the change in PRAGMA-CF %BE (A) and PRAGMA-CF %Disease (B) from start of study (SOS) to end of study (EOS). Grey open circles represent the measurements of individual patients and the grey lines are plotted between the measurements of a single patient at SOS and EOS time-point. Black solid line represents the change obtained by the linear mixed model for patients with ataluren and tobramycin treatment. Note that for other subgroups the lines would not be statistically different as there was no significant impact for any of the other investigated confounders. The dashed black lines represent the confidence interval, and the dashed red lines the prediction interval. Note that for PRAGMA-CF %Disease values are presented in the square root scale—which is the scale that was used to analyse the data as the errors for this subscore were not normal distributed. Furthermore, note that due to the large number of patients included in the figure the grey open circles might appear filled.

References

    1. de Jong PA, Nakano Y, Lequin MH, Woods R, Pare PD, Tiddens HAWM. Progressive damage on high-resolution computed tomography despite stable lung function in CF. Eur Respir J 2004: 23: 93–97. 10.1183/09031936.03.00006603 - DOI - PubMed
    1. Sanders DB, Li Z, Brody AS, Farrell PM. Chest computed tomography scores of severity are associated with future lung disease progression in children with cystic fibrosis. Am J Respir Crit Care Med 2011: 184(7): 816–821. 10.1164/rccm.201105-0816OC - DOI - PMC - PubMed
    1. Tepper LA, Caudri D, Utens EM, van der Wiel EC, Quittner AL, Tiddens HA. Tracking CF disease progression with CT and respiratory symptoms in a cohort of children aged 6–19 years. Pediatr Pulmonol 2014: 49: 1182–1189. 10.1002/ppul.22991 - DOI - PubMed
    1. Brody AS, Sucharew H, Campbell JD, Millard SP, Molina PL, Klein JS, et al. Computed Tomography Correlates with Pulmonary Exacerbations in Children with Cystic Fibrosis. Am J Respir Crit Care Med 2005: 172(9): 1128–1132. 10.1164/rccm.200407-989OC - DOI - PubMed
    1. Kerem E, Konstan MW, De Boeck K, Accurso FJ, Sermet-Gaudelus I, Wilschanski M, et al. Ataluren for the treatment of nonsense-mutation cystic fibrosis: a randomised, double-blind, placebo-controlled phase 3 trial. Lancet Respir Med 2014: 2(7): 539–547. 10.1016/S2213-2600(14)70100-6 - DOI - PMC - PubMed

Publication types