Mind the gap: What explains the poor-non-poor inequalities in severe wasting among under-five children in low- and middle-income countries? Compositional and structural characteristics
- PMID: 33141831
- PMCID: PMC7608875
- DOI: 10.1371/journal.pone.0241416
Mind the gap: What explains the poor-non-poor inequalities in severe wasting among under-five children in low- and middle-income countries? Compositional and structural characteristics
Erratum in
-
Correction: Mind the gap: What explains the poor-non-poor inequalities in severe wasting among under-five children in low- and middle-income countries? Compositional and structural characteristics.PLoS One. 2021 Jun 23;16(6):e0253831. doi: 10.1371/journal.pone.0253831. eCollection 2021. PLoS One. 2021. PMID: 34161382 Free PMC article.
Abstract
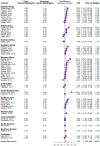
A good understanding of the poor-non-poor gap in childhood development of severe wasting (SW) is a must in tackling the age-long critical challenge to health outcomes of vulnerable children in low- and middle-income countries (LMICs). There is a dearth of information about the factors explaining differentials in wealth inequalities in the distribution of SW in LMICs. This study is aimed at quantifying the contributions of demographic, contextual and proximate factors in explaining the poor-non-poor gap in SW in LMICs. We pooled successive secondary data from the Demographic and Health Survey conducted between 2010 and 2018 in LMICs. The final data consist of 532,680 under-five children nested within 55,823 neighbourhoods from 51 LMICs. Our outcome variable is having SW or not among under-five children. Oaxaca-Blinder decomposition was used to decipher poor-non-poor gap in the determinants of SW. Children from poor households ranged from 37.5% in Egypt to 52.1% in Myanmar. The overall prevalence of SW among children from poor households was 5.3% compared with 4.2% among those from non-poor households. Twenty-one countries had statistically significant pro-poor inequality (i.e. SW concentrated among children from poor households) while only three countries showed statistically significant pro-non-poor inequality. There were variations in the important factors responsible for the wealth inequalities across the countries. The major contributors to wealth inequalities in SW include neighbourhood socioeconomic status, media access, as well as maternal age and education. Socio-economic factors created the widest gaps in the inequalities between the children from poor and non-poor households in developing SW. A potential strategy to alleviate the burden of SW is to reduce wealth inequalities among mothers in the low- and middle-income countries through multi-sectoral and country-specific interventions with considerations for the factors identified in this study.
Conflict of interest statement
The authors have declared that no competing interests exist.
Figures


References
-
- United Nations. Sustainable Development Goals (SDG) [Internet]. Washington, DC; 2015. http://www.un.org/sustainabledevelopment/sustainable-development-goals/.
-
- Health Poverty Action. Poverty and Poor Health | Health Poverty Action [Internet]. 2018 [cited 2019 Jul 6]. p. 1. https://www.healthpovertyaction.org/news-events/key-facts-poverty-and-po....
-
- WHO. Global Database on Child Growth and Malnutrition [Internet]. WHO. World Health Organization; 2010. [cited 2019 Jul 5]. p. 1–23. https://www.who.int/nutgrowthdb/about/introduction/en/.
-
- Hadzimustafa S, Rakipi R, Nikolov M. The Poverty Reducing Effect of Health—The Case of Republic of Macedonia [Internet]. 2018. http://databank.worldbank.org/data/reports.aspx?.
-
- Makoge V, Hogeling L, Maat H, Vaandrager L, Koelen M. Poverty-related diseases: factors that predict coping in two Cameroonian settings. Health Promot. Int. [Internet]. Narnia; 2019. [cited 2019 Jul 7];34:344–55. Available from: https://academic.oup.com/heapro/article/34/2/344/4718135. 10.1093/heapro/dax088 - DOI - PubMed
MeSH terms
LinkOut - more resources
Full Text Sources
Medical
Miscellaneous

