. 2021 Jan 13;29(1):68-82.e5.
doi: 10.1016/j.chom.2020.10.003. Epub 2020 Nov 2.

Ultra-low Dose Aerosol Infection of Mice with Mycobacterium tuberculosis More Closely Models Human Tuberculosis

Affiliations

Ultra-low Dose Aerosol Infection of Mice with Mycobacterium tuberculosis More Closely Models Human Tuberculosis

Courtney R Plumlee et al. Cell Host Microbe. .

Abstract

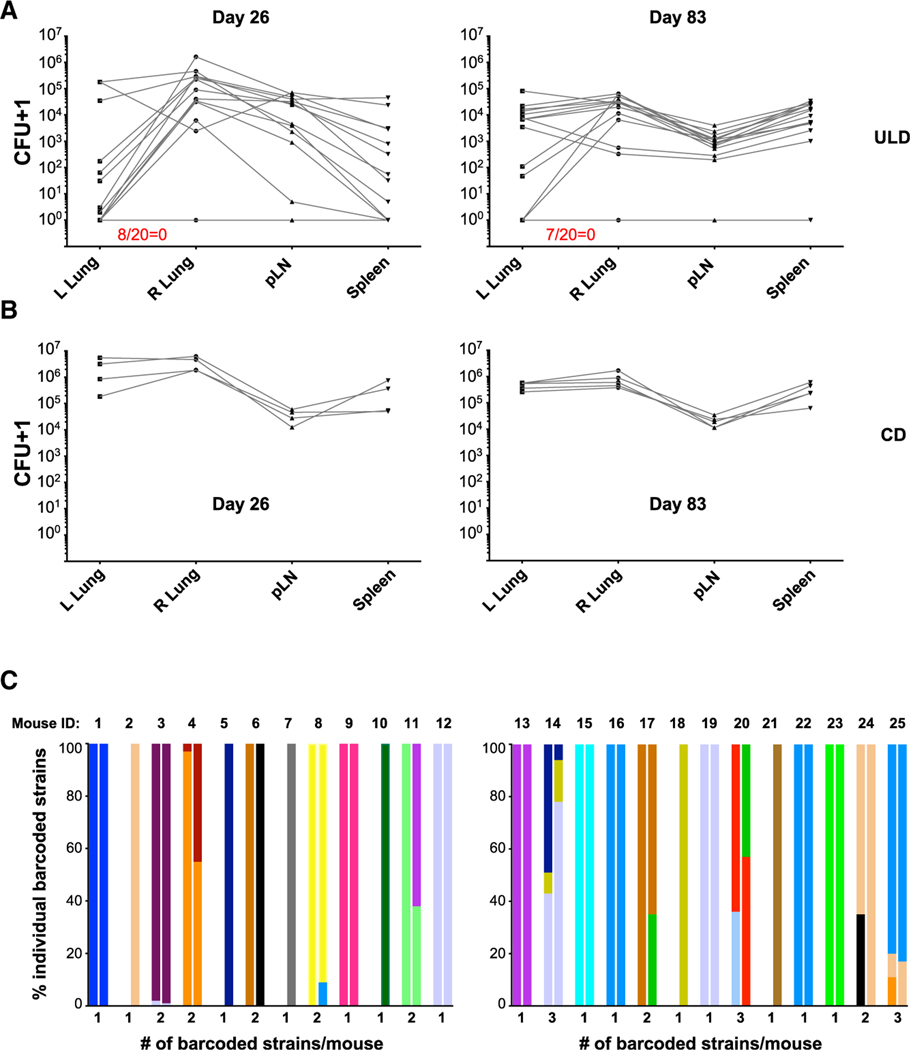
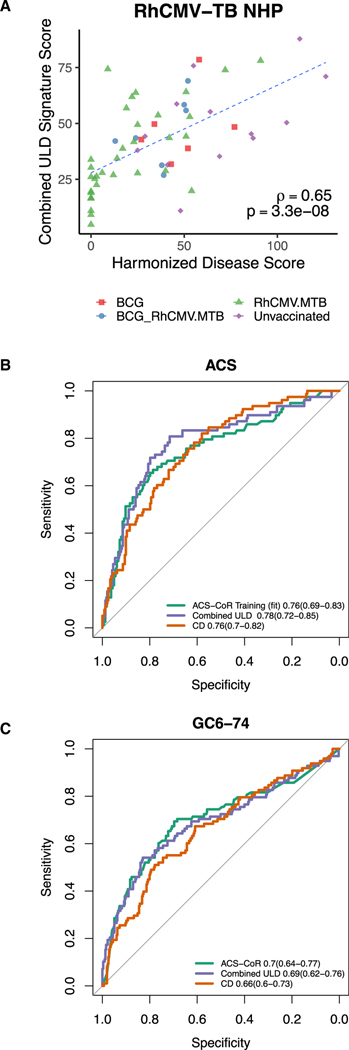
Tuberculosis (TB) is a heterogeneous disease manifesting in a subset of individuals infected with aerosolized Mycobacterium tuberculosis (Mtb). Unlike human TB, murine infection results in uniformly high lung bacterial burdens and poorly organized granulomas. To develop a TB model that more closely resembles human disease, we infected mice with an ultra-low dose (ULD) of between 1-3 founding bacteria, reflecting a physiologic inoculum. ULD-infected mice exhibited highly heterogeneous bacterial burdens, well-circumscribed granulomas that shared features with human granulomas, and prolonged Mtb containment with unilateral pulmonary infection in some mice. We identified blood RNA signatures in mice infected with an ULD or a conventional Mtb dose (50-100 CFU) that correlated with lung bacterial burdens and predicted Mtb infection outcomes across species, including risk of progression to active TB in humans. Overall, these findings highlight the potential of the murine TB model and show that ULD infection recapitulates key features of human TB.

Keywords: granuloma; heterogeneity; murine; pulmonary; transcriptional signature; tuberculosis; ultra-low dose.


Conflict of interest statement

Declaration of Interests The authors declare no competing interests.

Figures

Figure 1.
Figure 1.. Mice Infected with ULD Mtb (1–3 Bacilli) Display Heterogeneity in CFU from Individual Lungs
(A) C57BL/6 (B6) mice were aerosol infected with ULD Mtb from a pool of 50 barcoded Mtb strains, and CFUs were determined at day 26 (left panel) or day 83 (right panel) p.i. by plating right lung, left lung, pulmonary lymph node (LN), and spleen homogenates onto 7H10 plates. Each line represents an individual mouse. Of the 40 ULD Mtb-infected mice from both time points, 15 mice had no CFUs in either lung (38%). (B) B6 mice were aerosol infected with CD (50–100 CFUs) Mtb, and CFUs were determined day 26 (left panel) or day 83 (right panel) p.i. by plating right lung, left lung, pulmonary LN, and spleen homogenates onto 7H10 plates. Each line represents an individual mouse. (C) All colonies were collected separately from the right and left lungs, and bacterial DNA was isolated and sequenced for the individual genetic marks. The graph represents the contribution of each individual strain (number and percentage) in all mice from (A). See Table 1 for sequencing data from the LN and spleen.
Figure 2.
Figure 2.. ULD Mtb Infection in B6 Mice Results in Single, Organized Granulomas
(A) Representative image of a 20 μm lung section from a B6 mouse infected with CD Mtb, day 34 p.i. Zoom panels showing areas of granulomatous inflammation. (B) Representative images of 20 μm lung sections from two individual B6 mice infected with ULD Mtb, day 34 p.i. Zoom panels showing granulomas. (C) Plots showing distance of 80 μm radius neighborhoods raster-scanned from the nearest Mtb-infected cell versus number of cells of denoted type contained within that neighborhood. (D) Representative positional plots of neighborhoods color-coded by region as determined by a machine-learning clustering algorithm in CytoMAP. (E) Heatmap demonstrating the normalized cellular composition of specific cell types across each region for both CD and ULD. (F) Percent area of lung encompassed by each region in ULD- versus CD-infected B6 mice. (G) Cellular composition of regions, showing average number of different cell types per neighborhood in each region in CD and ULD B6 mice. (H) Heatmap showing the Pearson correlation coefficients, averaged across each infection group, between the number of different cell types per neighborhood within region 3. Data are representative of seven B6 ULD Mtb-infected mice and seven B6 CD Mtb-infected mice (two independent experiments).
Figure 3.
Figure 3.. ULD Mtb Infection in C3H Mice Results in Single, Organized Granulomas
(A) Representative multiparameter confocal microscopy images of 20 μm lung sections from two C3H mice infected with ULD Mtb, day 34 p.i. Zoom panels showing granulomas. (B) Plots showing distance of 80 μm radius neighborhoods raster-scanned from the nearest Mtb-infected cell versus number of cells of denoted type contained within that neighborhood. (C) Representative positional plots of neighborhoods, color-coded by region as determined by machine-learning clustering algorithm in CytoMAP. (D) Heatmap demonstrating the normalized cellular composition of specific cell types across each region. (E) Cellular composition of regions, showing average number of different cell types per neighborhood in each region in ULD-infected C3H versus B6 mice. (F) Cellular composition of regions, showing average number of different cell types per neighborhood in each region in C3H versus B6 mice. (G) Heatmap showing the Pearson correlation coefficients, averaged across each strain, between the number of different cell types per neighborhood within region 3. Data representative of four ULD Mtb-infected C3H mice and seven ULD-infected B6 mice.
Figure 4.
Figure 4.. A Transcriptional Signature of Bacterial Burden after ULD Challenge
(A) Heatmap showing expression level of Combined ULD signature gene pair ratios (rows) for mice after ULD challenge (columns) sorted by CFU. Purple indicates higher, positive ratio values, black indicates values close to 0, and blue indicates negative ratio values. (B) Scatterplot showing Combined ULD signature score (i.e., the sum of gene pair ratios of the Combined ULD signature) versus log10CFU from ULD and CD mice with detectable bacteria at time of sacrifice. Linear best fit line and Spearman correlation coefficient are indicated. (C) Scatterplot of expression of the Gbp4 (positively correlated with CFU) and Dock2 (negatively correlated with CFU) gene pair from the combined signature. Points represent individual ULD- or CD-infected mice colored by CFU at time of sacrifice. Lines of constant value show the expression ratio of Gbp4/Dock2, with red indicating high values, blue indicating low values, and white indicating Gpb4 = Dock2.
Figure 5.
Figure 5.. The ULD Combined Signature Predicts Bacterial Load and Disease Outcome in NHP and Human Cohorts
(A) Scatterplot showing ULD Combined signature score versus NHP disease outcome score. Signature scores were calculated based on NHP blood samples taken day 28 post-Mtb challenge as part of the RhCMV-TB vaccine study. (B) Receiver-operator curves (ROC) comparing Combined ULD signature performance to the ACS-CoR and CD signatures in discriminating TB progressors from controls in the ACS of LTB+ adolescents. Areas under the curve (AUCs) and accompanying 95% CIs are shown on the bottom right. (C) ROC showing ULD Combined signature performance compared to ACS-CoR and CD signature performance in discriminating TB progressors from controls among household contacts of TB in the GC6–74 study. AUC and 95% CI shown on the bottom right.

References

    1. Acuña-Villaorduña C, Schmidt-Castellani LG, Marques-Rodrigues P, White LF, Hadad DJ, Gaeddert M, Ellner JJ, Fennelly KP, Palaci M, Dietze R, and Jones-López EC (2018). Cough-aerosol cultures of Mycobacterium tuberculosis in the prediction of outcomes after exposure. A household contact study in Brazil. PLoS ONE 13, e0206384. - PMC - PubMed
    1. Adams KN, Takaki K, Connolly LE, Wiedenhoft H, Winglee K, Humbert O, Edelstein PH, Cosma CL, and Ramakrishnan L. (2011). Drug tolerance in replicating mycobacteria mediated by a macrophage-induced efflux mechanism. Cell 145, 39–53. - PMC - PubMed
    1. Ahmed M, Thirunavukkarasu S, Rosa BA, Thomas KA, Das S, Rangel-Moreno J, Lu L, Mehra S, Mbandi SK, Thackray LB, et al. (2020). Immune correlates of tuberculosis disease and risk translate across species. Sci. Transl. Med 12, eaay0233. - PMC - PubMed
    1. Balasubramanian V, Wiegeshaus EH, Taylor BT, and Smith DW (1994). Pathogenesis of tuberculosis: pathway to apical localization. Tuber. Lung Dis 75, 168–178. - PubMed
    1. Barry CE 3rd, Boshoff HI, Dartois V, Dick T, Ehrt S, Flynn J, Schnappinger D, Wilkinson RJ, and Young D. (2009). The spectrum of latent tuberculosis: rethinking the biology and intervention strategies. Nat. Rev. Microbiol 7, 845–855. - PMC - PubMed