. 2020 Dec 3;27(6):905-919.e10.
doi: 10.1016/j.stem.2020.10.004. Epub 2020 Oct 21.

Three-Dimensional Human Alveolar Stem Cell Culture Models Reveal Infection Response to SARS-CoV-2

Affiliations

Three-Dimensional Human Alveolar Stem Cell Culture Models Reveal Infection Response to SARS-CoV-2

Jeonghwan Youk et al. Cell Stem Cell. .

Abstract

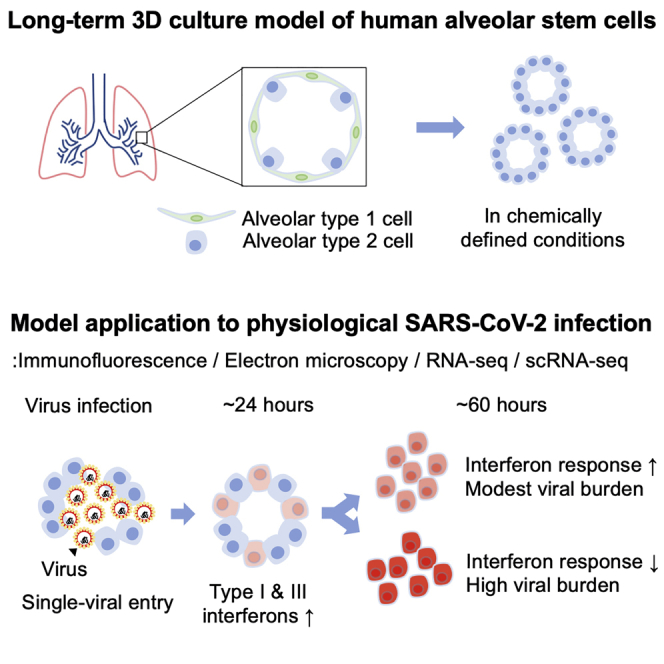
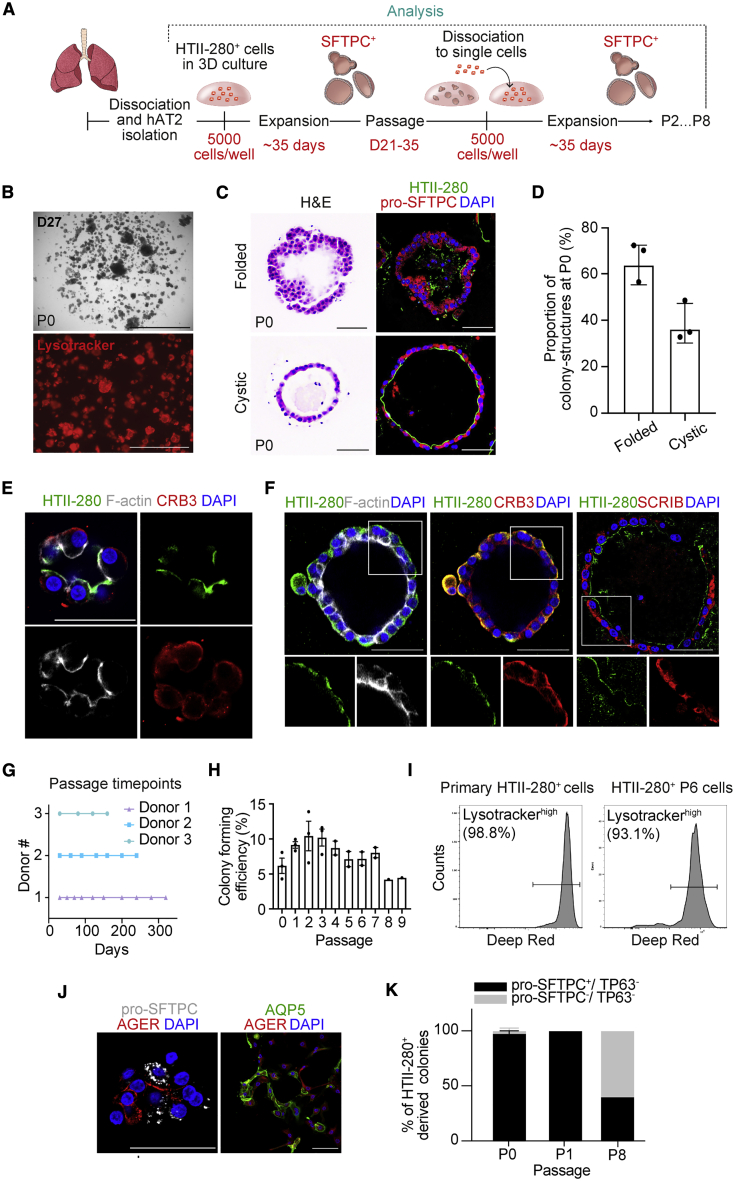
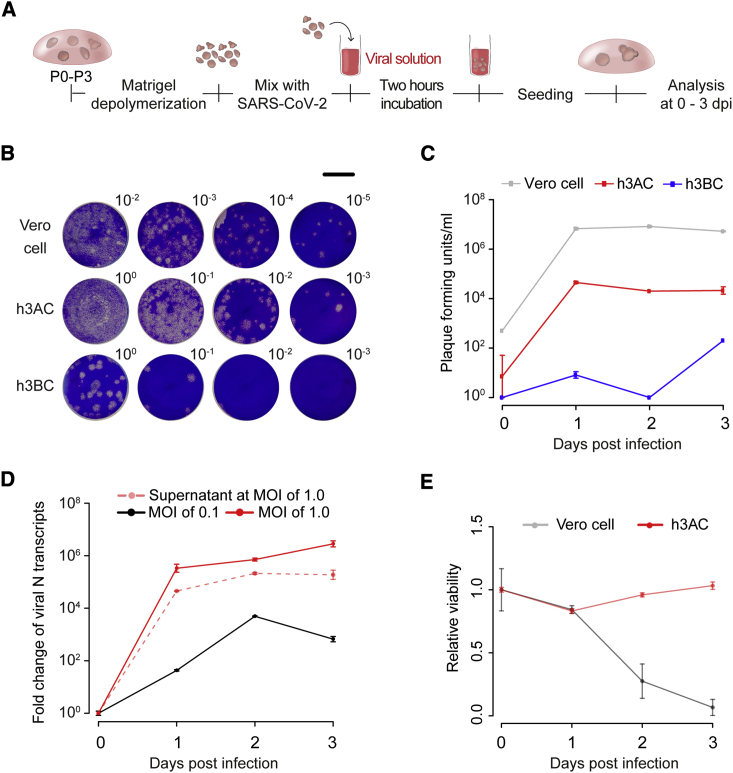
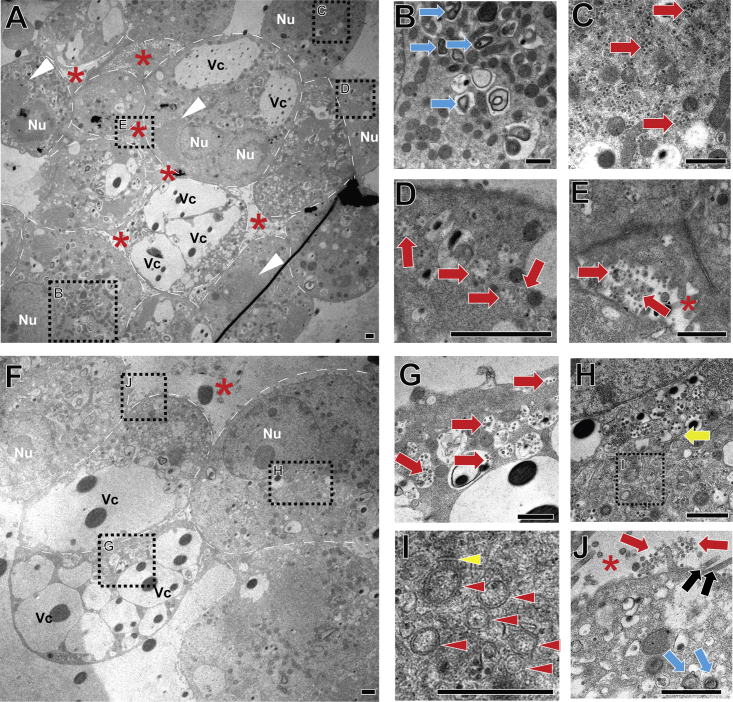
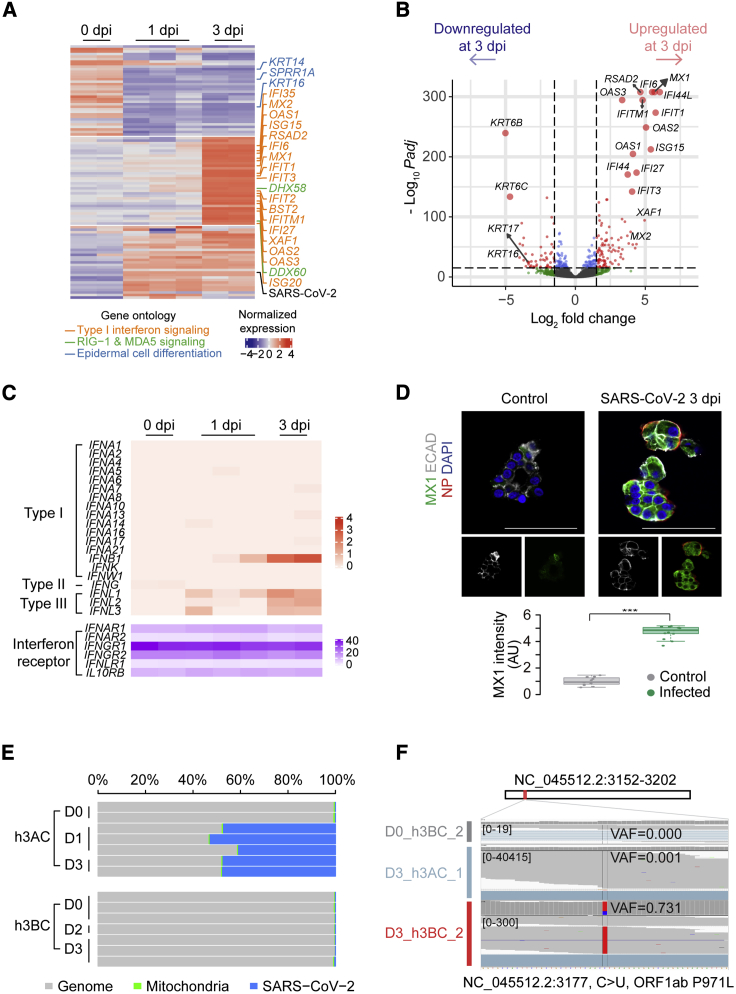
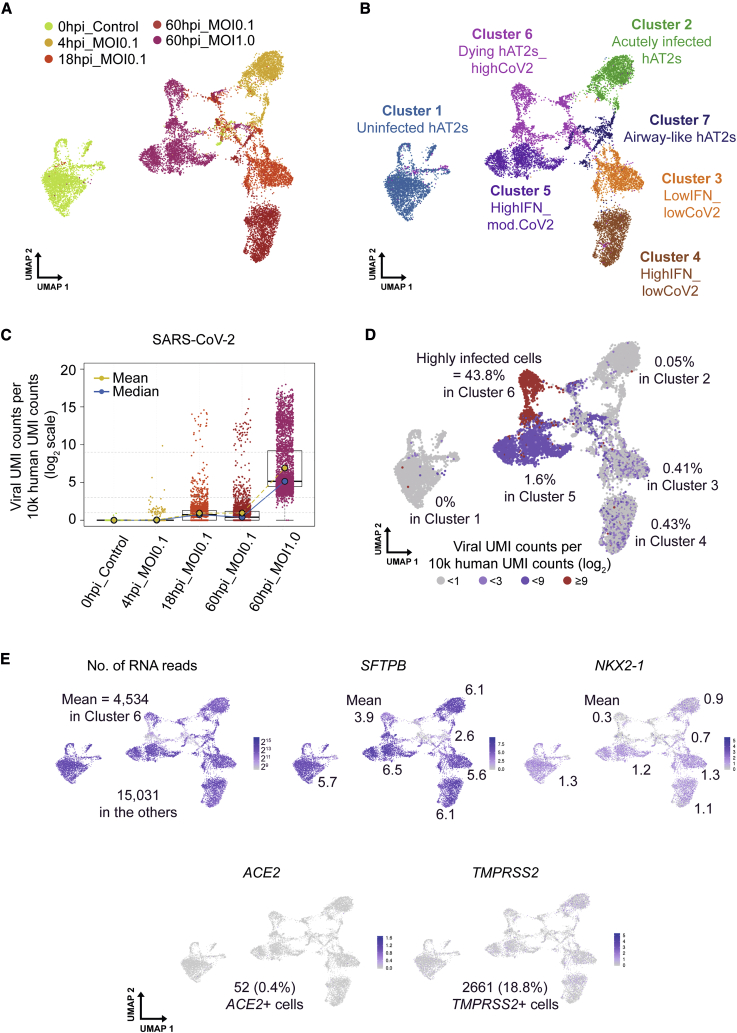
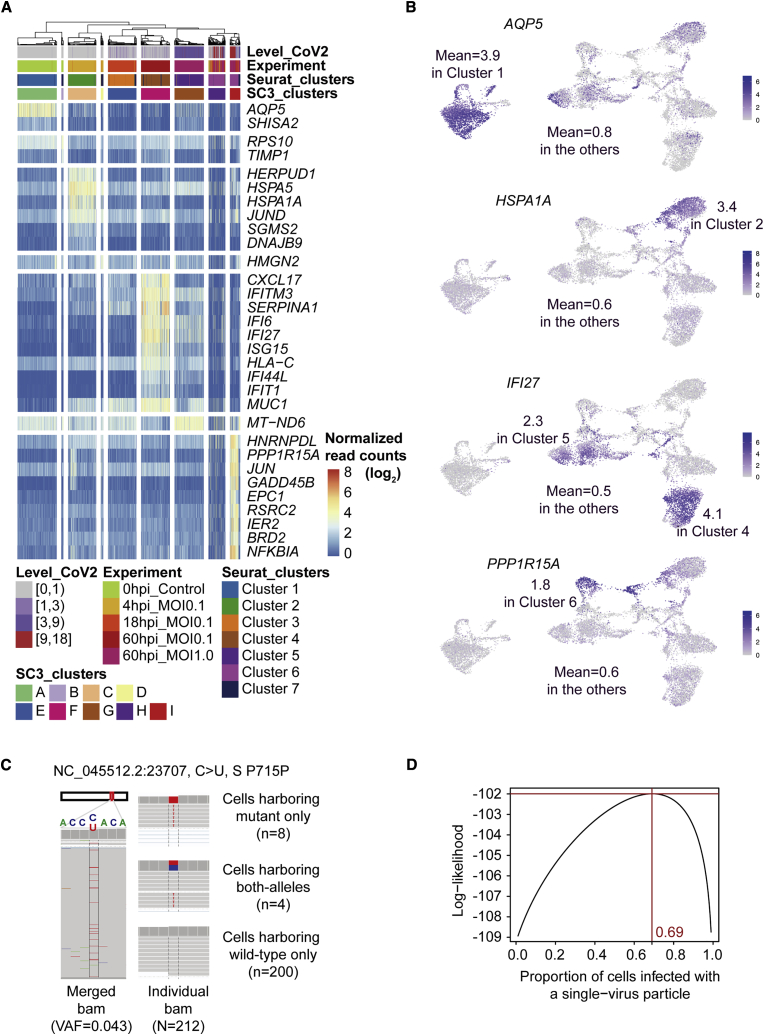
Severe acute respiratory syndrome coronavirus 2 (SARS-CoV-2), which is the cause of a present pandemic, infects human lung alveolar type 2 (hAT2) cells. Characterizing pathogenesis is crucial for developing vaccines and therapeutics. However, the lack of models mirroring the cellular physiology and pathology of hAT2 cells limits the study. Here, we develop a feeder-free, long-term, three-dimensional (3D) culture technique for hAT2 cells derived from primary human lung tissue and investigate infection response to SARS-CoV-2. By imaging-based analysis and single-cell transcriptome profiling, we reveal rapid viral replication and the increased expression of interferon-associated genes and proinflammatory genes in infected hAT2 cells, indicating a robust endogenous innate immune response. Further tracing of viral mutations acquired during transmission identifies full infection of individual cells effectively from a single viral entry. Our study provides deep insights into the pathogenesis of SARS-CoV-2 and the application of defined 3D hAT2 cultures as models for respiratory diseases.

Keywords: 3D cultures; COVID-19; SARS-CoV-2; alveolar stem cells; electron microscopy; human alveolar type 2 cells; infection; interferon; interferon-stimulating genes; single-cell RNA-seq.


Conflict of interest statement

Declaration of Interests Y.S.J. is a founder and CEO of GENOME INSIGHT.

Figures

None
Graphical abstract
Figure 1
Figure 1
Long-Term, 3D Cultures of hAT2 Cells in Chemically Defined Conditions (A) Schematic diagram outlining our h3AC method. (B) A representative image of primary human alveolar type 2 (hAT2)-derived three-dimensional (3D) structures (h3ACs) from freshly isolated HTII-280+ cells at day 27 in culture (top) and with Lysotracker (bottom; red). P0, passage 0. Scale bars represent 2,000 μm (top) and 1000 μm (bottom). (C) Morphological heterotypic colony formation from isolated hAT2 cells in primary h3ACs (P0). Hematoxylin and eosin (H&E; left) and IF staining (right) for HTII-280 (green), pro-SFTPC (red), and DAPI (blue). Scale bar, 50 μm. (D) Quantification of the folded and cystic 3D structures in primary h3ACs (P0). Data presented are the mean ± SEM for three individual donor samples (n = 67 for donor 1, n = 50 for donor 2, and n = 50 for donor 3; n = total number of colonies scored). (E) IF images of primary h3ACs expressing HTII-280 (green), F-actin (white), CRB3 (red), and DAPI (blue). Scale bar, 50 μm. (F) IF images of primary h3ACs expressing HTII-280 (green), F-actin (white), CRB3 (red), SCRIB (red), and DAPI (blue). Scale bar, 50 μm. (G) Serial passage of h3ACs via single-cell dissociation at various time points depending on growth from three individual donors. Each point represents a single passage for n = 3 individual donor samples with more than three technical replicates. (H) Quantification of colony-forming efficiency for h3ACs at day 14 of culture up to nine total passages (colony-forming efficiency is defined as the number of colonies formed/number of cells plated per well as a percentage). Data are presented as mean ± SEM for three individual donor samples (n = 3 biological samples). Each point represents the average of three technical replicates calculated for each biological sample (except passage 8 [P8], where n = 2). (I) Flow cytometry analysis of Lysotracker (deep red) uptake in freshly isolated HTII-280+ cells and dissociated h3ACs at passage 6 (P6; 6 months in culture). (J) IF images of hAT1 cells, induced by 2D-plating of cultured h3ACs at passage 2. Pro-SFTPC (hAT2, white), AGER (hAT1, red), AQP5 (hAT1, green), and DAPI (blue). Scale bar, 50 μm. (K) Quantification of h3ACs expressing pro-SFTPC and TP63 over multiple passages (P0, passage 1 [P1], and P8). h3ACs were classified based on IF staining for pro-SFTPC (hAT2), TP63 (basal), or lack of both markers (pro-SFTPC TP63). The mean percentage of total colonies per well represented by each class of colony is shown. Data are presented as mean ± SEM at each passage (n = 131 for P0, n = 55 for P1, and n = 25 for P8). Three donor samples were used, except for P8 (where one donor sample was used). n = total number of colonies scored across passages.
Figure 2
Figure 2
SARS-CoV-2 Infectivity in Human 3D Alveolar and Bronchial Cultures (A) Schematic diagram outlining the method for SARS-CoV-2 infection in h3ACs and human 3D bronchial cultures (h3BCs). To infect these models, h3ACs and h3BCs were collected and broken to expose the luminal space. Then, the pieces of h3ACs and h3BCs were incubated with SARS-CoV-2 at multiplicity of infection (MOI) of 0.1 or 1.0 for 2 h. (B) Representative images for plaque assay using SARS-CoV-2 infected cells at 3 dpi. Dilution factors are shown in the right upper corner. Scale bar, 1 cm. (C) Plaque assay showing that SARS-CoV-2 actively replicates in h3ACs at 1 dpi. Data are presented as mean ± SEM (n = 2, two plaque assays at each time point). h3ACs at passages 2–3 from two donors and h3BCs at passage 2 from two donors were used in the plaque assays. (D) qPCR analysis measuring the viral N gene transcripts of SARS-CoV-2 in lysed h3ACs with MOI of 0.1 and 1.0 and in supernatant of h3ACs with MOI of 1.0. Data are presented as mean ± SEM (n = 3, three qPCR assays at each time point). h3ACs at passages 1–3 from three donors and h3BCs at passage 2 from two donors were used in the experiment. (E) The viability of Vero cells remarkably decreases at 2 days after SARS-CoV-2 infection, whereas that of h3ACs does not significantly change. Data are presented as mean ± SEM (n = 2, three measurements of luminescence at each time point). h3ACs at P0 from one donor were used in the experiment.
Figure 3
Figure 3
Confocal Imaging of SARS-CoV-2-Infected h3ACs (A) Representative image of IF staining of ACE2 (green) and HTII-280 (red) in h3ACs. All replicates (n = 5 at passage 1–2 from three donors) of control h3ACs express ACE2 and HTII-280. Scale bar, 50 μm. (B) Representative image of IF staining of TMPRSS2 (green) and pro-SFTPC (red) in h3ACs. All replicates (n = 5 at passage 1–2 from three donors) of control h3ACs express TMPRSS2 and pro-SFTPC. Scale bar, 50 μm. (C) Representative images of an infected h3AC at 1 dpi. Viral components (NP or dsRNA; green) are co-stained with pro-SFTPC (red). At 1 dpi, SARS-CoV-2 highly infects h3ACs, which show a punctated pattern of pro-SFTPC. n ≥ 5 replicates of infected h3ACs; P2–P3 from three donors. Scale bar, 50 μm. (D) Representative images of an infected h3AC expressing ACE2 (red). SARS-CoV-2 are identified by viral dsRNA (green) or NP (green). Viral dsRNA appears punctated. n ≥ 5 replicates of infected h3ACs; P2–P3 from three donors. Scale bar, 50 μm.
Figure 4
Figure 4
Transmission Electron Microscopic Imaging Analysis of SARS-CoV-2-Infected h3ACs at 2 Days after Infection (A) Low-magnification representative image of infected h3ACs (n = 10 h3ACs from three donors; P2–P3). Red asterisks, alveolar space; white arrowheads, aggregated viral particles; white dashed line, hAT2 cell membrane. Vc, large pathologic vacuoles; Nu, nucleus. (B) Lamellar bodies (blue arrow) are observed. (C) hAT2 cells with a high density of SARS-CoV-2 particles. Viral particles are dispersed in a cytoplasm of the cell (red arrow). (D) Multiple viral particles included in the vesicular structures (red arrow). (E) Virus particles secreted to the lumen of the h3AC. (F) Partial image of another infected h3AC. (G) Virus particles encapsulated in vesicular structures (red arrow). (H) Virus-containing vesicles aggregated in the vicinity of ER (yellow arrow). (I) Double-membrane vesicles (red arrowhead) located near zippered ER (yellow arrowhead). (J) Viral particles secreted into the lumen of a h3AC (red arrows). Microvilli (black arrow) are shown at the apical side of a hAT2 cell. Scale bars, 1 μm.
Figure 5
Figure 5
RNA-Sequencing Analyses of Infected h3ACs and h3BCs (A) Heatmap of the most variable 100 genes among three groups of h3ACs at 0, 1, and 3 dpi. (B) Volcano plot showing differentially expressed genes between h3ACs at 0 and 3 dpi. (C) Transcriptional changes of interferon genes in infected h3ACs by transcripts per million (TPM) values. (D) IF imaging for upregulated MX1 (green). The intensity of MX1 significantly increases in infected h3ACs (p value < 0.001). n = 11 for control and n = 13 for infected h3ACs. (E) Proportion of viral RNA reads in h3AC and h3BC transcriptomes. (F) Example of a missense mutation (NC_045512.2: 3,177C > U) detected from a h3BC transcriptome at 3 dpi.
Figure 6
Figure 6
Single-Cell Transcriptome Analysis of Uninfected and Infected h3ACs (A) Five experimental conditions of the dataset in the UMAP plot. hpi, hours post infection. (B) Unsupervised UMAP clustering of uninfected and infected h3ACs. (C) Normalized levels of SARS-CoV-2 viral UMI counts in each experimental condition. (D) Normalized levels of SARS-CoV-2 viral UMI counts in the UMAP plot. Highly infected cells (viral UMI counts per 10,000 human UMI counts ≥29) are mostly enriched in cluster 6. (E) Expression of genes showing general features of h3ACs in the dataset.
Figure 7
Figure 7
Gene Markers for Each of the Cluster and Estimation of the Number of Viruses Entering a Host Cell (A) Heatmap showing highly expressed variable genes in each cluster. The most significantly variable genes (≤10) in each cluster are shown. Level_CoV2, log2 level of SARS-CoV-2 UMI counts per 10,000 human UMI counts; normalized read counts ((log2)), UMI counts of a certain gene per 10,000 human UMI counts. (B) Expression of genes that are represented in the uninfected hAT2 cluster (AQP5), the acutely infected hAT2 cluster (HSPA1A), lowIFN_lowCoV2 and lowIFN_mod.CoV2 clusters (IFI27), and dying hAT2s_highCoV2 (PPP1R15A). (C) Distribution of single-base substitution (variant allele fraction [VAF] = 4.3% in original viral particles) in each cell. (D) Maximum likelihood estimation for the proportion of cells infected with a single virus.

References

    1. Adams T.S., Schupp J.C., Poli S., Ayaub E.A., Neumark N., Ahangari F., Chu S.G., Raby B.A., DeIuliis G., Januszyk M. Single-cell RNA-seq reveals ectopic and aberrant lung-resident cell populations in idiopathic pulmonary fibrosis. Sci. Adv. 2020;6:eaba1983. - PMC - PubMed
    1. Andersen K.G., Rambaut A., Lipkin W.I., Holmes E.C., Garry R.F. The proximal origin of SARS-CoV-2. Nat. Med. 2020;26:450–452. - PMC - PubMed
    1. Arbour N., Côté G., Lachance C., Tardieu M., Cashman N.R., Talbot P.J. Acute and persistent infection of human neural cell lines by human coronavirus OC43. J. Virol. 1999;73:3338–3350. - PMC - PubMed
    1. Bao L., Deng W., Huang B., Gao H., Liu J., Ren L., Wei Q., Yu P., Xu Y., Qi F. The pathogenicity of SARS-CoV-2 in hACE2 transgenic mice. Nature. 2020;583:830–833. - PubMed
    1. Bar-On Y.M., Flamholz A., Phillips R., Milo R. SARS-CoV-2 (COVID-19) by the numbers. eLife. 2020;9:e57309. - PMC - PubMed

Publication types