. 2020 Nov 25;183(5):1202-1218.e25.
doi: 10.1016/j.cell.2020.10.016. Epub 2020 Nov 2.

Neurons Release Serine to Support mRNA Translation in Pancreatic Cancer

Affiliations

Neurons Release Serine to Support mRNA Translation in Pancreatic Cancer

Robert S Banh et al. Cell. .

Abstract

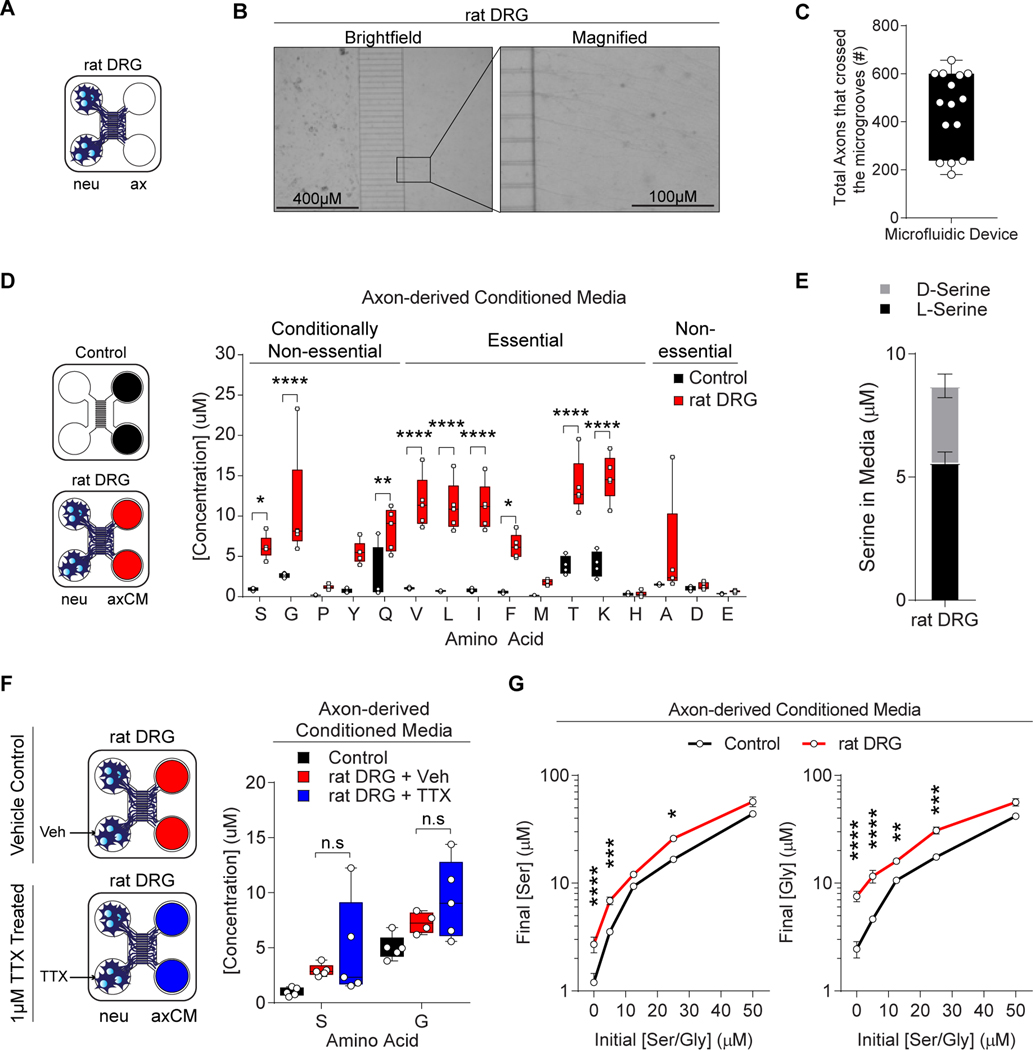
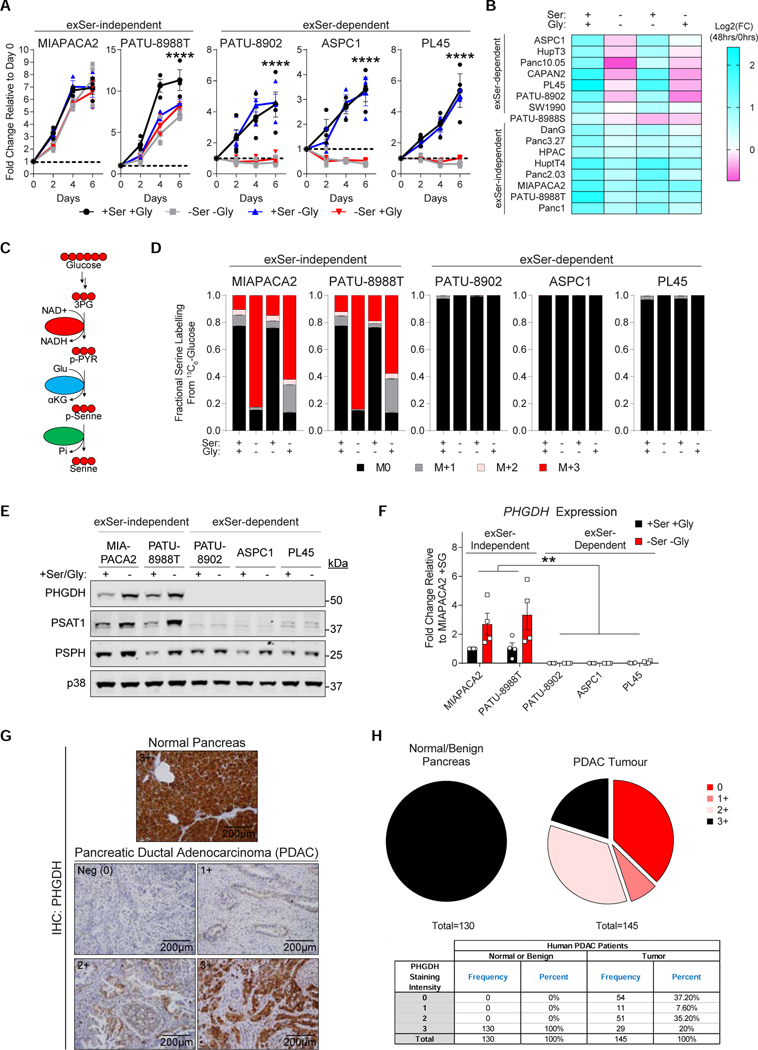
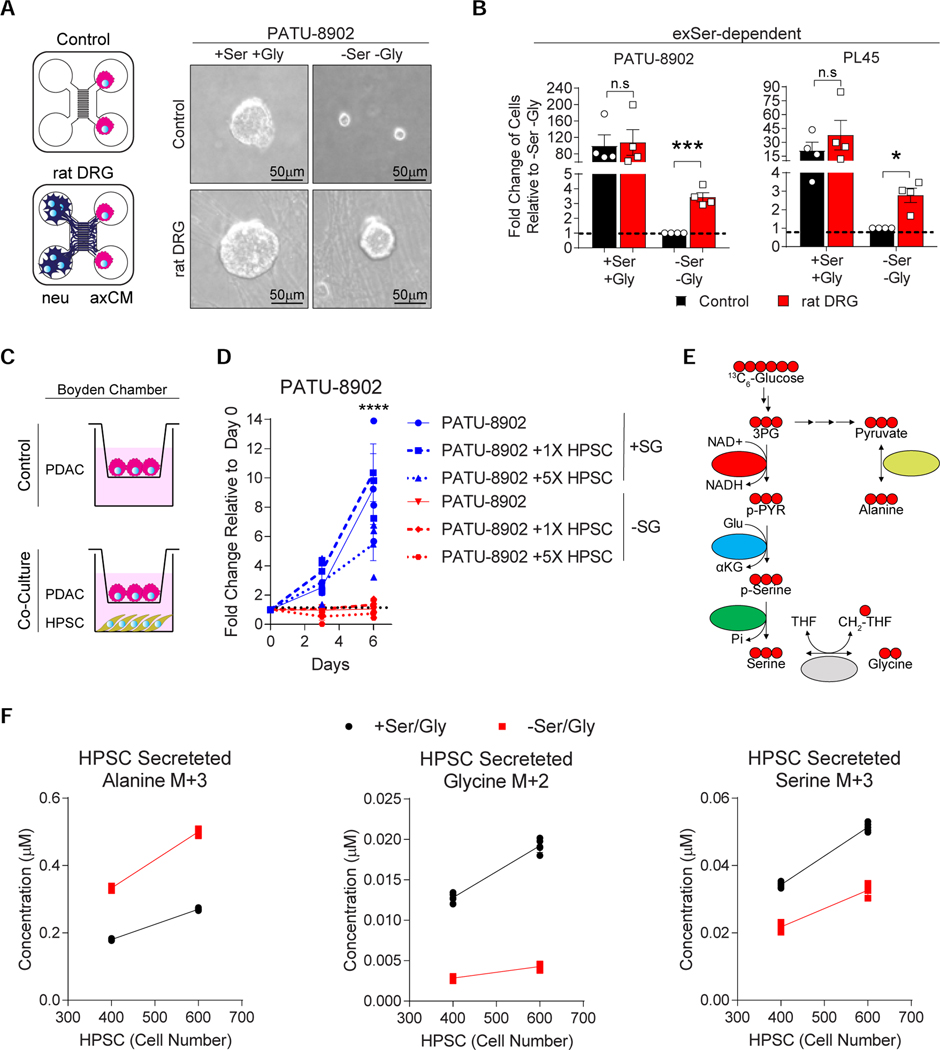
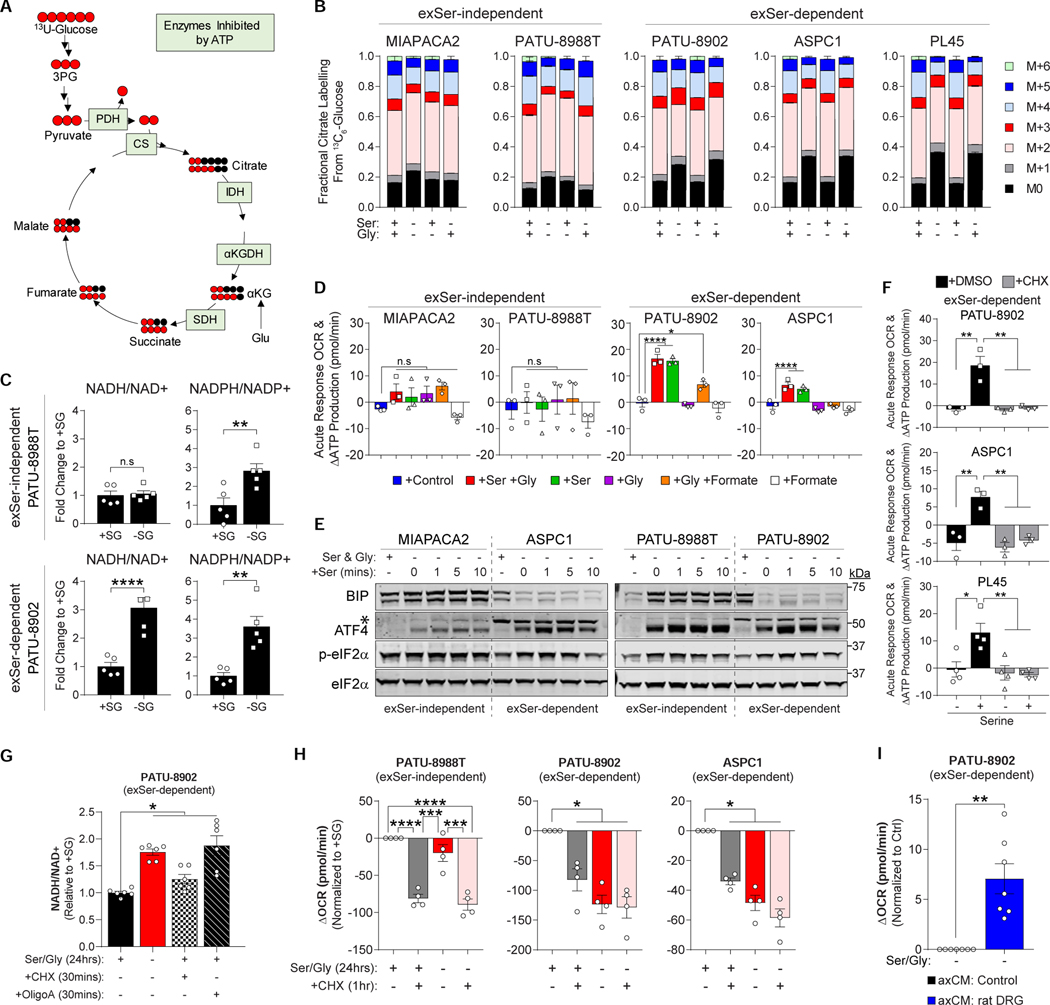
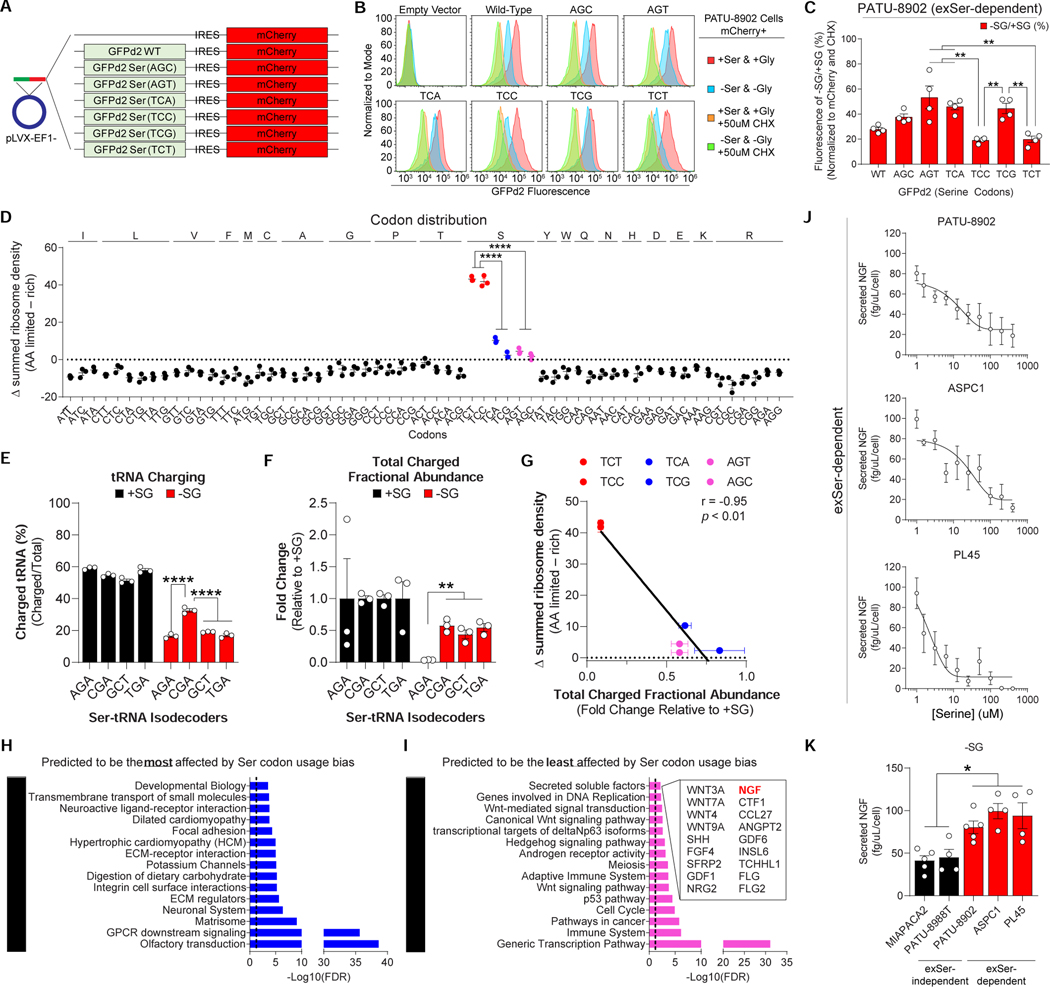
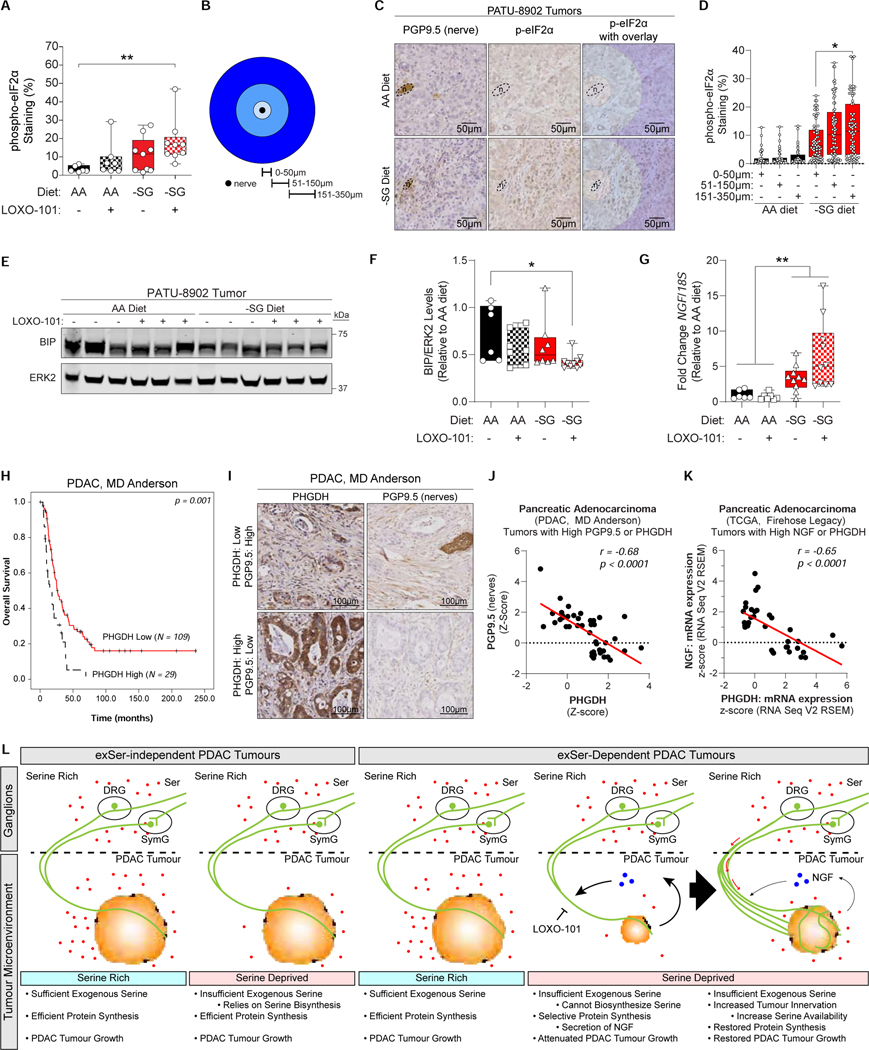
Pancreatic ductal adenocarcinoma (PDAC) tumors have a nutrient-poor, desmoplastic, and highly innervated tumor microenvironment. Although neurons can release stimulatory factors to accelerate PDAC tumorigenesis, the metabolic contribution of peripheral axons has not been explored. We found that peripheral axons release serine (Ser) to support the growth of exogenous Ser (exSer)-dependent PDAC cells during Ser/Gly (glycine) deprivation. Ser deprivation resulted in ribosomal stalling on two of the six Ser codons, TCC and TCT, and allowed the selective translation and secretion of nerve growth factor (NGF) by PDAC cells to promote tumor innervation. Consistent with this, exSer-dependent PDAC tumors grew slower and displayed enhanced innervation in mice on a Ser/Gly-free diet. Blockade of compensatory neuronal innervation using LOXO-101, a Trk-NGF inhibitor, further decreased PDAC tumor growth. Our data indicate that axonal-cancer metabolic crosstalk is a critical adaptation to support PDAC growth in nutrient poor environments.

Keywords: mRNA translation; metabolic crosstalk; neurons; pancreatic cancer; serine.


Conflict of interest statement

Declaration of Interests M.E.P. has options in Raze Therapeutics and received travel funds from Thermo Fisher Scientific. J.D.M is an inventor on a patent pertaining to the autophagic control of iron metabolism. A.C.K. has financial interests in Vescor Therapeutics, LLC. A.C.K. is an inventor on patents pertaining to KRAS regulated metabolic pathways, redox control pathways in pancreatic cancer, targeting GOT1 as a therapeutic approach, and the autophagic control of iron metabolism. A.C.K is on the Science Advisory Board of Rafael/Cornerstone Pharma. A.C.K. has been a consultant for Deciphera Pharma. The other authors declare no competing interest.

Figures

Figure 1.
Figure 1.
Axons secrete serine to support exSer-dependent PDAC growth. A, Schematic of microfluidic device with rat DRGs on the neuronal side (neu) and axons on the axonal side (ax). B, Representative images of axons from rat DRGs in microfluidic devices from A. C, Quantification of the number of axons that crossed the microgrooves in the microfluidic device (n=15). D, AA concentrations were measured from conditioned-media from the axonal side without (n=4) and with (n=5) rat DRGs. neu: neuronal side; axCM: axonal conditioned media. E, L- and D-Ser concentrations were measured from conditioned media collected from the axCM of the microfluidic device with rat DRGs after 24 hours (n=5). F, Ser and Gly concentrations were measured from axCM of rat DRGs treated with vehicle (Veh) or 1μM TTX as shown (n=4–5). G, Ser and Gly concentrations were measured after 24 hours from axCM containing axons from rat DRGs. The axon side was cultured at the indicated initial Ser/Gly concentrations at the beginning of the assay (n=5). “n” are displayed as individual points and represent the number of biologically independent devices. Graphs represent (median ± max/min (C, D, F) and mean ± s.e.m. (E, G)) were compared by two-way ANOVA (D, F-G), followed by Bonferroni post-hoc test (*p<0.05, **p<0.01, ****p<0.0001).
Figure 2.
Figure 2.
A subset of human PDAC cells require exogenous Ser for growth. A, Human PDAC cells were grown in the presence or absence of Ser and/or Gly (n=3 biologically independent experiments). B, Heatmap of PDAC cell growth with or without Ser and/or Gly after 48 hours (n=2). FC reflects the number of cells at 48 hours normalized to 0 hours. C, Schematic of SBP from 13C6-glucose. Each red and black circle represents one 13C and 12C, respectively. D, PDAC cells were labelled with 13C6-glucose for 24 hours and fractional labelling of Ser was measured using GC-MS. (n=5). E, Immunoblots of SBP enzymes (PHGDH, PSAT1 and PSPH) in PDAC cells grown with and without Ser/Gly. p38 serves as a loading control. F, PHGDH expression in exSer-independent and -dependent human PDAC cells that were grown in the presence or absence of Ser/Gly after 24 hours (n=4). G-H, Representative image (G), and scoring and frequency (H) of immunohistochemical (IHC) staining of PHGDH intensity scores in normal pancreas and PDAC tissue. Where “n” represents the number of biologically independent replicates. Graphs (mean ± s.e.m.) were compared using two-way ANOVA (A, D, F), followed by Bonferroni post-hoc test (**p<0.01, ***p<0.005).
Figure 3.
Figure 3.
Axons can metabolically support exSer-dependent PDAC cells in Ser/Gly-deprived conditions. A, Representative images of axons supporting exSer-dependent PATU-8902 growth under Ser/Gly-deprived conditions in the channels of microfluidic device. B, Quantification of PATU-8902 and PL45 growth in the presence or absence of Ser/Gly and rat DRGs after 6 and 12 days, respectively (n=4). C, Schematic of co-culture of exSer-dependent PDAC cells and human pancreatic stellate cells (HPSCs) in a Boyden Chamber. D, exSer-dependent PDAC cells were co-cultured with HPSC cells with (+SG) and without (-SG) Ser/Gly as shown in C (n=3). E, Schematic of 13C6-glucose labelling to produce 13C3-Ser (M+3), 13C2-Gly (M+2) and 13C3-alanine (M+3). F, Concentrations of 13C6-glucose-derived alanine, Gly and Ser produced and secreted by 400 and 600 HPSCs (n=5). Where “n” represents the number of biologically independent replicates. Graphs (mean ± s.e.m.) were compared by one-sample t-test (B) or two-way ANOVA (D, F), followed by Bonferroni post-hoc test (*p<0.05, ***p<0.005, ****p<0.0001).
Figure 4.
Figure 4.
Serine indirectly regulates mitochondrial activity in PDAC cells, via its importance for protein synthesis. A, Schematic of 13C6-glucose labelling into the TCA cycle. Each red and black circle represent one 13C and 12C, respectively. Enzymes negatively regulated by ATP are indicated in green. B, Fractional labelling of citrate from 13C6-glucose in PDAC cells measured with or without Ser and/or Gly after 24 hours (n=5). C, Fold change of NADH/NAD+ and NADPH/NADP+ ratios in PDAC cells grown with and without Ser/Gly after 24 hours (n=5). D, Acute response in oxygen consumption rate (OCR) after metabolite(s) stimulation (n=3). E, Immunoblots of BIP, ATF4 and p-eIF2α in response to 400μM Ser stimulation in PDAC cells starved of Ser/Gly after 24 hours. eIF2α serves as a loading control. Asterisk (*) represents non-specific band. F, Acute response in OCR to Ser in exSer-dependent PDAC cells pretreated with or without 50μM cyclohexamide (CHX) for 1 hour (n=3-4). G, Fold change in NADH/NAD+ was assessed in exSer-dependent PDAC cells grown in Ser/Gly-rich and –poor conditions for 24 hours, and treated with or without 50μM CHX and 2μM oligomycin A (OligoA) for 30 mins (n=6). H, Change in OCR in exSer-independent and –dependent in response to Ser-deprivation, with or without 50μM CHX treatment (n=4). I, Change in OCR in exSer-dependent PDAC cells grown in 50% Ser/Gly-deprived media with 50% axon-derived conditioned media (axCM) from microfluidic devices without (Control) and with axons from rat DRGs for 24 hours (n=7). Where “n” represents the number of biologically independent experiments for each group and condition. Graphs (mean ± s.e.m.) were compared by one-sample (I), two-tailed Student t-test (C), two (B) and one (D, F, G-H) -way ANOVA, followed by Bonferroni post-hoc test (*p<0.05, **p<0.01, ***p<0.005, ****p<0.0001).
Figure 5.
Figure 5.
Ser/Gly starvation regulates protein synthesis via differences in mRNA TE of Ser codons. A, PDAC cells were infected with pLVX-EF1-GFPd2-IRES-mCherry constructs, where all Ser codons were replaced with indicated Ser codons. mCherry serves as an internal control. B-C, Representative flow plots (B) and quantification (C) of GFPd2 fluorescence in PATU-8902 cells expressing Ser codon constructs from A, grown with and without Ser/Gly or 50μM CHX (n=4). D, Quantification of ribosomal density at specific codons in PATU-8902 after being grown in Ser/Gly-depleted media (n=3). E-F, Percent tRNA charging (E), and total fractional abundance of charged (F) Ser-tRNA isodecoders in PATU-8902 cells grown with and without Ser/Gly (n=3). G, Ribosome density was plotted against change in total fractional abundance of charged Ser-tRNA isodcoders in exSer-dependent PDAC cells grown with or without Ser/Gly (n=3). Pearson correlation value is represented by r. H-I, Top 20 canonical pathways that are predicted to be most (H) or least (I) affected by TCT and TCC Ser codon usage bias. Secreted factors predicted to be least affected by Ser codon usage bias are listed. J, Measurements of NGF in the media of PDAC cells grown in different concentrations of Ser after 24 hours (n=4–5). K, Secreted NGF from PDAC cells grown in Ser/Gly-free conditions after 24 hours from J and Figure S5O (n=4–5). “n” are displayed as individual points and represent the number of biologically independent devices. Graphs (mean ± s.e.m.) were compared by one-way ANOVA (C-F, K), followed by Bonferroni post-hoc test (**p<0.01, ****p<0.0001).
Figure 6.
Figure 6.
Ser/Gly-free diet and LOXO-101 affects tumor growth and nerve infiltration of exSer-dependent PDAC (PATU-8902) tumors. A, Athymic nude mice were placed on AA or -SG diet for two weeks before orthotopic injection of PATU-8902 cells into the pancreas. Plasma and tumors were harvested at the indicated times. B, PATU-8902 tumor weight from mice on AA (n=10) or -SG (n=9) diet after five weeks post-injection. C, Quantification of IHC of p-Histone 3 and cleaved caspase 3 staining of PATU-8902 tumors collected from mice on AA (n=10) and –SG (n=9) diet. D, Representative 3D fluorescent images of nerves (PGP9.5) in PATU-8902 tumors from mice on AA and -SG diets. E, Quantification of nerves (PGP9.5) in PATU-8902 tumors from mice on AA (n=10) and -SG diets (n=9). F, LOXO-101 treatment was started one week post-injection and given by oral gavage daily. G-H, PATU-8902 tumor weight (G), and quantification of PGP9.5 and p-Histone 3 IHC staining (H) from mice on AA or -SG diet treated with or without LOXO-101 (n≥6). I, Representative images and quantification of PGP9.5 from H (n≥6). Where “n” and each point represents the number of biologically independent experiments for each group and condition. Graphs (median ± max/min) were compared using two-tailed Student t-test (B, C, E), or one-way ANOVA, followed by Holm-Sidak post-hoc test (G-I). (*p<0.05, **p<0.01, ***p<0.005, ****p<0.0001).
Figure 7.
Figure 7.
Axons metabolically support regional limitation of Ser in PDAC. A, Quantification of phospho-eIF2α staining of PATU-8902 tumors from mice on AA or - SG diet treated with (+) or without (−) LOXO-101, five weeks after orthotopic injection (n≥6). Representative images in Figure S7G. B, Concentric circles of distances used to measure phospho-eIF2α staining from nerves. C, Representative images of phospho-eIF2α staining around nerves (n) in PATU-8902 tumors from mice on AA or -SG diet. Overlay of concentric circles are shown. D, Quantification of phospho-eIF2α staining at several distances around nerves from C (n = 40 (AA) or 73 (-SG) independent nerves). E, Immunoblots of BIP levels from PATU-8902 tumors from mice on AA or –SG diet treated with and without LOXO-101. ERK2 serves as a loading control. F-G, Quantification of BIP levels (F) and NGF expression (G) normalized to ERK2 or 18S, respectively, of tumors from mice on AA or -SG diet, treated with vehicle or LOXO-101 (n≥6). H, Overall survival of PHGDH high and low expressing PDAC tumors from a TMA dataset. I, Representative images of high and low PHGDH and PGP9.5 (nerve) staining from PDAC tumors from human primary samples. J, PHGDH and PGP9.5 staining from PDAC tumors containing high levels of PHGDH or PGP9.5 from I. K, Expression of NGF and PHGDH from PDAC tumors expressing high levels of PHGDH and NGF from the TCGA dataset. “n” are displayed as individual points and represent the number of biologically independent replicates. Graphs represents median ± max/min, and were compared using one-way ANOVA, followed by Holm-Sidak post-hoc test (A, D, F-G). Pearson correlation values are represented by r (J-K). Scale bars are as indicated. *p<0.05, **p<0.01, ****p<0.0001. L, Proposed model depicting the interaction of exSer-independent and –dependent PDAC tumors and nerves in response to Ser-rich and –deprived regions in the tumor microenvironment. The main body of sensory and sympathetic neurons are located in nutrient replete environments of the DRG and sympathetic ganglion (SymG), respectively. Blocking nerve recruitment by TRK inhibitors, such as LOXO-101, can further decrease exSer-dependent PDAC tumor growth during Ser-limitation.

Comment in

References

    1. Abbaci M, Barberi-Heyob M, Blondel W, Guillemin F, and Didelon J. (2008). Advantages and limitations of commonly used methods to assay the molecular permeability of gap junctional intercellular communication. BioTechniques 45, 33–62. - PubMed
    1. Aloe L, Rocco ML, Bianchi P, and Manni L. (2012). Nerve growth factor: from the early discoveries to the potential clinical use. J Transl Med 10, 239. - PMC - PubMed
    1. Auciello FR, Bulusu V, Oon C, Tait-Mulder J, Berry M, Bhattacharyya S, Tumanov S, Allen-Petersen BL, Link J, Kendsersky ND, et al. (2019). A Stromal Lysolipid-Autotaxin Signaling Axis Promotes Pancreatic Tumor Progression. Cancer Discov 9, 617–627. - PMC - PubMed
    1. Biankin AV, Waddell N, Kassahn KS, Gingras MC, Muthuswamy LB, Johns AL, Miller DK, Wilson PJ, Patch AM, Wu J, et al. (2012). Pancreatic cancer genomes reveal aberrations in axon guidance pathway genes. Nature 491, 399–405. - PMC - PubMed
    1. Butterworth E, Dickerson W, Vijay V, Weitzel K, Cooper J, Atkinson EW, Coleman JE, Otto KJ, and Campbell-Thompson M. (2018). High Resolution 3D Imaging of the Human Pancreas Neuro-insular Network. J Vis Exp. - PMC - PubMed

Publication types

MeSH terms