

Reversed Neurovascular Coupling on Optical Coherence Tomography Angiography Is the Earliest Detectable Abnormality before Clinical Diabetic Retinopathy
- PMID: 33142724
- PMCID: PMC7692675
- DOI: 10.3390/jcm9113523
Reversed Neurovascular Coupling on Optical Coherence Tomography Angiography Is the Earliest Detectable Abnormality before Clinical Diabetic Retinopathy
Abstract
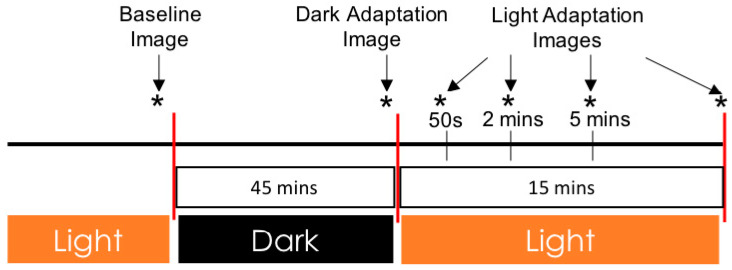
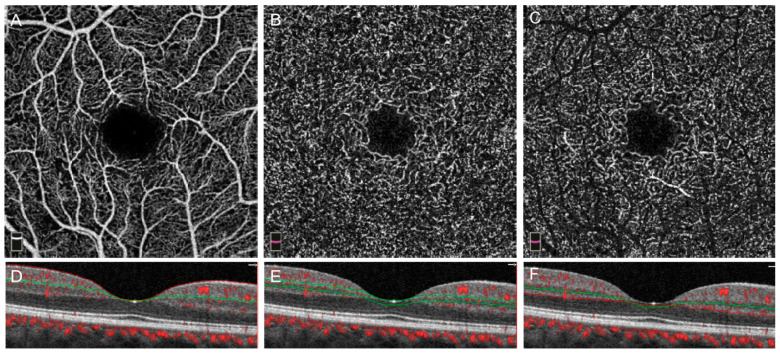
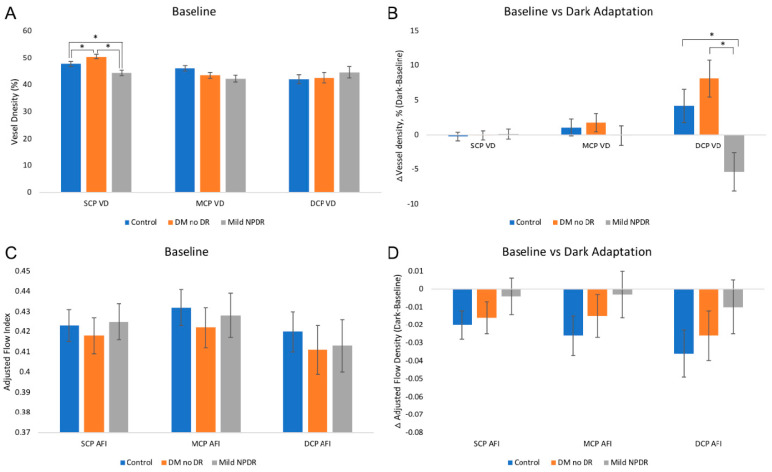
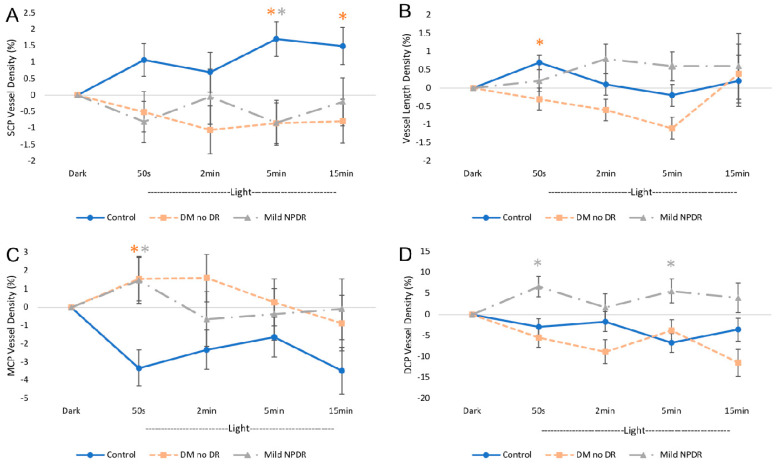
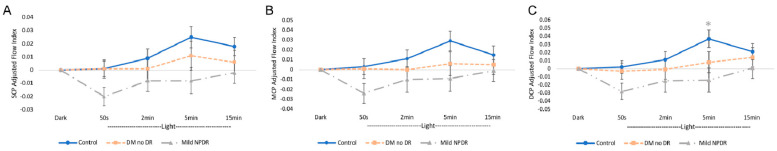
Diabetic retinopathy (DR) has traditionally been viewed as either a microvasculopathy or a neuropathy, though neurovascular coupling deficits have also been reported and could potentially be the earliest derangement in DR. To better understand neurovascular coupling in the diabetic retina, we investigated retinal hemodynamics by optical coherence tomography angiography (OCTA) in individuals with diabetes mellitus (DM) but without DR (DM no DR) and mild non-proliferative DR (mild NPDR) compared to healthy eyes. Using an experimental design to monitor the capillary responses during transition from dark adaptation to light, we examined 19 healthy, 14 DM no DR and 11 mild NPDR individuals. We found that the only structural vascular abnormality in the DM no DR group was increased superficial capillary plexus (SCP) vessel density (VD) compared to healthy eyes, while mild NPDR eyes showed significant vessel loss in the SCP at baseline. There was no significant difference in inner retinal thickness between the groups. During dark adaptation, the deep capillary plexus (DCP) VD was lower in mild NPDR individuals compared to the other two groups, which may leave the photoreceptors more susceptible to ischemia in the dark. When transitioning from dark to ambient light, both diabetic groups showed a qualitative reversal of VD trends in the SCP and middle capillary plexus (MCP), with significantly decreased SCP at 5 min and increased MCP VD at 50 s compared to healthy eyes, which may impede metabolic supply to the inner retina during light adaptation. Mild NPDR eyes also demonstrated DCP dilation at 50 s and 5 min and decreased adjusted flow index at 5 min in light. Our results show altered neurovascular responses in all three macular vascular plexuses in diabetic subjects in the absence of structural neuronal changes on high resolution imaging, suggesting that neurovascular uncoupling may be a key mechanism in the early pathogenesis of DR, well before the clinical appearance of vascular or neuronal loss.
Keywords: OCT angiography; dark adaptation; diabetic retinopathy; neurovascular coupling.
Conflict of interest statement
The authors declare no conflict of interest.
Figures
Similar articles
-
Acute Hyperglycemia Reverses Neurovascular Coupling During Dark to Light Adaptation in Healthy Subjects on Optical Coherence Tomography Angiography.Invest Ophthalmol Vis Sci. 2020 Apr 9;61(4):38. doi: 10.1167/iovs.61.4.38. Invest Ophthalmol Vis Sci. 2020. PMID: 32340033 Free PMC article.
-
Associations Between Diabetic Retinal Microvasculopathy and Neuronal Degeneration Assessed by Swept-Source OCT and OCT Angiography.Front Med (Lausanne). 2021 Dec 10;8:778283. doi: 10.3389/fmed.2021.778283. eCollection 2021. Front Med (Lausanne). 2021. PMID: 34957152 Free PMC article.
-
Analysis of retinal and choroidal characteristics in patients with early diabetic retinopathy using WSS-OCTA.Front Endocrinol (Lausanne). 2023 May 24;14:1184717. doi: 10.3389/fendo.2023.1184717. eCollection 2023. Front Endocrinol (Lausanne). 2023. PMID: 37293481 Free PMC article.
-
Caffeine Delays Retinal Neurovascular Coupling during Dark to Light Adaptation in Healthy Eyes Revealed by Optical Coherence Tomography Angiography.Invest Ophthalmol Vis Sci. 2020 Apr 9;61(4):37. doi: 10.1167/iovs.61.4.37. Invest Ophthalmol Vis Sci. 2020. PMID: 32340030 Free PMC article.
-
Diabetes Mellitus and Neurovascular Pathology: A Comprehensive Review of Retinal and Brain Lesions.Cureus. 2024 Oct 1;16(10):e70611. doi: 10.7759/cureus.70611. eCollection 2024 Oct. Cureus. 2024. PMID: 39483560 Free PMC article. Review.
Cited by
-
CSANet: a lightweight channel and spatial attention neural network for grading diabetic retinopathy with optical coherence tomography angiography.Quant Imaging Med Surg. 2024 Feb 1;14(2):1820-1834. doi: 10.21037/qims-23-1270. Epub 2024 Jan 23. Quant Imaging Med Surg. 2024. PMID: 38415109 Free PMC article.
-
Retinal Vascular Density and Thickness in Long-Term Type 1 Diabetes Without Visible Vascular Signs of Retinopathy.J Clin Med. 2025 Feb 8;14(4):1082. doi: 10.3390/jcm14041082. J Clin Med. 2025. PMID: 40004613 Free PMC article.
-
Retinal vascular reactivity in carriers of X-linked inherited retinal disease - a study using optical coherence tomography angiography.Front Ophthalmol (Lausanne). 2024 Jul 9;4:1415393. doi: 10.3389/fopht.2024.1415393. eCollection 2024. Front Ophthalmol (Lausanne). 2024. PMID: 39045093 Free PMC article.
-
Associations of retinal neurovascular dysfunction with inner retinal layer thickness in non-proliferative diabetic retinopathy.Graefes Arch Clin Exp Ophthalmol. 2024 Dec;262(12):3761-3771. doi: 10.1007/s00417-024-06552-4. Epub 2024 Jun 15. Graefes Arch Clin Exp Ophthalmol. 2024. PMID: 38878068 Free PMC article.
-
Volumetric Measures of Capillary Nonperfusion on Optical Coherence Tomography Angiography Detect Early Ischemia in Diabetes Without Retinopathy.Invest Ophthalmol Vis Sci. 2025 Apr 1;66(4):2. doi: 10.1167/iovs.66.4.2. Invest Ophthalmol Vis Sci. 2025. PMID: 40168154 Free PMC article.
References
-
- Nesper P.L., Roberts P.K., Onishi A.C., Chai H., Liu L., Jampol L.M., Fawzi A.A. Quantifying Microvascular Abnormalities With Increasing Severity of Diabetic Retinopathy Using Optical Coherence Tomography Angiography. Investig. Ophthalmol. Vis. Sci. 2017;58:BIO307–BIO315. doi: 10.1167/iovs.17-21787. - DOI - PMC - PubMed
-
- Durbin M.K., An L., Shemonski N.D., Soares M., Santos T., Lopes M., Neves C., Cunha-Vaz J. Quantification of Retinal Microvascular Density in Optical Coherence Tomographic Angiography Images in Diabetic Retinopathy. JAMA Ophthalmol. 2017;135:370–376. doi: 10.1001/jamaophthalmol.2017.0080. - DOI - PMC - PubMed
Grants and funding
LinkOut - more resources
Full Text Sources
Miscellaneous
