. 2020 Oct 31;21(21):8153.
doi: 10.3390/ijms21218153.

Cancer-Associated Fibroblasts Differentiated by Exosomes Isolated from Cancer Cells Promote Cancer Cell Invasion

Affiliations

Cancer-Associated Fibroblasts Differentiated by Exosomes Isolated from Cancer Cells Promote Cancer Cell Invasion

Kimin Kim et al. Int J Mol Sci. .

Abstract

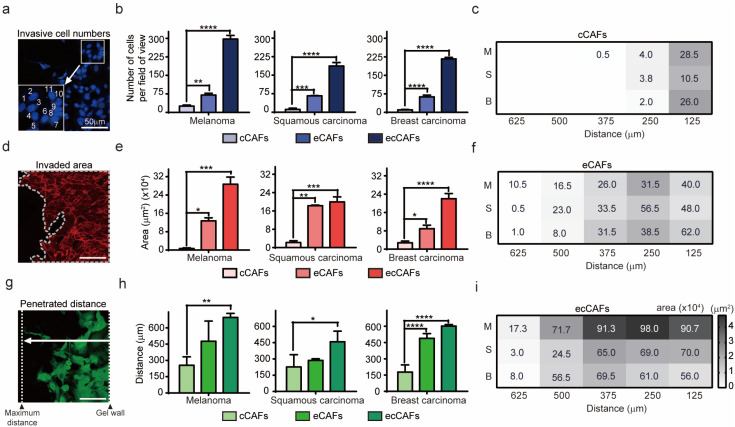
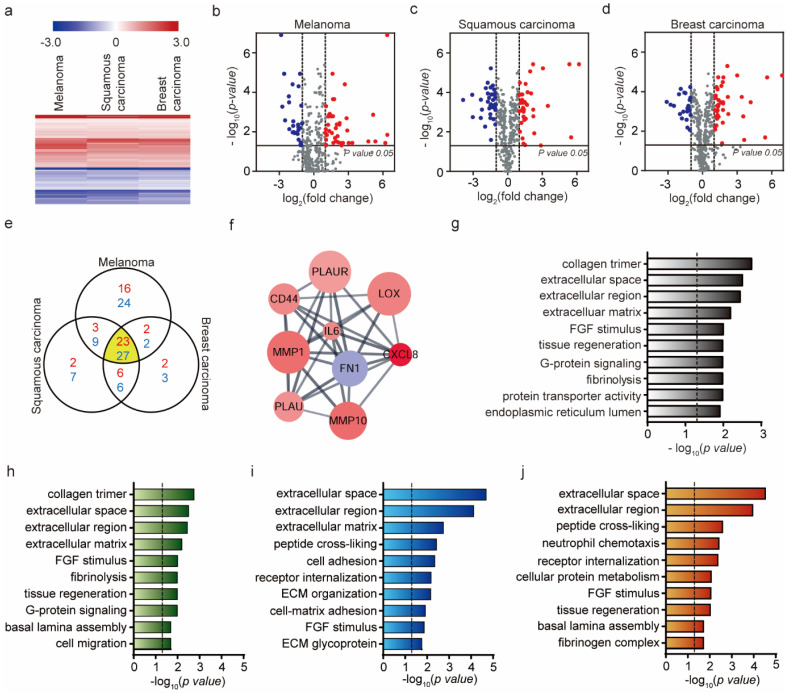
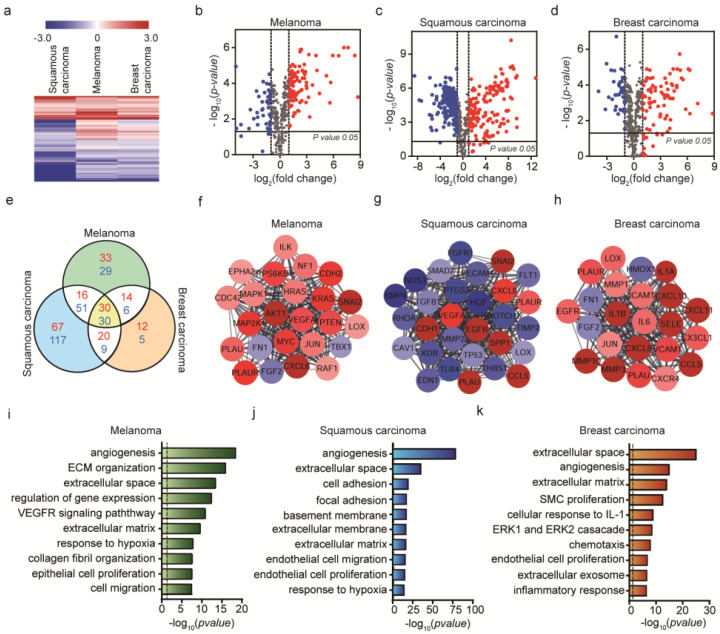
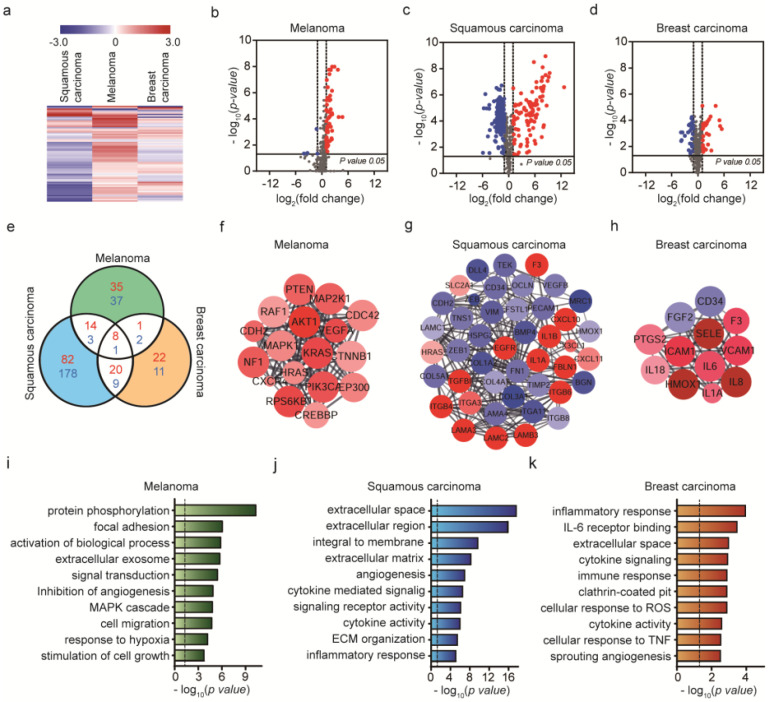
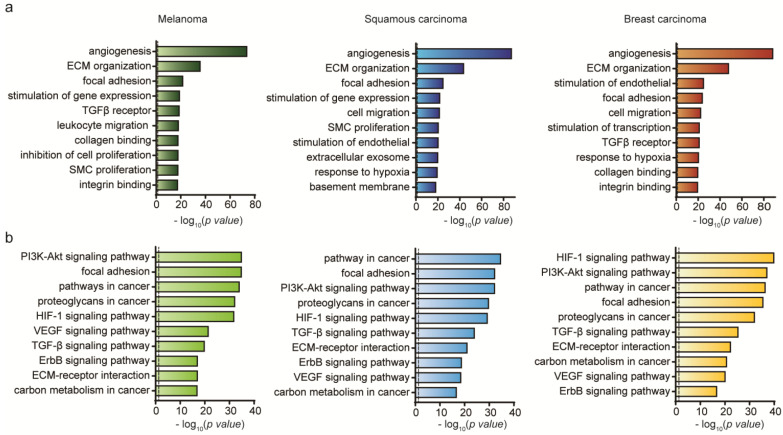
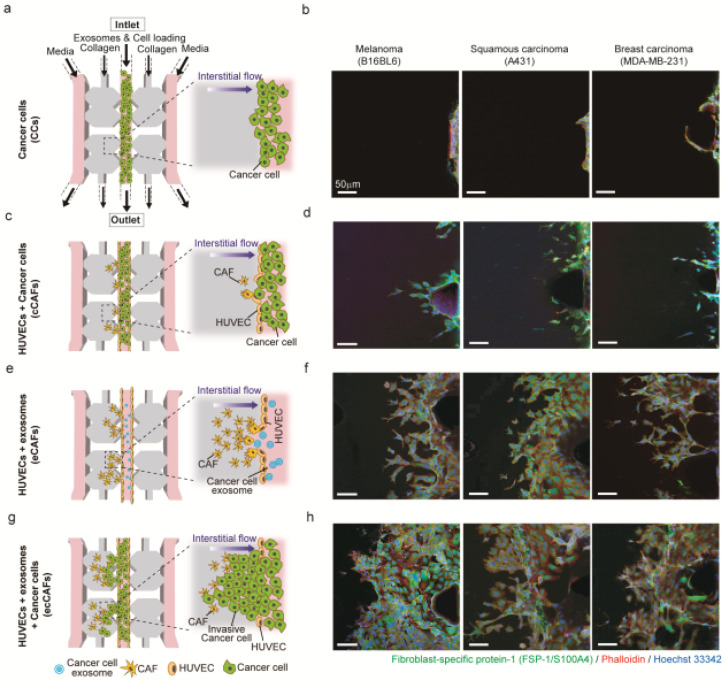
Cancer-associated fibroblasts (CAFs) in the cancer microenvironment play an essential role in metastasis. Differentiation of endothelial cells into CAFs is induced by cancer cell-derived exosomes secreted from cancer cells that transfer molecular signals to surrounding cells. Differentiated CAFs facilitate migration of cancer cells to different regions through promoting extracellular matrix (ECM) modifications. However, in vitro models in which endothelial cells exposed to cancer cell-derived exosomes secreted from various cancer cell types differentiate into CAFs or a microenvironmentally controlled model for investigating cancer cell invasion by CAFs have not yet been studied. In this study, we propose a three-dimensional in vitro cancer cell invasion model for real-time monitoring of the process of forming a cancer invasion site through CAFs induced by exosomes isolated from three types of cancer cell lines. The invasiveness of cancer cells with CAFs induced by cancer cell-derived exosomes (eCAFs) was significantly higher than that of CAFs induced by cancer cells (cCAFs) through physiological and genetic manner. In addition, different genetic tendencies of the invasion process were observed in the process of invading cancer cells according to CAFs. Our 3D microfluidic platform helps to identify specific interactions among multiple factors within the cancer microenvironment and provides a model for cancer drug development.

Keywords: 3D microfluidics; cancer cell invasion; cancer cell-derived exosomes; cancer-associated fibroblasts; invasive cancer cells.


Conflict of interest statement

The authors have no conflicts of interest to declare.

Figures

Figure 1
Figure 1
Physiological evidence of CAF-induced invasion. (a,d,g) Schematic diagram showing the measurement analysis process of cancer cell invasion. Scale bar: 50 μm. (b,e,h) Comparison of the number, distance, area and invasiveness of the three different cancer cell types. (c,f,i) Analysis of invasiveness based on area of invasive cells in relation to distance travelled into the ECM matrix. Larger areas are represented by darker color. The numbers indicate the degree of invasiveness of cells (M: Melanoma; S: Squamous carcinoma; B: Breast carcinoma). Data are presented as means ± SEM (* p-value < 0.05, ** p-value < 0.01, *** p-value < 0.001, **** p-value < 0.0001).
Figure 2
Figure 2
Identification of differentially expressed genes from eCAFs and their biological functions. (a) Hierarchical clustering of expression profiles of differentially expressed mRNAs among three eCAFs (the eCAFs were produced by the exosomes extracted from B16BL6, A431 and MDA-MB-231 cells) (p-value < 0.05). Red color indicates high relative expression and blue indicates low relative expression. (bd) Volcano plot showing gene expression differences among the three eCAFs. Red, DE genes with log2 (fold change) > 1; blue, DE genes with log2 (fold change) < −1. (e) Venn diagram showing differentially expressed overlapping gene numbers for three eCAFs. The number of overlapping regions shows the largest number of differentially expressed genes. Red represents log2 (fold change) > 1 and blue represents log2 (fold change) < −1. (f) Top module of the protein–protein interaction (PPI) network for densely connected nodes. Red, DE genes with log2 (fold change) > 1; blue, DE genes with log2 (fold change) < −1. Larger node size is associated with a more significant p-value. (g) Gene ontology (GO) term enrichment analysis of common mRNA expression in three eCAFs (p-value < 0.05, | log2 (fold change) | > 1). (hj) Gene ontology (GO) term enrichment analysis of expressed mRNA; B16BL6, A431, MDA-MB-231 cells (p-value < 0.05, | log2 (fold change) | > 1). The dashed line signifies p-value of 0.05.
Figure 3
Figure 3
Identification of differentially expressed genes from cCAFs and their biological functions. (a) Hierarchical clustering of expression profiles of differentially expressed mRNAs among the three cell lines (p < 0.05). Red color indicates high relative expression and blue indicates low relative expression. (bd) Volcano plot showing gene expression differences among the three cell lines, with red representing DE genes with log2 (fold change) > 1 and blue representing DE genes with log2 (fold change) < −1. (e) Venn diagram showing the significant gene numbers for the three cancer cell lines. Red represents log2 (fold change) > 1 and blue log2 (fold change) < −1. Comparison of DE gene expression levels with cCAFs and HUVECs. (fh) Top module of the protein–protein interaction (PPI) network for densely connected nodes. Red, DE genes with log2 (fold change) > 1; blue, DE genes with log2 (fold change) < −1. Larger node size represents more significant p-values. (ik) Gene ontology (GO) term enrichment analysis of mRNA expression in B16BL6, A431 and MDA-MB-231 cells (p-value < 0.05, | log2 (fold change) | > 1). The dashed line signifies a p-value of 0.05.
Figure 4
Figure 4
Identification of genes and functions associated with cancer invasion model created by the exosome-induced CAFs (ecCAFs). (a) Hierarchical clustering of expression profiles of invasiveness of cancer cells created by the exosome-induced CAFs (p-value < 0.05). Red color scale indicates high relative expression and blue indicates low relative expression. (bd) Volcano plot showing gene expression differences among the three cell lines, with red representing DE genes with log2 (fold change) > 1 and blue representing DE genes with log2 (fold change) < −1. (e) Venn diagram showing the significant gene numbers for the invasiveness of cancer cells. Comparison of DE gene expression levels with ecCAFs and eCAFs. Red represents log2 (fold change) > 1 and blue log2 (fold change) < −1. (fh) Top module of protein–protein interaction (PPI) network for densely connected nodes. Red, DEs with log2 (fold change) > 1; blue, DEs with log2 (fold change) < −1. Larger node size represents more significant p-values. (ik) Gene ontology (GO) term enrichment analysis of mRNA expression in B16BL6, A431 and MDA-MB-231 cells (p-value < 0.05, |log2 (fold change)| > 1). The dashed line signifies a p-value of 0.05.
Figure 5
Figure 5
Comparative expression profiling of cancer invasion between ecCAFs and cCAFs. (a) Gene ontology (GO) term enrichment analysis of differentially expressed mRNAs in B16BL6, A431 and MDA-MB-231 cells (p-value < 0.05, | log2 (fold change) | > 1). (b) KEGG pathway analysis of differentially expressed mRNAs in B16BL6, A431 and MDA-MB-2321 cells (p-value < 0.05, |log2 (fold change)| > 1). The dashed line signifies a p-value of 0.05.
Figure 6
Figure 6
Three-dimensional microfluidic model for cancer cell invasion. (a,c,e,g) Schematic diagram showing the progression of cancer invasion; (b,d,f,h) confocal images of only cancer cells (CCs) free of human umbilical vein endothelial cells (HUVECs), differentiated cancer-associated fibroblasts (CAFs) induced by cancer cells (cCAFs) or cancer cell-derived exosomes (eCAFs), and cancer invasion created by the exosome-induced CAFs (ecCAFs) from melanoma (B16BL6), squamous carcinoma (A431) and breast carcinoma (MDA-MB-231) cells. This 3D microfluidic model includes an endothelial monolayer composed of HUVECs, CAFs (yellow) induced by cancer cell-derived exosomes (blue) and 3D collagen matrix (gray). Then cancer cells (green) were injected to develop a cancer invasion model. Scale bar: 50 μm.

References

    1. Friedl P., Wolf K. Tumour-cell invasion and migration: Diversity and escape mechanisms. Nat. Rev. Cancer. 2003;3:362–374. doi: 10.1038/nrc1075. - DOI - PubMed
    1. Steeg P.S. Targeting metastasis. Nat. Rev. Cancer. 2016;16:201–218. doi: 10.1038/nrc.2016.25. - DOI - PMC - PubMed
    1. Weidner N., Semple J.P., Welch W.R., Folkman J. Tumor angiogenesis and metastasis—correlation in invasive breast carcinoma. N. Engl. J. Med. 1991;324:1–8. doi: 10.1056/NEJM199101033240101. - DOI - PubMed
    1. Hunter K.W., Crawford N.P., Alsarraj J. Mechanisms of metastasis. Breast Cancer Res. 2008;10:S2. doi: 10.1186/bcr1988. - DOI - PMC - PubMed
    1. Joyce J.A., Pollard J.W. Microenvironmental regulation of metastasis. Nat. Rev. Cancer. 2009;9:239–252. doi: 10.1038/nrc2618. - DOI - PMC - PubMed

MeSH terms

Substances