Protein Kinase C Alpha Cellular Distribution, Activity, and Proximity with Lamin A/C in Striated Muscle Laminopathies
- PMID: 33142761
- PMCID: PMC7693451
- DOI: 10.3390/cells9112388
Protein Kinase C Alpha Cellular Distribution, Activity, and Proximity with Lamin A/C in Striated Muscle Laminopathies
Abstract
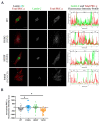
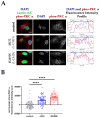
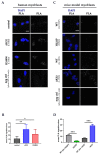
Striated muscle laminopathies are cardiac and skeletal muscle conditions caused by mutations in the lamin A/C gene (LMNA). LMNA codes for the A-type lamins, which are nuclear intermediate filaments that maintain the nuclear structure and nuclear processes such as gene expression. Protein kinase C alpha (PKC-α) interacts with lamin A/C and with several lamin A/C partners involved in striated muscle laminopathies. To determine PKC-α's involvement in muscular laminopathies, PKC-α's localization, activation, and interactions with the A-type lamins were examined in various cell types expressing pathogenic lamin A/C mutations. The results showed aberrant nuclear PKC-α cellular distribution in mutant cells compared to WT. PKC-α activation (phos-PKC-α) was decreased or unchanged in the studied cells expressing LMNA mutations, and the activation of its downstream targets, ERK 1/2, paralleled PKC-α activation alteration. Furthermore, the phos-PKC-α-lamin A/C proximity was altered. Overall, the data showed that PKC-α localization, activation, and proximity with lamin A/C were affected by certain pathogenic LMNA mutations, suggesting PKC-α involvement in striated muscle laminopathies.
Keywords: DCM; EDMD; L-CMD; lamin A/C; protein kinase C alpha; striated muscle laminopathies.
Conflict of interest statement
The authors declare no conflict of interest.
Figures


Similar articles
-
Need for NAD+: Focus on Striated Muscle Laminopathies.Cells. 2020 Oct 7;9(10):2248. doi: 10.3390/cells9102248. Cells. 2020. PMID: 33036437 Free PMC article. Review.
-
Cellular and Animal Models of Striated Muscle Laminopathies.Cells. 2019 Mar 29;8(4):291. doi: 10.3390/cells8040291. Cells. 2019. PMID: 30934932 Free PMC article. Review.
-
A CRISPR/Cas9 zebrafish lamin A/C mutant model of muscular laminopathy.Dev Dyn. 2022 Apr;251(4):645-661. doi: 10.1002/dvdy.427. Epub 2021 Oct 18. Dev Dyn. 2022. PMID: 34599606
-
The non-muscle ADF/cofilin-1 controls sarcomeric actin filament integrity and force production in striated muscle laminopathies.Cell Rep. 2021 Aug 24;36(8):109601. doi: 10.1016/j.celrep.2021.109601. Cell Rep. 2021. PMID: 34433058 Free PMC article.
-
Caenorhabditis elegans models for striated muscle disorders caused by missense variants of human LMNA.PLoS Genet. 2023 Aug 25;19(8):e1010895. doi: 10.1371/journal.pgen.1010895. eCollection 2023 Aug. PLoS Genet. 2023. PMID: 37624850 Free PMC article.
Cited by
-
Transcriptome Sequencing Analysis of circRNA in Skeletal Muscle between Fast- and Slow-Growing Chickens at Embryonic Stages.Animals (Basel). 2022 Nov 16;12(22):3166. doi: 10.3390/ani12223166. Animals (Basel). 2022. PMID: 36428392 Free PMC article.
-
Flotillin-1 enhances radioresistance through reducing radiation-induced DNA damage and promoting immune escape via STING signaling pathway in non-small cell lung cancer.Cancer Biol Ther. 2023 Dec 31;24(1):2203332. doi: 10.1080/15384047.2023.2203332. Cancer Biol Ther. 2023. PMID: 37131290 Free PMC article.
References
-
- Pinto Y.M., Elliott P.M., Arbustini E., Adler Y., Anastasakis A., Böhm M., Duboc D., Gimeno J., de Groote P., Imazio M., et al. Proposal for a revised definition of dilated cardiomyopathy, hypokinetic non-dilated cardiomyopathy, and its implications for clinical practice: A position statement of the ESC working group on myocardial and pericardial diseases. Eur. Heart. J. 2016;37:1850–1858. doi: 10.1093/eurheartj/ehv727. - DOI - PubMed
-
- Taylor M.R., Fain P.R., Sinagra G., Robinson M.L., Robertson A.D., Carniel E., Lenarda A.D., Bohlmeyer T.J., Ferguson D.A., Brodsky G.L., et al. Natural history of dilated cardiomyopathy due to lamin A/C gene mutations. J. Am. Coll. Cardiol. 2003;41:771–780. doi: 10.1016/S0735-1097(02)02954-6. - DOI - PubMed
Publication types
MeSH terms
Substances
Grants and funding
LinkOut - more resources
Full Text Sources
Miscellaneous

