. 2020 Oct 31;8(11):468.
doi: 10.3390/biomedicines8110468.

Breath Ammonia Is a Useful Biomarker Predicting Kidney Function in Chronic Kidney Disease Patients

Affiliations

Breath Ammonia Is a Useful Biomarker Predicting Kidney Function in Chronic Kidney Disease Patients

Ming-Jen Chan et al. Biomedicines. .

Abstract

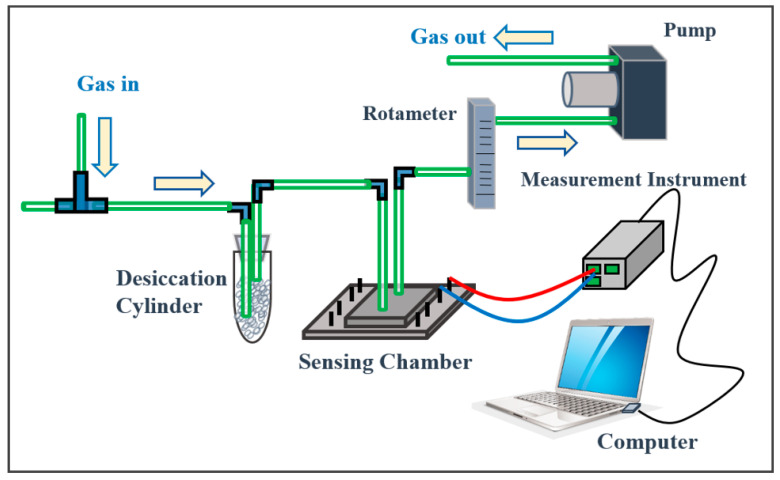
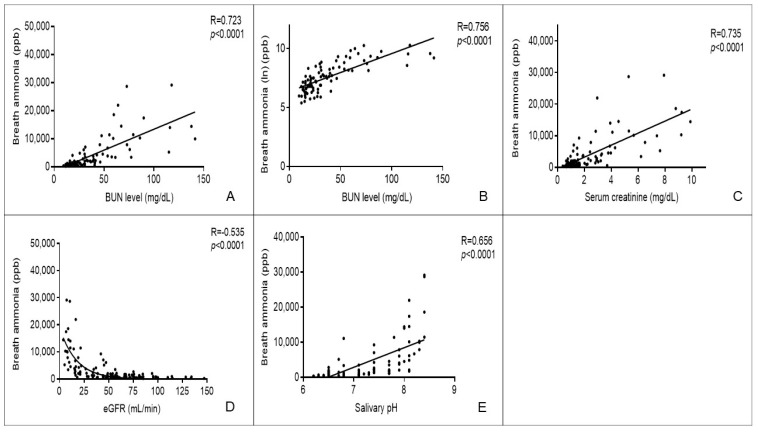
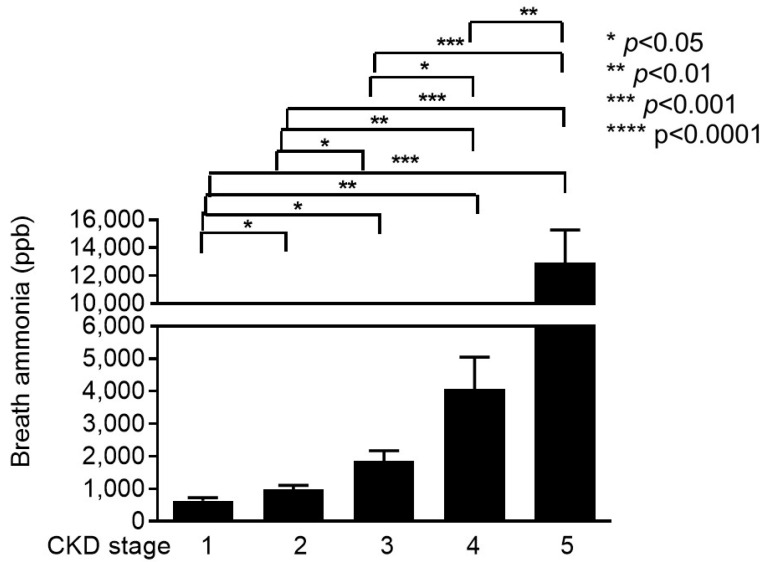
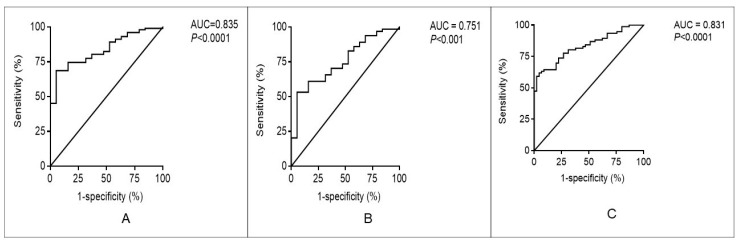
Chronic kidney disease (CKD) is a public health problem and its prevalence has increased worldwide; patients are commonly unaware of the condition. The present study aimed to investigate whether exhaled breath ammonia via vertical-channel organic semiconductor (V-OSC) sensor measurement could be used for rapid CKD screening. We enrolled 121 CKD stage 1-5 patients, including 19 stage 1 patients, 26 stage 2 patients, 38 stage 3 patients, 21 stage 4 patients, and 17 stage 5 patients, from July 2019 to January 2020. Demographic and laboratory data were recorded. The exhaled ammonia was collected and rapidly measured by the V-OSC sensor to correlate with kidney function. Results showed no significant difference in age, sex, body weight, hemoglobin, albumin level, and comorbidities in different CKD stage patients. Correlation analysis demonstrated a good correlation between breath ammonia and blood urea nitrogen levels, serum creatinine levels, and estimated glomerular filtration rate (eGFR). Breath ammonia concentration was significantly elevated with increased CKD stage compared with the previous stage (CKD stage 1/2/3/4/5: 636 ± 94; 1020 ± 120; 1943 ± 326; 4421 ± 1042; 12781 ± 1807 ppb, p < 0.05). The receiver operating characteristic curve analysis showed an area under the curve (AUC) of 0.835 (p < 0.0001) for distinguishing CKD stage 1 from other CKD stages at 974 ppb (sensitivity, 69%; specificity, 95%). The AUC was 0.831 (p < 0.0001) for distinguishing between patients with/without eGFR < 60 mL/min/1.73 m2 (cutoff 1187 ppb: sensitivity, 71%; specificity, 78%). At 886 ppb, the sensitivity increased to 80% but the specificity decreased to 69%. This value is suitable for kidney function screening. Breath ammonia detection with V-OSC is a real time, inexpensive, and easy to administer measurement device for screening CKD with reliable diagnostic accuracy.

Keywords: chronic kidney disease; exhaled ammonia; vertical-channel organic semiconductor sensor.


Conflict of interest statement

All authors declare no conflict of interest. The funders had no role in the design of the study; in the collection, analyses, or interpretation of data; in the writing of the manuscript, or in the decision to publish the results.

Figures

Figure 1
Figure 1
The sensing system includes a desiccation cylinder, an airtight sensing chamber, a rotameter, a pump, and an electrical signal measurement instrument (Keysight U2722A USB Modular Source Measure Unit).
Figure 2
Figure 2
Correlation between breath ammonia and salivary pH value, blood urea nitrogen (BUN), serum creatinine, and estimated glomerular filtration rate. (A) Correlation between breath ammonia concentration and BUN level. (B) Correlation between breath ammonia concentration (natural logarithm) and BUN level. (C) Correlation between breath ammonia concentration and serum creatinine level. (D) Correlation between breath ammonia concentration and estimated glomerular filtration rate (eGFR). (E) Correlation between breath ammonia concentration and salivary pH.
Figure 3
Figure 3
Breath ammonia concentration in patients with chronic kidney disease stage 1–5. Exhaled breath ammonia concentrations were measured in chronic kidney disease (CKD) stage 1–5 patients. Box plot is used to display breath ammonia concentration in different CKD group, and significant differences between groups are indicated (*, p < 0.05; **, p < 0.01; ***, p < 0.001; ****, p < 0.0001).
Figure 4
Figure 4
The receiver operating characteristic curve analysis to determine the predictive value of breath ammonia concentration to distinguish between different chronic kidney disease groups. (A) The receiver operating characteristic curve analysis for breath ammonia to distinguish between CKD stage 1 and other CKD stages (2–5). (B) The ROC curve analysis for breath ammonia to distinguish between CKD stage 1 patients and CKD stage 2 and 3 patients. (C) The ROC curve analysis for breath ammonia to distinguish patients between patients with eGFR 60 mL/min/1.73 m2 and patients with eGFR < 60 mL/min/1.73 m2. AUC: area under curve.

References

    1. Cooper C. Global, regional, and national age-sex specific mortality for 264 causes of death, 1980–2016: A systematic analysis for the Global Burden of Disease Study 2016. Lancet. 2017;390:1151–1210. doi: 10.1016/S0140-6736(17)32152-9. - DOI - PMC - PubMed
    1. Hill N.R., Fatoba S.T., Oke J.L., Hirst J.A., O’Callaghan C.A., Lasserson D.S., Hobbs F.D. Global Prevalence of Chronic Kidney Disease—A Systematic Review and Meta-Analysis. PLoS ONE. 2016;11:e0158765. doi: 10.1371/journal.pone.0158765. - DOI - PMC - PubMed
    1. Silva Junior G.B.D., Oliveira J.G.R., Oliveira M.R.B., Vieira L., Dias E.R. Global costs attributed to chronic kidney disease: A systematic review. Rev. Assoc. Med. Bras. 2018;64:1108–1116. doi: 10.1590/1806-9282.64.12.1108. - DOI - PubMed
    1. Verhave J.C., Troyanov S., Mongeau F., Fradette L., Bouchard J., Awadalla P., Madore F. Prevalence, awareness, and management of CKD and cardiovascular risk factors in publicly funded health care. Clin. J. Am. Soc. Nephrol. 2014;9:713–719. doi: 10.2215/CJN.06550613. - DOI - PMC - PubMed
    1. Nickolas T.L., Frisch G.D., Opotowsky A.R., Arons R., Radhakrishnan J. Awareness of kidney disease in the US population: Findings from the National Health and Nutrition Examination Survey (NHANES) 1999 to 2000. Am. J. Kidney Dis. 2004;44:185–197. doi: 10.1053/j.ajkd.2004.04.023. - DOI - PubMed