

Early Retinal Changes by OCT Angiography and Multifocal Electroretinography in Diabetes
- PMID: 33143008
- PMCID: PMC7692230
- DOI: 10.3390/jcm9113514
Early Retinal Changes by OCT Angiography and Multifocal Electroretinography in Diabetes
Abstract
Background: To evaluate the earliest retinal morphological and functional changes in diabetic eyes without or with early signs of diabetic retinopathy (DR).
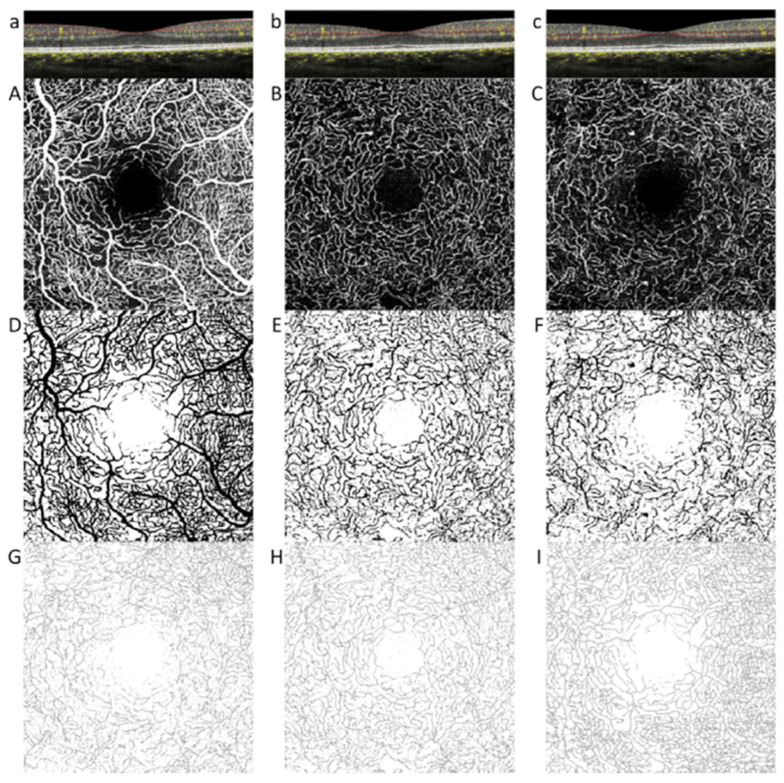
Methods: Twenty-two eyes with no DR (noDR group), 22 eyes with mild DR (DR group), and 18 healthy nondiabetic eyes (controls) were enrolled. All eyes were studied by means of spectral domain optical coherence tomography (OCT), OCT angiography (OCTA), and multifocal electroretinogram (mfERG).
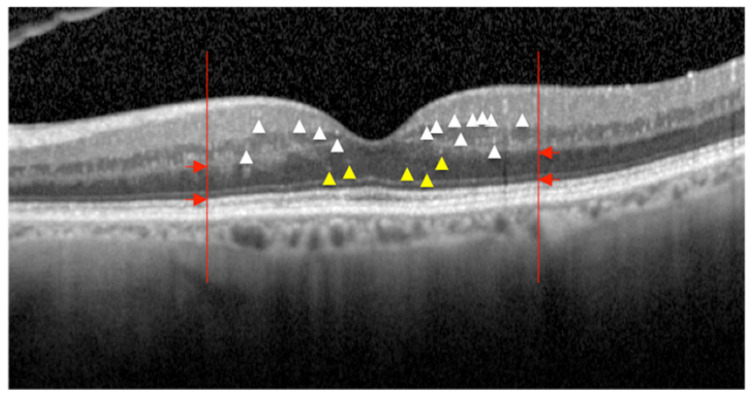
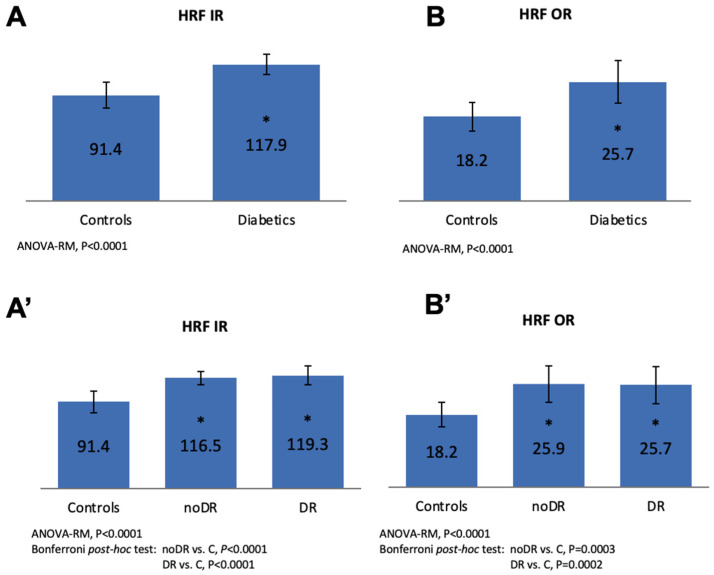
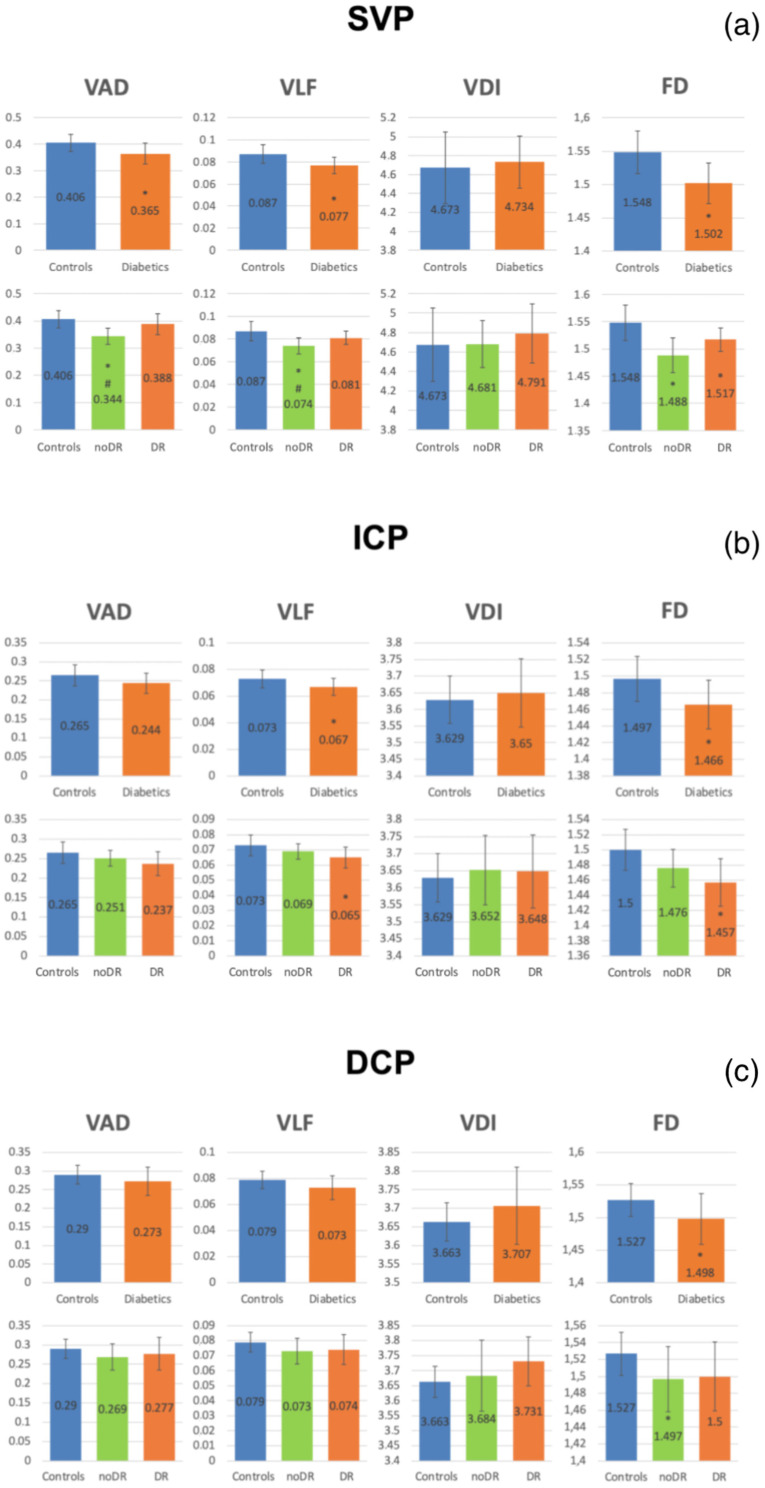
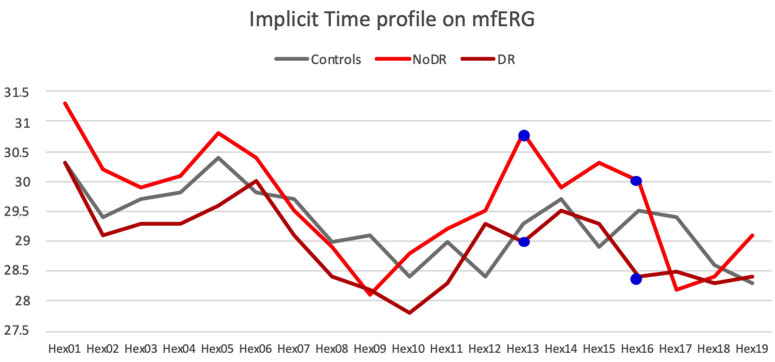
Results: A significantly higher number of OCT hyperreflective intraretinal foci (HRF) was found in both noDR and DR groups versus controls, but not between DR groups. The OCTA parameters of the superficial vascular plexus (SVP) were significantly reduced in the noDR group both versus controls and DR group (p < 0.05). The OCTA parameters of the intermediate capillary plexus (ICP) were significantly reduced in the DR group versus controls. An increased number of altered hexagons on mfERG was found in the noDR versus the DR group (p = 0.0192).
Conclusions: Retinal vascular and functional parameters are differently involved in diabetic eyes; major vascular changes in the SVP and functional alterations of the mfERG are present in diabetic eyes with no clinical microvascular signs of DR, while ICP is mainly involved when early ophthalmoscopic signs of DR are present. The integrated use of mfERG and OCTA provides new significant insights into the pathogenesis of diabetic related retinal disease.
Keywords: diabetic retinopathy; early stages; hyperreflective intraretinal spots; microaneurysms; morpho-functional correlation; multifocal electroretinography; optical coherence tomography; optical coherence tomography angiography; retinal layers; vascular plexuses.
Conflict of interest statement
The authors declare no conflict of interest.
Figures
Similar articles
-
Early Microvascular and Oscillatory Potentials Changes in Human Diabetic Retina: Amacrine Cells and the Intraretinal Neurovascular Crosstalk.J Clin Med. 2021 Sep 7;10(18):4035. doi: 10.3390/jcm10184035. J Clin Med. 2021. PMID: 34575150 Free PMC article.
-
Correlation between optical coherence tomography angiography and multifocal electroretinogram findings in patients with diabetes mellitus.Photodiagnosis Photodyn Ther. 2021 Dec;36:102558. doi: 10.1016/j.pdpdt.2021.102558. Epub 2021 Sep 28. Photodiagnosis Photodyn Ther. 2021. PMID: 34597834
-
Retinal Microvascular and Neuronal Changes Are Also Present, Even If Differently, in Adolescents with Type 1 Diabetes without Clinical Diabetic Retinopathy.J Clin Med. 2022 Jul 8;11(14):3982. doi: 10.3390/jcm11143982. J Clin Med. 2022. PMID: 35887746 Free PMC article.
-
The diagnostic value of optical coherence tomography angiography in diabetic retinopathy: a systematic review.Int Ophthalmol. 2019 Oct;39(10):2413-2433. doi: 10.1007/s10792-018-1034-8. Epub 2018 Oct 31. Int Ophthalmol. 2019. PMID: 30382465
-
Vascular Changes and Neurodegeneration in the Early Stages of Diabetic Retinopathy: Which Comes First?Ophthalmic Res. 2016;56(1):1-9. doi: 10.1159/000444498. Epub 2016 Apr 2. Ophthalmic Res. 2016. PMID: 27035578 Review.
Cited by
-
Retinal vessel tortuosity and fractal dimension in diabetic retinopathy.Int J Retina Vitreous. 2025 Jun 12;11(1):64. doi: 10.1186/s40942-025-00688-z. Int J Retina Vitreous. 2025. PMID: 40506774 Free PMC article.
-
Early Microvascular and Oscillatory Potentials Changes in Human Diabetic Retina: Amacrine Cells and the Intraretinal Neurovascular Crosstalk.J Clin Med. 2021 Sep 7;10(18):4035. doi: 10.3390/jcm10184035. J Clin Med. 2021. PMID: 34575150 Free PMC article.
-
Metabolomic analysis of aqueous humor reveals potential metabolite biomarkers for differential detection of macular edema.Eye Vis (Lond). 2023 Apr 1;10(1):14. doi: 10.1186/s40662-023-00331-8. Eye Vis (Lond). 2023. PMID: 37004107 Free PMC article.
-
Hyperreflective Foci and Subretinal Fluid Are Potential Imaging Biomarkers to Evaluate Anti-VEGF Effect in Diabetic Macular Edema.Front Physiol. 2021 Dec 23;12:791442. doi: 10.3389/fphys.2021.791442. eCollection 2021. Front Physiol. 2021. PMID: 35002773 Free PMC article.
-
Significance of Hyperreflective Foci as an Optical Coherence Tomography Biomarker in Retinal Diseases: Characterization and Clinical Implications.J Ophthalmol. 2021 Dec 17;2021:6096017. doi: 10.1155/2021/6096017. eCollection 2021. J Ophthalmol. 2021. PMID: 34956669 Free PMC article. Review.
References
-
- Antonetti D.A., Barber A.J., Khin S., Lieth E., Tarbell J.M., Gardner T.W. Vascular permeability in experimental diabetes is associated with reduced endothelial occludin content: Vascular endothelial growth factor decreases occludin in retinal endothelial cells. Penn State Retina Research Group. Diabetes. 1998;47:1953–1959. doi: 10.2337/diabetes.47.12.1953. - DOI - PubMed
-
- Chan G., Balaratnasingam C., Xu J., Mammo Z., Han S., MacKenzie P., Merkur A., Kirker A., Albiani D., Sarunic M.V., et al. In vivo optical imaging of human retinal capillary networks using speckle variance optical coherence tomography with quantitative clinico-histological correlation. Microvasc. Res. 2015;100:32–39. doi: 10.1016/j.mvr.2015.04.006. - DOI - PubMed
-
- De Carlo T.E., Chin A.T., Bonini Filho M.A., Adhi M., Branchini L., Salz D.A., Baumal C.R., Crawford C., Reichel E., Witkin A.J., et al. Detection of microvascular changes in eyes of patients with diabetes but not clinical diabetic retinopathy using optical coherence tomography angiography. Retina. 2015;35:2364–2370. doi: 10.1097/IAE.0000000000000882. - DOI - PubMed
LinkOut - more resources
Full Text Sources
