

Phenolic Compounds Reduce the Fat Content in Caenorhabditis elegans by Affecting Lipogenesis, Lipolysis, and Different Stress Responses
- PMID: 33143060
- PMCID: PMC7693530
- DOI: 10.3390/ph13110355
Phenolic Compounds Reduce the Fat Content in Caenorhabditis elegans by Affecting Lipogenesis, Lipolysis, and Different Stress Responses
Abstract
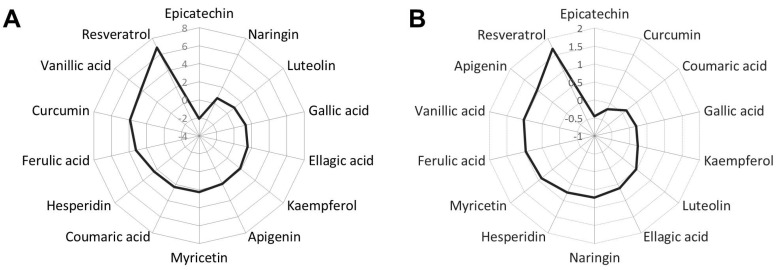
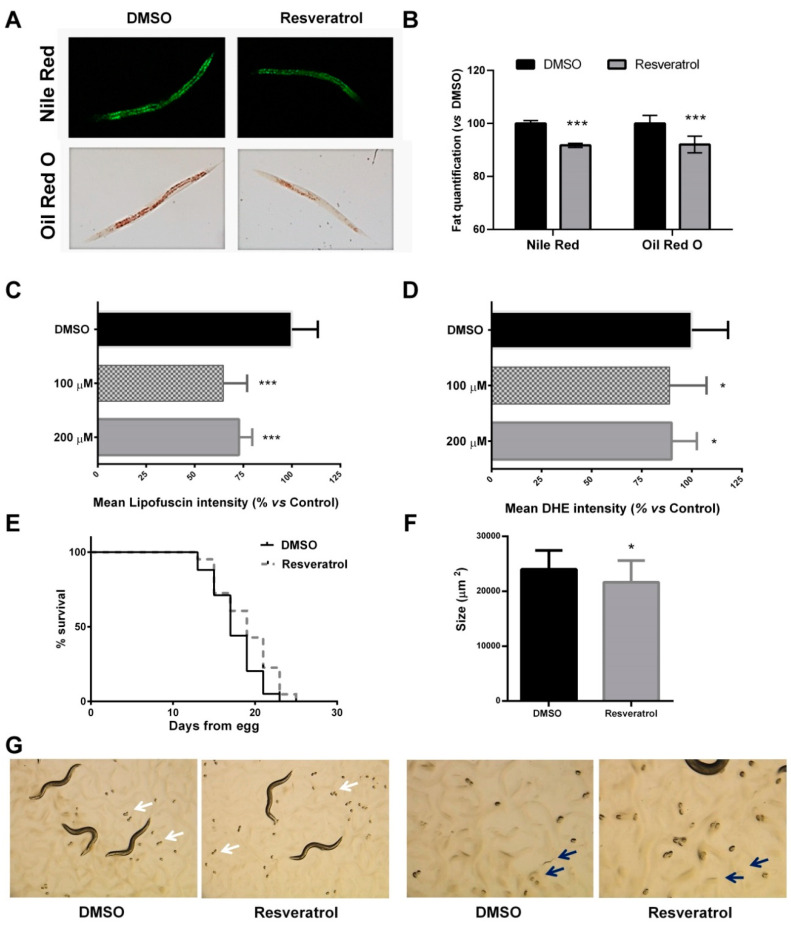
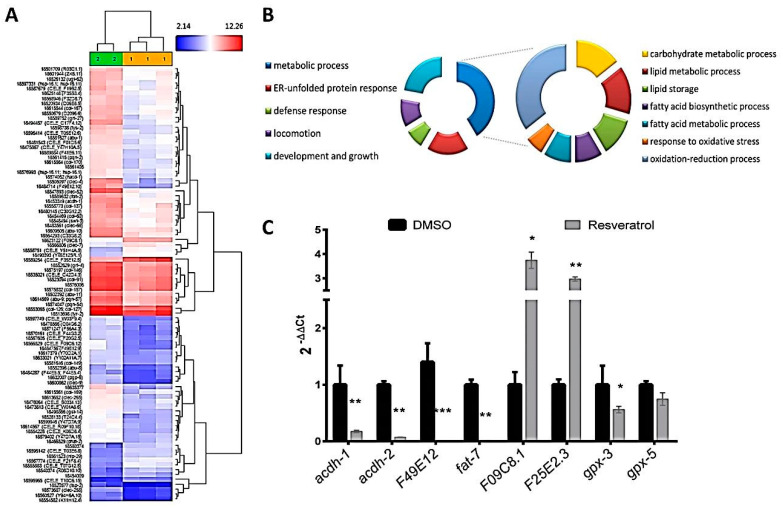
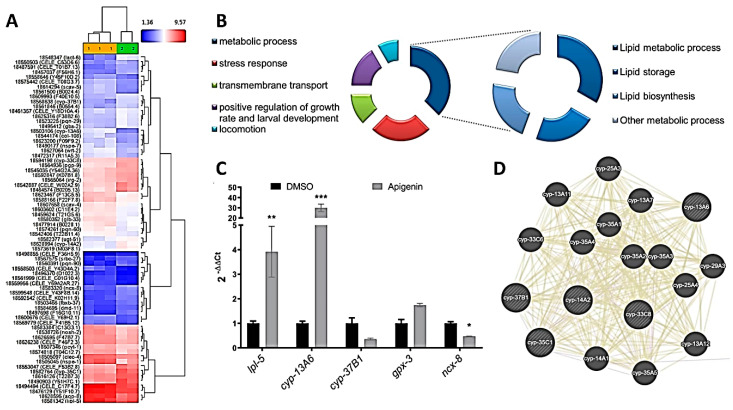
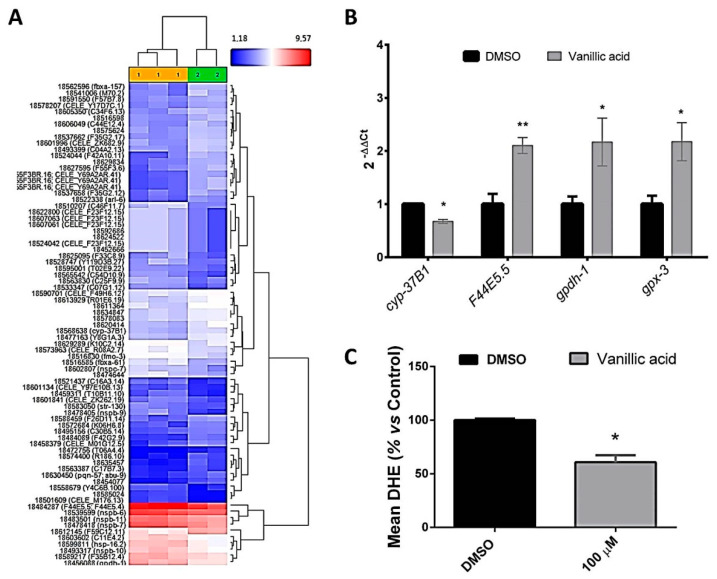
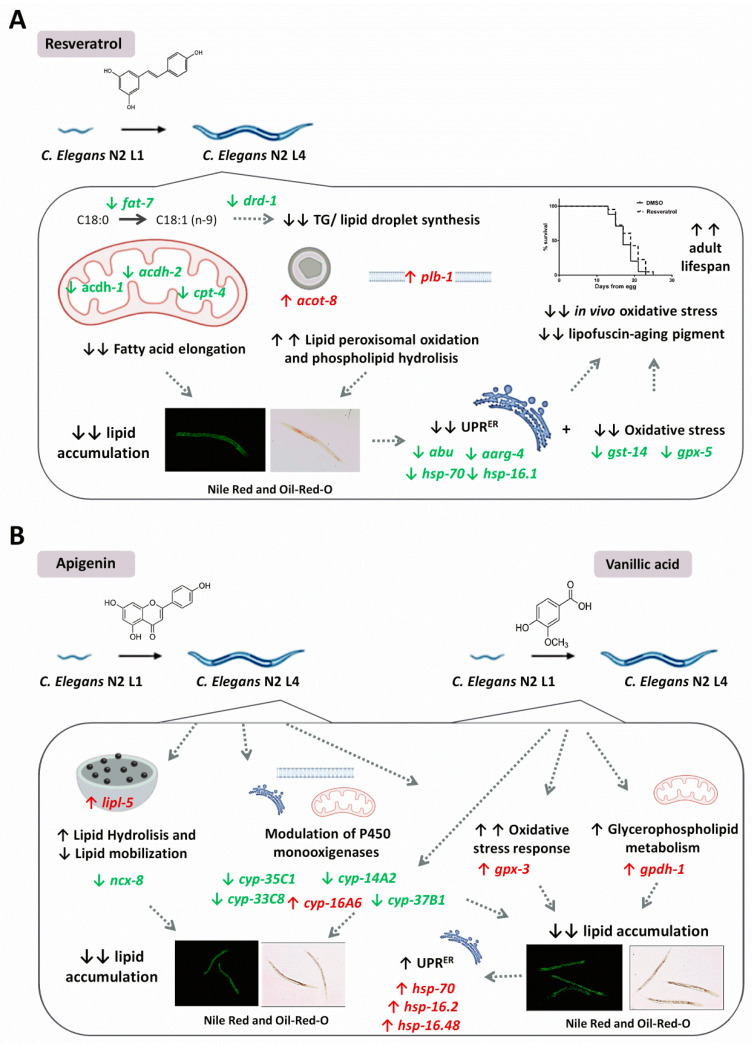
Supplementation with bioactive compounds capable of regulating energy homeostasis is a promising strategy to manage obesity. Here, we have screened the ability of different phenolic compounds (myricetin, kaempferol, naringin, hesperidin, apigenin, luteolin, resveratrol, curcumin, and epicatechin) and phenolic acids (p-coumaric, ellagic, ferulic, gallic, and vanillic acids) regulating C. elegans fat accumulation. Resveratrol exhibited the strongest lipid-reducing activity, which was accompanied by the improvement of lifespan, oxidative stress, and aging, without affecting worm development. Whole-genome expression microarrays demonstrated that resveratrol affected fat mobilization, fatty acid metabolism, and unfolded protein response of the endoplasmic reticulum (UPRER), mimicking the response to calorie restriction. Apigenin induced the oxidative stress response and lipid mobilization, while vanillic acid affected the unfolded-protein response in ER. In summary, our data demonstrates that phenolic compounds exert a lipid-reducing activity in C. elegans through different biological processes and signaling pathways, including those related with lipid mobilization and fatty acid metabolism, oxidative stress, aging, and UPR-ER response. These findings open the door to the possibility of combining them in order to achieve complementary activity against obesity-related disorders.
Keywords: apigenin; bioactive compounds; obesity; resveratrol; vanillic acid.
Conflict of interest statement
The authors declare no conflict of interest.
Figures
Similar articles
-
THE EFFECTS OF OXIDATIVE STRESS ON PHENOLIC COMPOSITION AND ANTIOXIDANT METABOLISM IN CALLUS CULTURE OF COMMON DAISY.Afr J Tradit Complement Altern Med. 2016 Jul 3;13(4):34-41. doi: 10.21010/ajtcam.v13i4.6. eCollection 2016. Afr J Tradit Complement Altern Med. 2016. PMID: 28852718 Free PMC article.
-
Luteolin reduces fat storage in Caenorhabditis elegans by promoting the central serotonin pathway.Food Funct. 2020 Jan 29;11(1):730-740. doi: 10.1039/c9fo02095k. Food Funct. 2020. PMID: 31912839
-
Phenolic compounds apigenin, hesperidin and kaempferol reduce in vitro lipid accumulation in human adipocytes.J Transl Med. 2017 Nov 21;15(1):237. doi: 10.1186/s12967-017-1343-0. J Transl Med. 2017. PMID: 29162103 Free PMC article.
-
Application of Caenorhabditis elegans for Research on Endoplasmic Reticulum Stress.Prev Nutr Food Sci. 2018 Dec;23(4):275-281. doi: 10.3746/pnf.2018.23.4.275. Epub 2018 Dec 31. Prev Nutr Food Sci. 2018. PMID: 30675455 Free PMC article. Review.
-
Pharmacology of bioactive compounds from plant extracts for improving non-alcoholic fatty liver disease through endoplasmic reticulum stress modulation: A comprehensive review.Heliyon. 2024 Jan 23;10(3):e25053. doi: 10.1016/j.heliyon.2024.e25053. eCollection 2024 Feb 15. Heliyon. 2024. PMID: 38322838 Free PMC article. Review.
Cited by
-
Antidiabetic and anti-obesity properties of a polyphenol-rich flower extract from Tagetes erecta L. and its effects on Caenorhabditis elegans fat storages.J Physiol Biochem. 2023 May;79(2):427-440. doi: 10.1007/s13105-023-00953-5. Epub 2023 Mar 24. J Physiol Biochem. 2023. PMID: 36961724 Free PMC article.
-
Naringin Alleviates Glucose-Induced Aging by Reducing Fat Accumulation and Promoting Autophagy in Caenorhabditis elegans.Nutrients. 2023 Feb 10;15(4):907. doi: 10.3390/nu15040907. Nutrients. 2023. PMID: 36839265 Free PMC article.
-
Caenorhabditis elegans as an in vivo model for food bioactives: A review.Curr Res Food Sci. 2022 May 13;5:845-856. doi: 10.1016/j.crfs.2022.05.001. eCollection 2022. Curr Res Food Sci. 2022. PMID: 35619588 Free PMC article. Review.
-
Role of apigenin in targeting metabolic syndrome: A systematic review.Iran J Basic Med Sci. 2024;27(5):524-534. doi: 10.22038/IJBMS.2024.71539.15558. Iran J Basic Med Sci. 2024. PMID: 38629096 Free PMC article. Review.
-
Anti-Obesity Properties of a Novel Probiotic Strain of Latilactobacillus sakei CNTA 173 in Caenorhabditis elegans.Int J Mol Sci. 2025 Apr 1;26(7):3286. doi: 10.3390/ijms26073286. Int J Mol Sci. 2025. PMID: 40244138 Free PMC article.
References
-
- Lanktree M.B., Hegele R.A. Genomic and Precision Medicine: Primary Care. 3rd ed. Elsevier; Amsterdam, The Netherlands: 2017. Metabolic Syndrome.
Grants and funding
LinkOut - more resources
Full Text Sources
