. 2020 Oct 30;21(21):8103.
doi: 10.3390/ijms21218103.

Aging-Affected MSC Functions and Severity of Periodontal Tissue Destruction in a Ligature-Induced Mouse Periodontitis Model

Affiliations

Aging-Affected MSC Functions and Severity of Periodontal Tissue Destruction in a Ligature-Induced Mouse Periodontitis Model

Kyaw Thu Aung et al. Int J Mol Sci. .

Abstract

Mesenchymal stem cells (MSCs) are known to play important roles in the repair of lost or damaged tissues and immunotolerance. On the other hand, aging is known to impair MSC function. However, little is currently known about how aged MSCs affect the host response to the local inflammatory condition and tissue deterioration in periodontitis, which is a progressive destructive disease of the periodontal tissue potentially leading to multiple tooth loss. In this study, we examined the relationship between aging-induced impairment of MSC function and the severity of periodontal tissue destruction associated with the decrease in host immunomodulatory response using a ligature-induced periodontitis model in young and aged mice. The results of micro computerized tomography (micro-CT) and histological analysis revealed a more severe bone loss associated with increased osteoclast activity in aged (50-week-old) mice compared to young (5-week-old) mice. Immunostaining analysis revealed that, in aged mice, the accumulation of inflammatory T and B cells was higher, whereas the percentage of platelet-derived growth factor receptor α (PDGFRα)+ MSCs, which are known to modulate the apoptosis of T cells, was significantly lower than in young mice. In vitro analysis of MSC function showed that the expression of surface antigen markers for MSCs (Sca-1, CD90, CD146), colony formation, migration, and osteogenic differentiation of aged MSCs were significantly declined compared to those of young MSCs. Moreover, a significantly higher proportion of aged MSCs were positive for the senescence-associated β galactosidase activity. Importantly, aged MSCs presented a decreased expression of FAS-L, which was associated with a lower immunomodulatory property of aged MSCs to induce T cell apoptosis in co-cultures compared with young MSCs. In summary, this is the first study showing that aging-induced impairment of MSC function, including immunomodulatory response, is potentially correlated with progressive periodontal tissue deterioration.

Keywords: aging; bone resorption; immunomodulation; mesenchymal stem cell; periodontitis; tissue destruction.


Conflict of interest statement

The authors declare no conflict of interest.

Figures

Figure 1
Figure 1
Periodontitis-associated bone resorption is more severe in aged mice. (A) Experimental design and timing of sample collection of the ligature-induced periodontitis model in mice. (B) Photographs of the control and periodontitis groups showing the ligature in the mandibular first molar of young (5-week-old) and aged (50-week-old) mice. Bar: 1 mm (C) Representative micro computerized tomography (micro-CT) images of control and periodontitis groups at day-3 and day-10 after ligation in young and aged mice (red arrow indicated bone loss). Bar: 1 mm (D) Bone loss measurement methods. (i) Area: measurement of the area corresponding to the exposed lingual root surfaces of the first mandibular molar as the horizontal limits, and the distances between the cemento–enamel junction (CEJ) and the resorbed alveolar bone crest as the vertical limits; (ii) depth: measurement of the linear distance from the CEJ to the alveolar bone crest on the mesiolingual and distolingual regions of the first mandibular molar, M: mesial, D: distal. Bar: 1 mm and (E) results of the micro-CT-based quantitative analysis of bone loss (i) area and (ii) depth, at day-3, and day-10 after ligation in young and aged mice. Note that aged mice showed more severe bone loss compared to young mice, either in the control or ligature-induced periodontitis groups. A two-way ANOVA showed a significant association between age and ligation-induced periodontitis. The bar graph represents the mean ± standard deviation of at least 3 independent samples. * p < 0.05, *** p < 0.001, two-way ANOVA, Tukey test (n = 3).
Figure 1
Figure 1
Periodontitis-associated bone resorption is more severe in aged mice. (A) Experimental design and timing of sample collection of the ligature-induced periodontitis model in mice. (B) Photographs of the control and periodontitis groups showing the ligature in the mandibular first molar of young (5-week-old) and aged (50-week-old) mice. Bar: 1 mm (C) Representative micro computerized tomography (micro-CT) images of control and periodontitis groups at day-3 and day-10 after ligation in young and aged mice (red arrow indicated bone loss). Bar: 1 mm (D) Bone loss measurement methods. (i) Area: measurement of the area corresponding to the exposed lingual root surfaces of the first mandibular molar as the horizontal limits, and the distances between the cemento–enamel junction (CEJ) and the resorbed alveolar bone crest as the vertical limits; (ii) depth: measurement of the linear distance from the CEJ to the alveolar bone crest on the mesiolingual and distolingual regions of the first mandibular molar, M: mesial, D: distal. Bar: 1 mm and (E) results of the micro-CT-based quantitative analysis of bone loss (i) area and (ii) depth, at day-3, and day-10 after ligation in young and aged mice. Note that aged mice showed more severe bone loss compared to young mice, either in the control or ligature-induced periodontitis groups. A two-way ANOVA showed a significant association between age and ligation-induced periodontitis. The bar graph represents the mean ± standard deviation of at least 3 independent samples. * p < 0.05, *** p < 0.001, two-way ANOVA, Tukey test (n = 3).
Figure 2
Figure 2
Increased periodontal space and osteoclast activity in the ligation-induced periodontitis in aged mice. (A) Hematoxylin and eosin HE staining showing the widening of the periodontal ligament space (bidirectional arrow) in both young and aged mice at day-3 and day-10 after ligation. Note a more severe bone loss and small pits (arrowhead) in aged mice (Black box indicated magnified area in HE staining). Bar: 100 µm. (B) Tartrate-resistant acid phosphatase TRAP staining confirming the higher number of TRAP+ cells (purple) in the furcation area of the mandibular first molar in aged mice at day-10 after ligation (Red box indicated magnified area in TRAP staining). Bar: 100 µm. The bar graph represents the mean ± standard deviation of at least 3 independent samples. * p < 0.05, ** p < 0.01, *** p < 0.001, two-way ANOVA, Tukey test, n = 3.
Figure 3
Figure 3
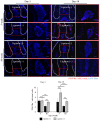
Increased inflammatory cell accumulation at the periodontitis site in aged mice. (A) Immunofluorescence images showing that the number of CD3+ T cells (green) increased at the furcation area in young and aged mice at day-3 and day-10 after ligation. Cell nuclei were stained with DAPI (blue) Bar: 100 µm. The graph shows the quantitative analysis of cell numbers, indicating a greater number of CD3+ T cells in aged mice. (B) Immunofluorescence images showing the accumulation of B220+ B cells (green) at the furcation area in young and aged mice at day-3 and day-10 after ligation. Cell nuclei were stained with DAPI (blue) Bar: 100 µm. The graph shows the quantitative analysis of cell number, indicating that the number of B220+ B cells is significantly higher in aged mice either at day-3 or day-10 after ligation. For (A,B), the bar graph represents the mean ± standard deviation of at least three independent samples. * p < 0.05, ** p < 0.01, *** p < 0.001, two-way ANOVA, Tukey test, n = 3.
Figure 4
Figure 4
Reduced number of MSCs at the periodontitis site in aged mice. Immunofluorescence images show the number of platelet-derived growth factor receptor α (PDGFRα)+ MSCs (red) in the furcation area in young and aged mice. Cell nuclei were stained with DAPI (blue). Bar: 100 µm. The graph shows the quantitative analysis indicating that the number of PDGFRα+ Mesenchymal stem cells (MSCs) is decreased in aged mice, more prominently at day-10 after ligation. The bar graph represents the mean ± standard deviation of at least three independent samples. * p < 0.05, ** p < 0.01, *** p < 0.001, two-way ANOVA, Tukey test (n = 3).
Figure 5
Figure 5
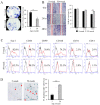
Functional impairment of MSCs from aged mice. (A) Photograph and graph showing the quantitative analysis of the number of colonies (CFU-f) formed from flushed bone marrows from young and aged mice. Bar: 500 µm. Note that the CFU-f number is significantly lower in specimens from aged mice. The bar graph represents the mean ± standard deviation of at least 3 independent samples. ** p < 0.01, unpaired Student’s t-test, n = 3. (B) Representative images of an in vitro wound healing (scratch) assay using MSCs isolated from young and aged mice. Bar: 500 µm. Note that aged MSCs show slower migration ability compared to MSCs from young mice. The bar graph represents the mean ± standard deviation of at least 3 independent samples. ** p < 0.01, two-way ANOVA, Tukey test, n = 3. (C) Expression of major surface antigen markers for MSCs (Sca-1, CD44, CD90, CD146) in young and aged MSCs determined by flow cytometry. Note that the MSCs show almost no expression of the hematopoietic stem cell markers, CD14 and CD34. Note also that all markers, except for CD44, were significantly decreased in aged MSCs. (D) Staining and quantitative analysis of senescence-associated (SA) β-Gal+ cells (Red arrow) showing a significantly higher number of senescent cells in aged compared to young MSCs. Bar: 100 µm. The bar graph represents the mean ± standard deviation of at least 3 independent samples. *** p < 0.001, unpaired Students’ t-test, n = 3.
Figure 6
Figure 6
Reduced osteogenic differentiation and immunomodulation in aged MSCs. (A) Alizarin red-S staining showing less ability of mineral deposition by aged MSCs compared to young MSCs after osteogenic induction for 21 days. The expression of osteoblast marker genes (Alp, Ocn) was determined by real-time RT-PCR. Note the weak staining for alizarin red-S and unchanged expression of Alp and Ocn in aged MSCs cultured in osteogenic medium for 21 days, indicating the low osteogenic differentiation ability of the aged cells. The bar graph represents the mean ± standard deviation of at least 3 independent samples. *** p < 0.001, one-way ANOVA, Tukey test, n = 3. Alp: Alkaline phosphatase, Ocn: Osteocalcin. (B) Oil red-O staining showing a dramatically increased formation of lipid droplets by aged MSCs compared to young MSCs. Bar: 100 µm. The expression levels of early adipogenic differentiation markers (Pparγ and Lpl) were significantly higher in aged than in young MSCs. The bar graph represents the mean ± standard deviation of at least 3 independent samples. *** p < 0.001, one-way ANOVA, Tukey test, n = 3. Pparγ: Peroxisome proliferator-activated receptor γ, Lpl: lipoprotein lipase. (C) Flow cytometric analysis showing a decreased expression of FAS-L in aged MSCs (upper left panel). After co-culture, young and aged MSCs could induce apoptosis of CD4+ T cells, as determined by flow cytometric analysis of Annexin V+ apoptotic T cells (lower left graph and right panel). Note that the ability of aged MSCs to induce T cell apoptosis is significantly reduced compared to young MSCs. The bar graph represents the mean ± standard deviation of at least 3 independent samples. *** p < 0.001, one-way ANOVA, Tukey test, n = 3.

Similar articles

Cited by

References

    1. World Health Organization International Statistical Classification of Diseases and Related Health Problems. [(accessed on 23 October 2020)]; Available online: https://icd.who.int/
    1. Niccoli T., Partridge L. Ageing as a Risk Factor for Disease. Curr. Biol. 2012;22:R741–R752. doi: 10.1016/j.cub.2012.07.024. - DOI - PubMed
    1. Reeve A., Simcox E., Turnbull D. Ageing and Parkinson’s disease: Why is advancing age the biggest risk factor? Ageing Res. Rev. 2014;14:19–30. doi: 10.1016/j.arr.2014.01.004. - DOI - PMC - PubMed
    1. Fortier L.A. Stem Cells: Classifications, Controversies, and Clinical Applications. Veter Surg. 2005;34:415–423. doi: 10.1111/j.1532-950X.2005.00063.x. - DOI - PubMed
    1. Mason C., Dunnill P. A brief definition of regenerative medicine. Regen. Med. 2008;3:1–5. doi: 10.2217/17460751.3.1.1. - DOI - PubMed